-
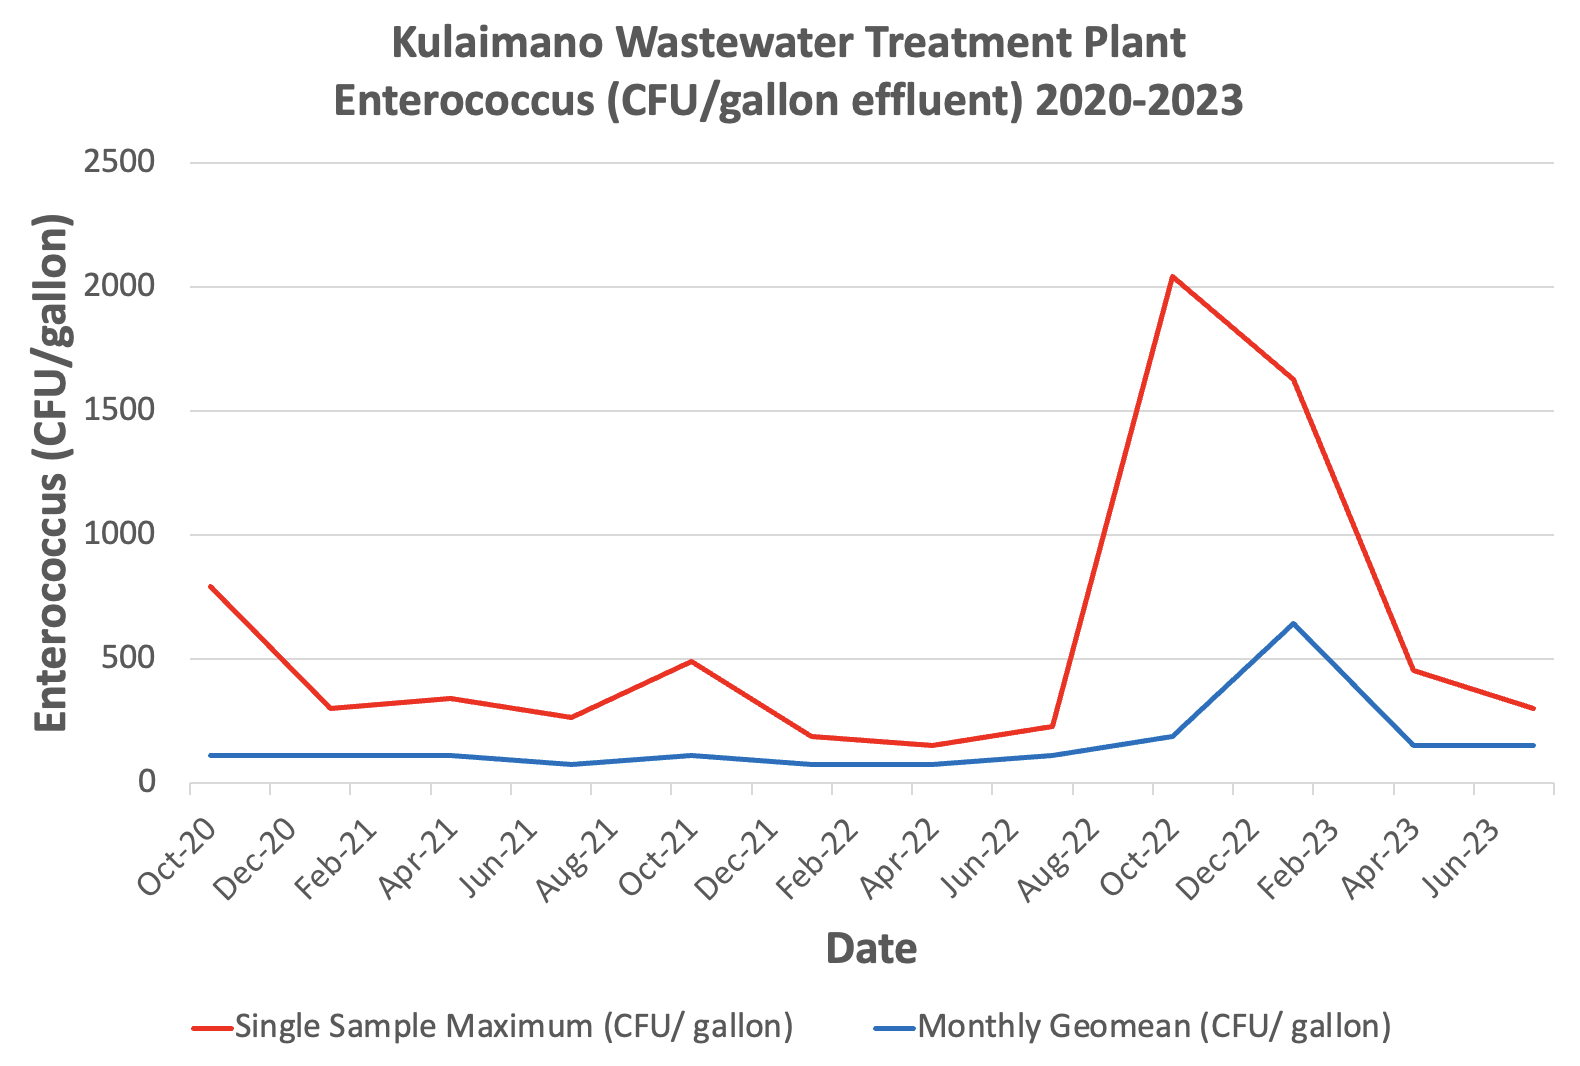
Single sample maximum and monthly geomean concentrations of Enterococcus at Kulaimano Wastewater Treatment Plant from 2020-2023.
-
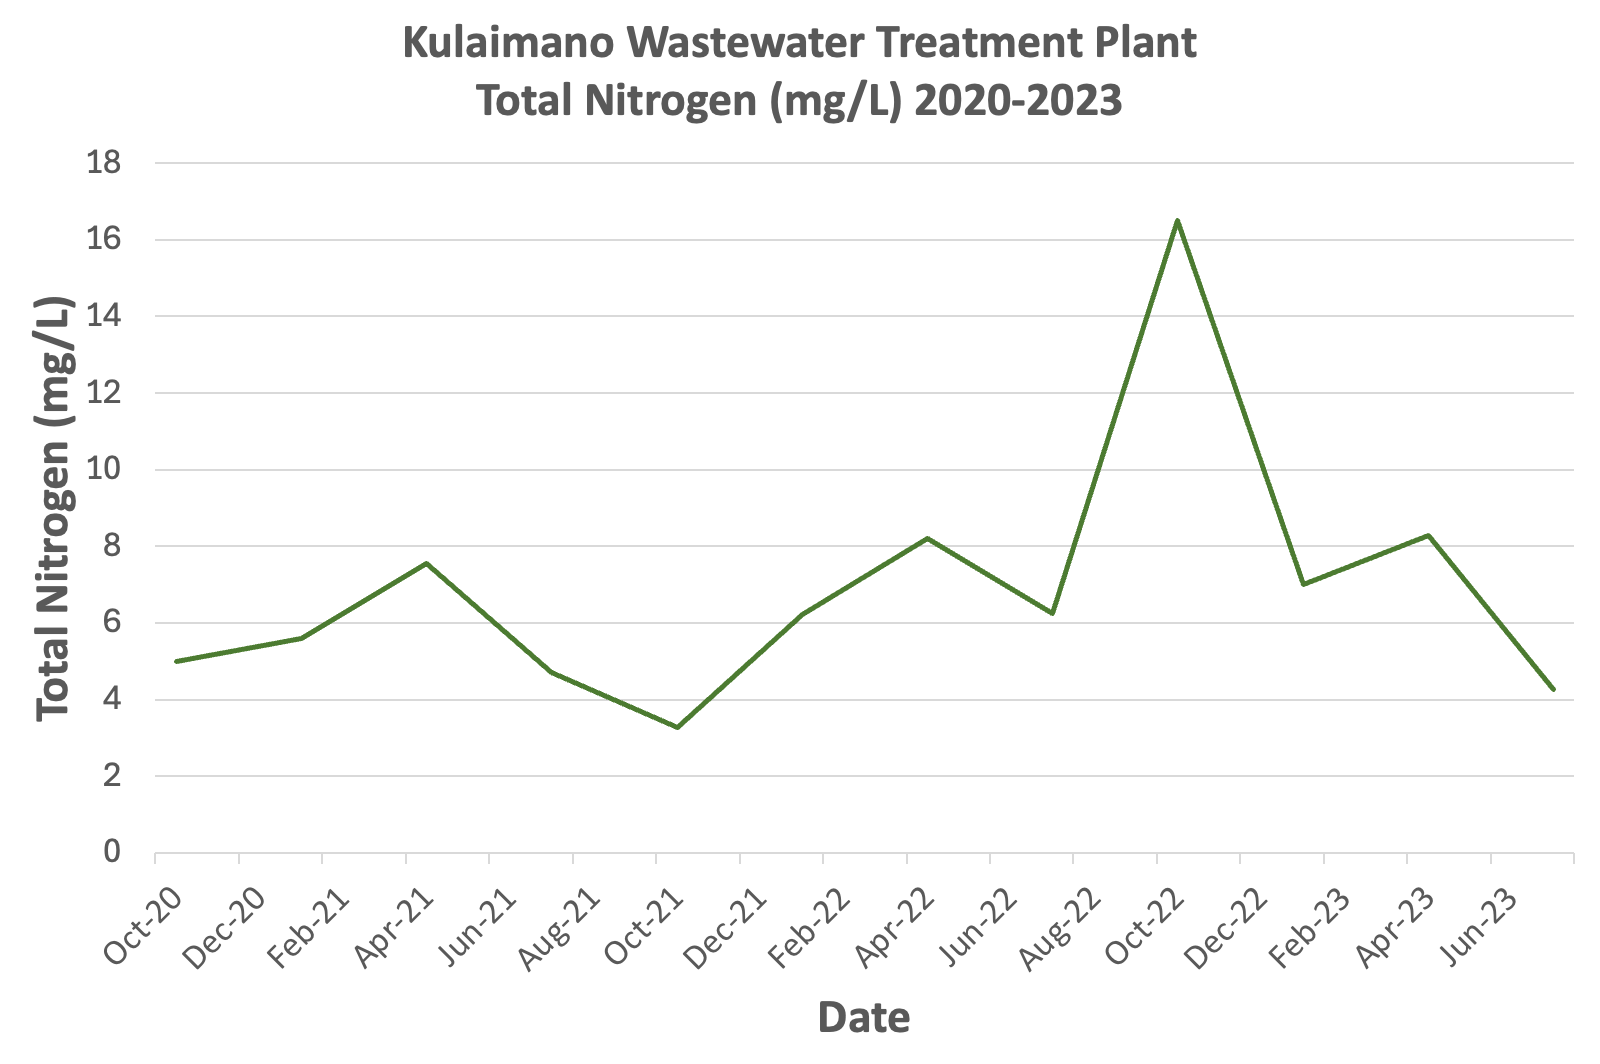
Concentrations of TN at Kulaimano Wastewater Treatment Plant shows an increasing trend from 2020-2023, with the highest concentration peaks in Oct/Nov 2022.
-
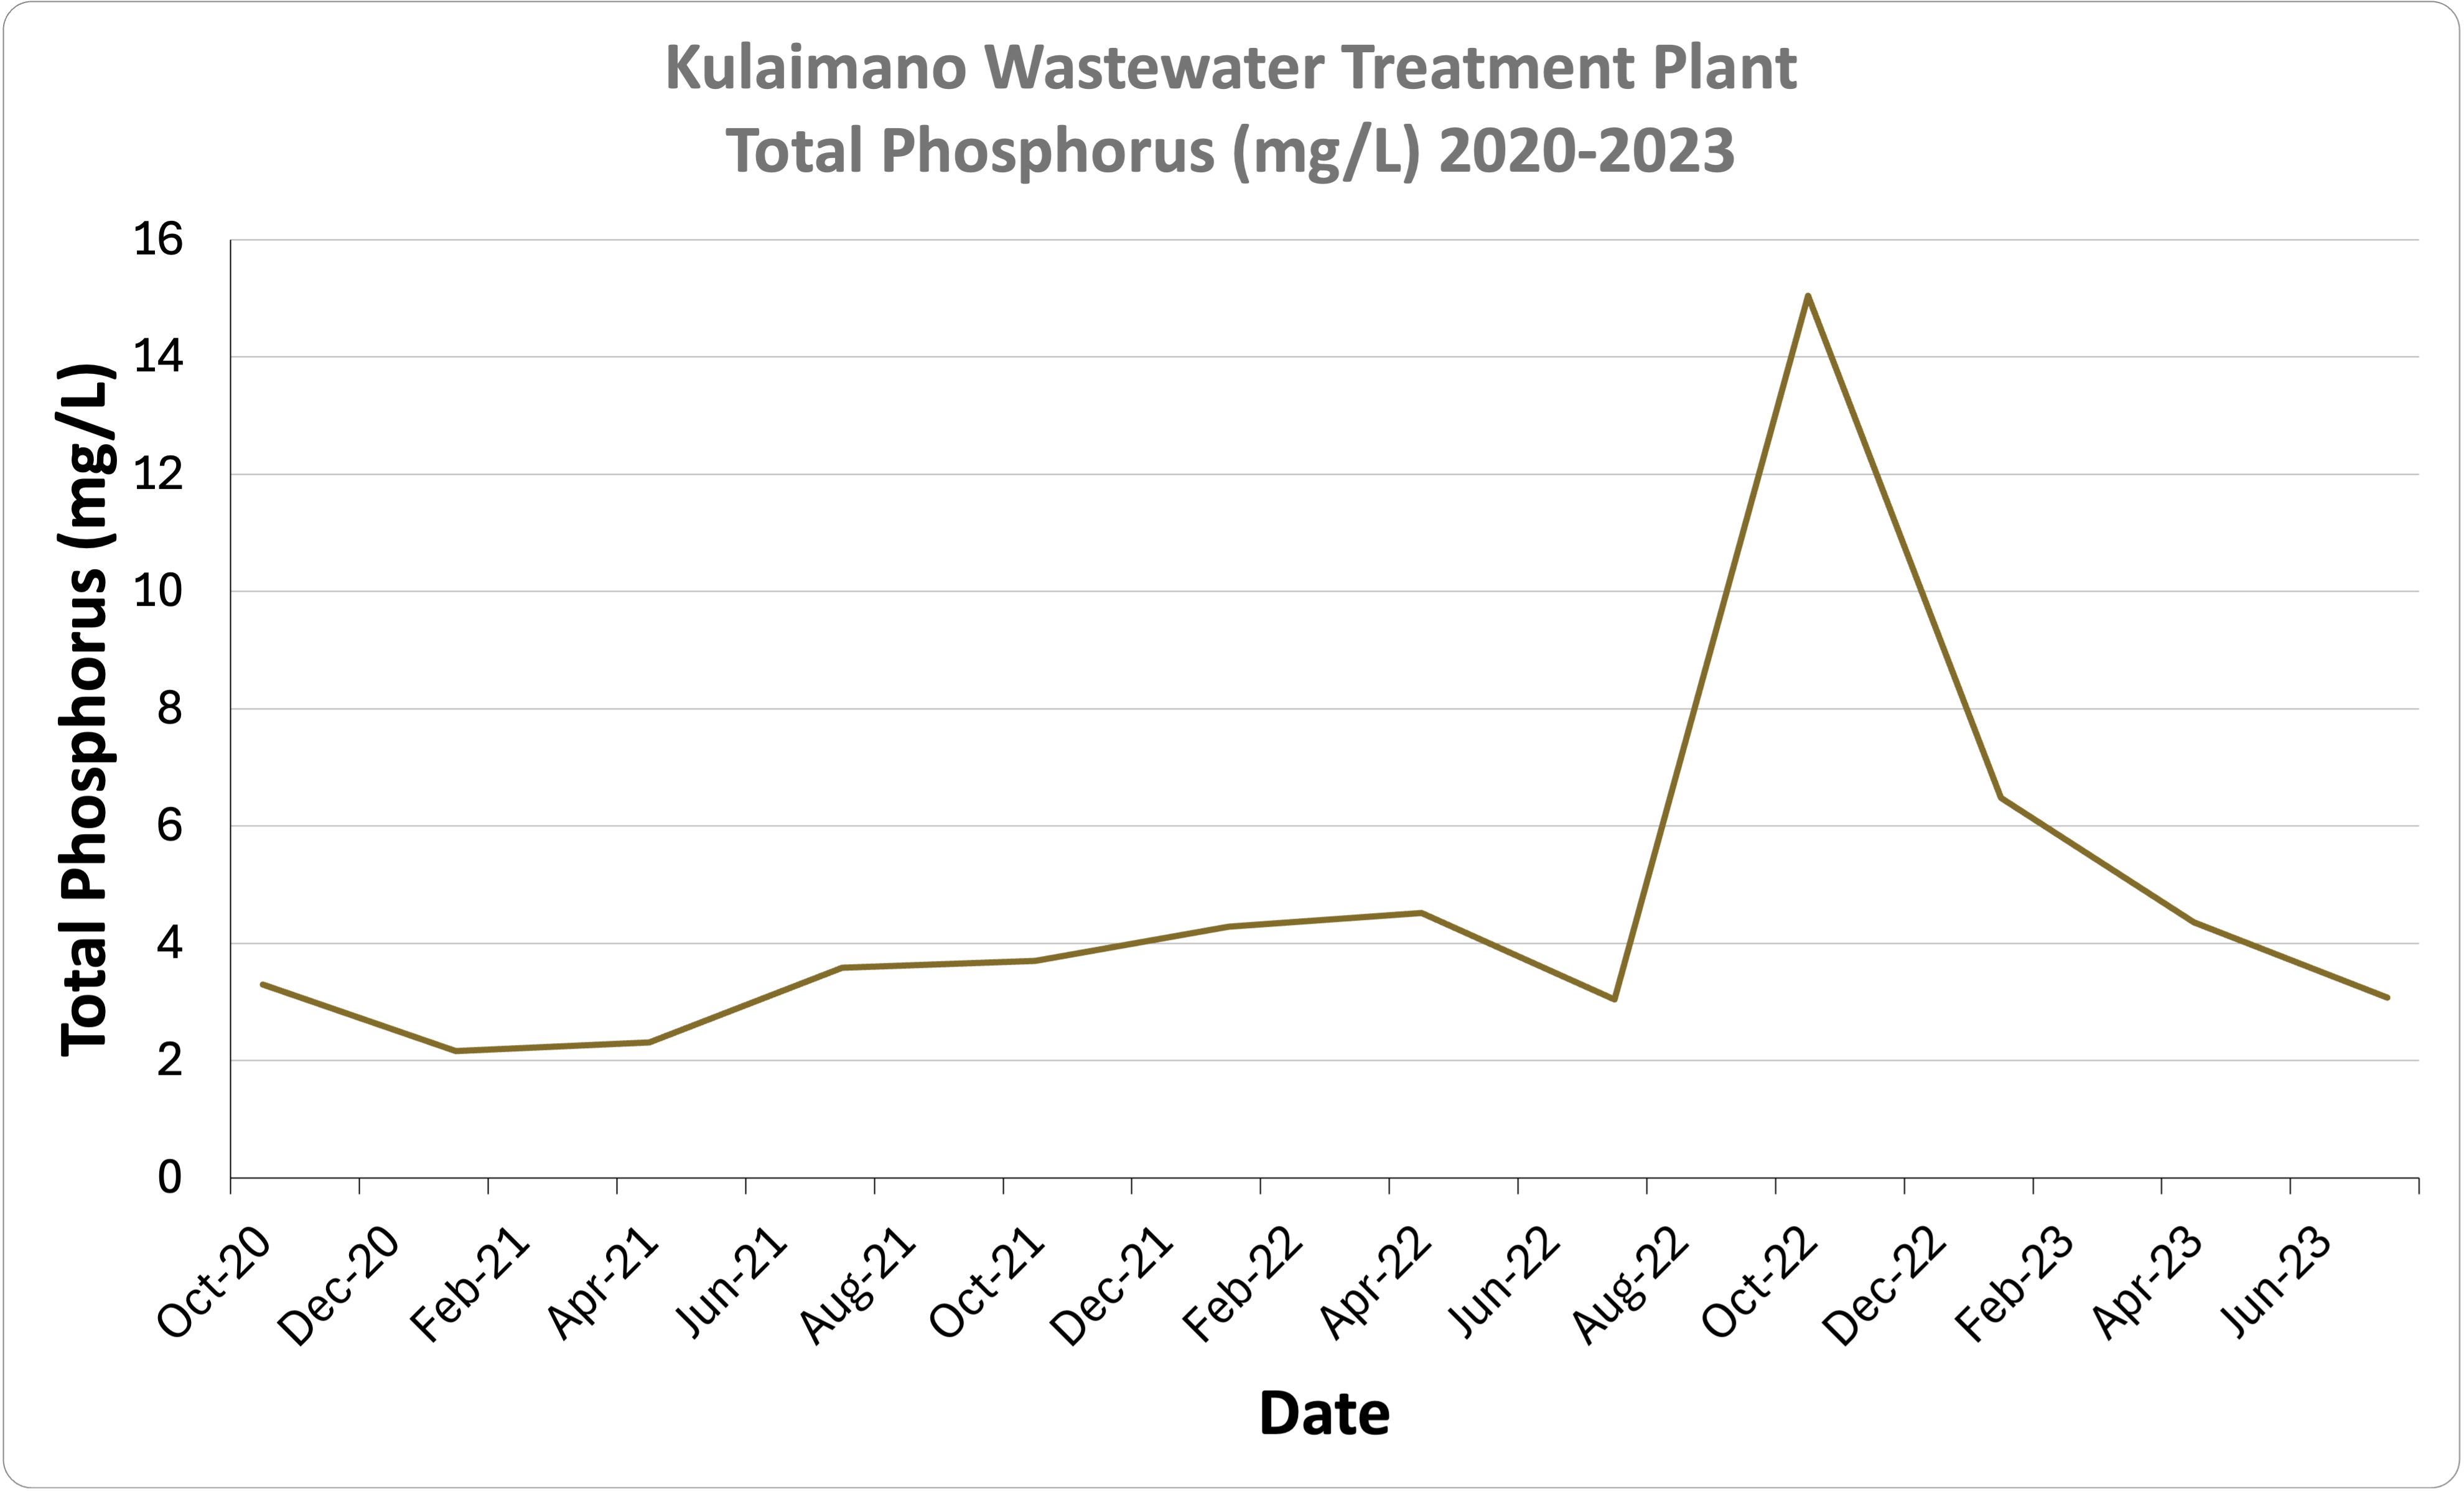
Concentrations of TP at Kulaimano Wastewater Treatment Plant shows an increasing trend from 2020-2023, with the highest concentration in Oct 2022.
-
Turbidity shows a stable trend from Oct 2020 - Jun 2023.

-
Kulaimano Wastewater Treatment Plant Water Quality History
Date Single Sample Maximum (CFU/ gallon) Monthly Geomean (CFU/ gallon) TP (ug/L) TP (mg/L) TP (lbs/day) TN (ug/L) TN (mg/L) TN (lbs/day) Turbidity (NTU) 10/12/2020 795 114 3300 3.3 2.3 4984 4.984 3.5 1.4 1/13/2021 303 114 2160 2.16 1.8 5597 5.597 5.2 2.5 4/16/2021 341 114 2310 2.31 1.8 7540 7.54 5.9 2.3 7/13/2021 265 76 3580 3.58 2.8 4710 4.71 3.7 2.6 10/4/2021 492 114 3700 3.7 3.1 3278 3.278 2.8 2 1/25/2022 189 76 4280 4.28 3.7 6208 6.208 5.3 1.4 4/18/2022 151 76 4520 4.52 3.6 8210 8.21 6.6 3.2 7/11/2022 227 114 3040 3.04 2.1 6240 6.24 4.4 4.1 10/11/2022 2044 189 15040 15.04 10.4 16510 16.51 11.4 1.2 1/9/2023 1628 644 6480 6.48 5.5 6990 6.99 5.9 1.49 4/5/2023 454 151 4360 4.36 3.6 8280 8.28 6.8 3.3 7/25/2023 303 151 3080 3.08 2.5 4253 4.253 3.6 1.24