-
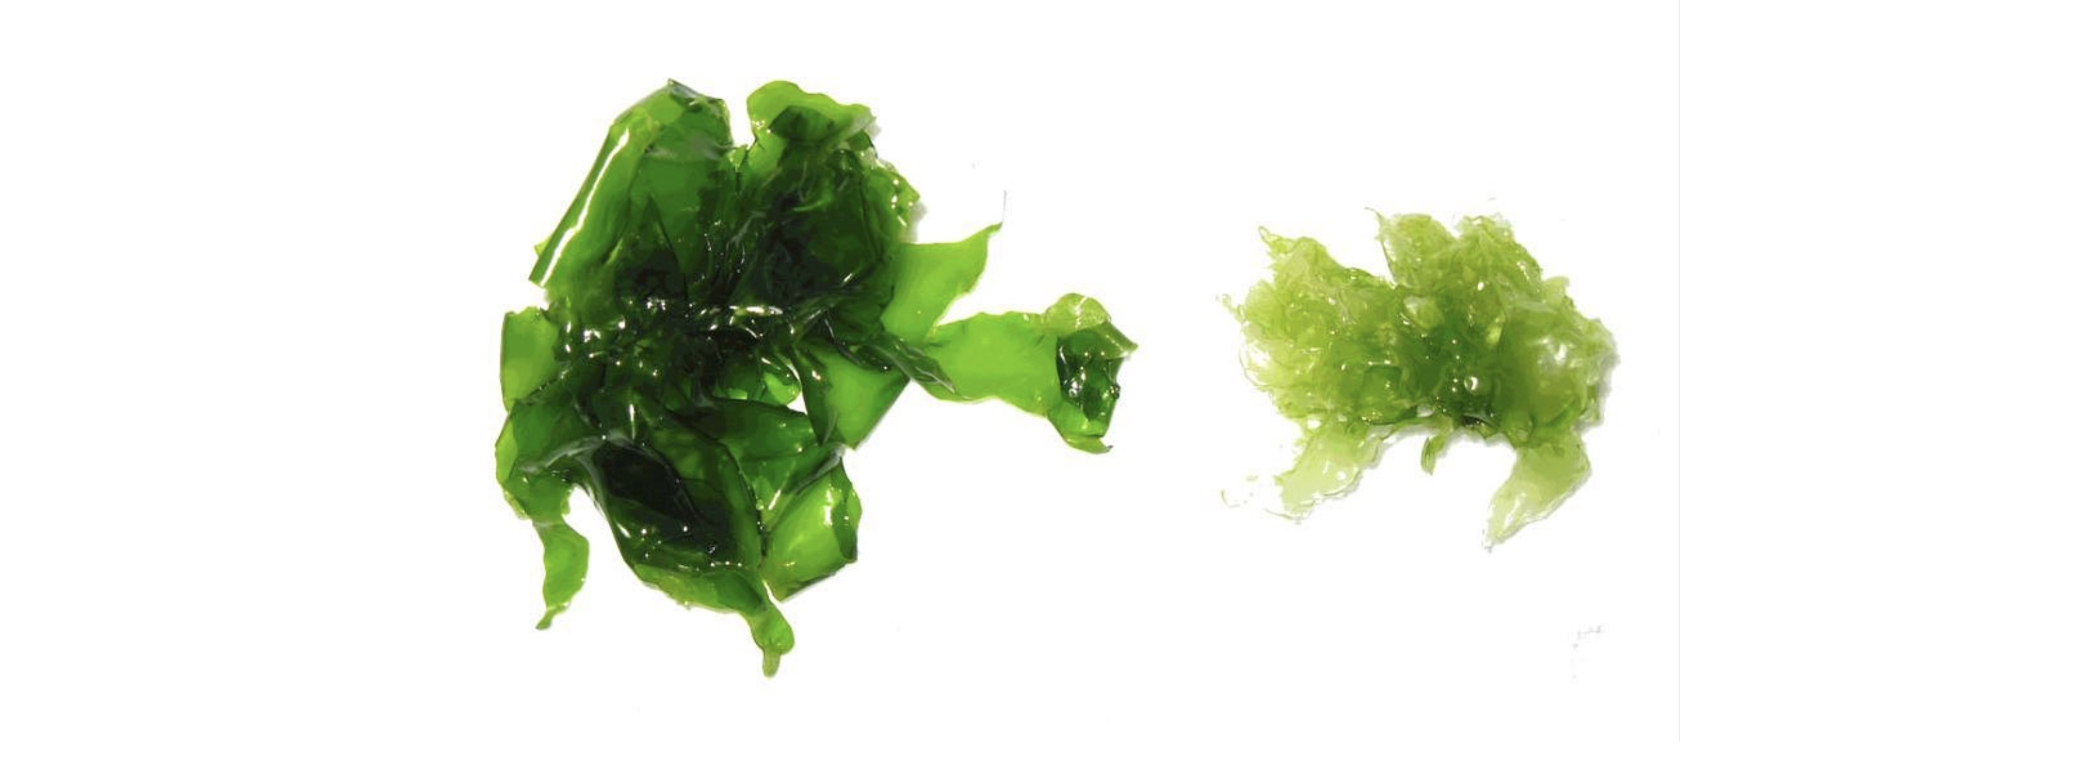
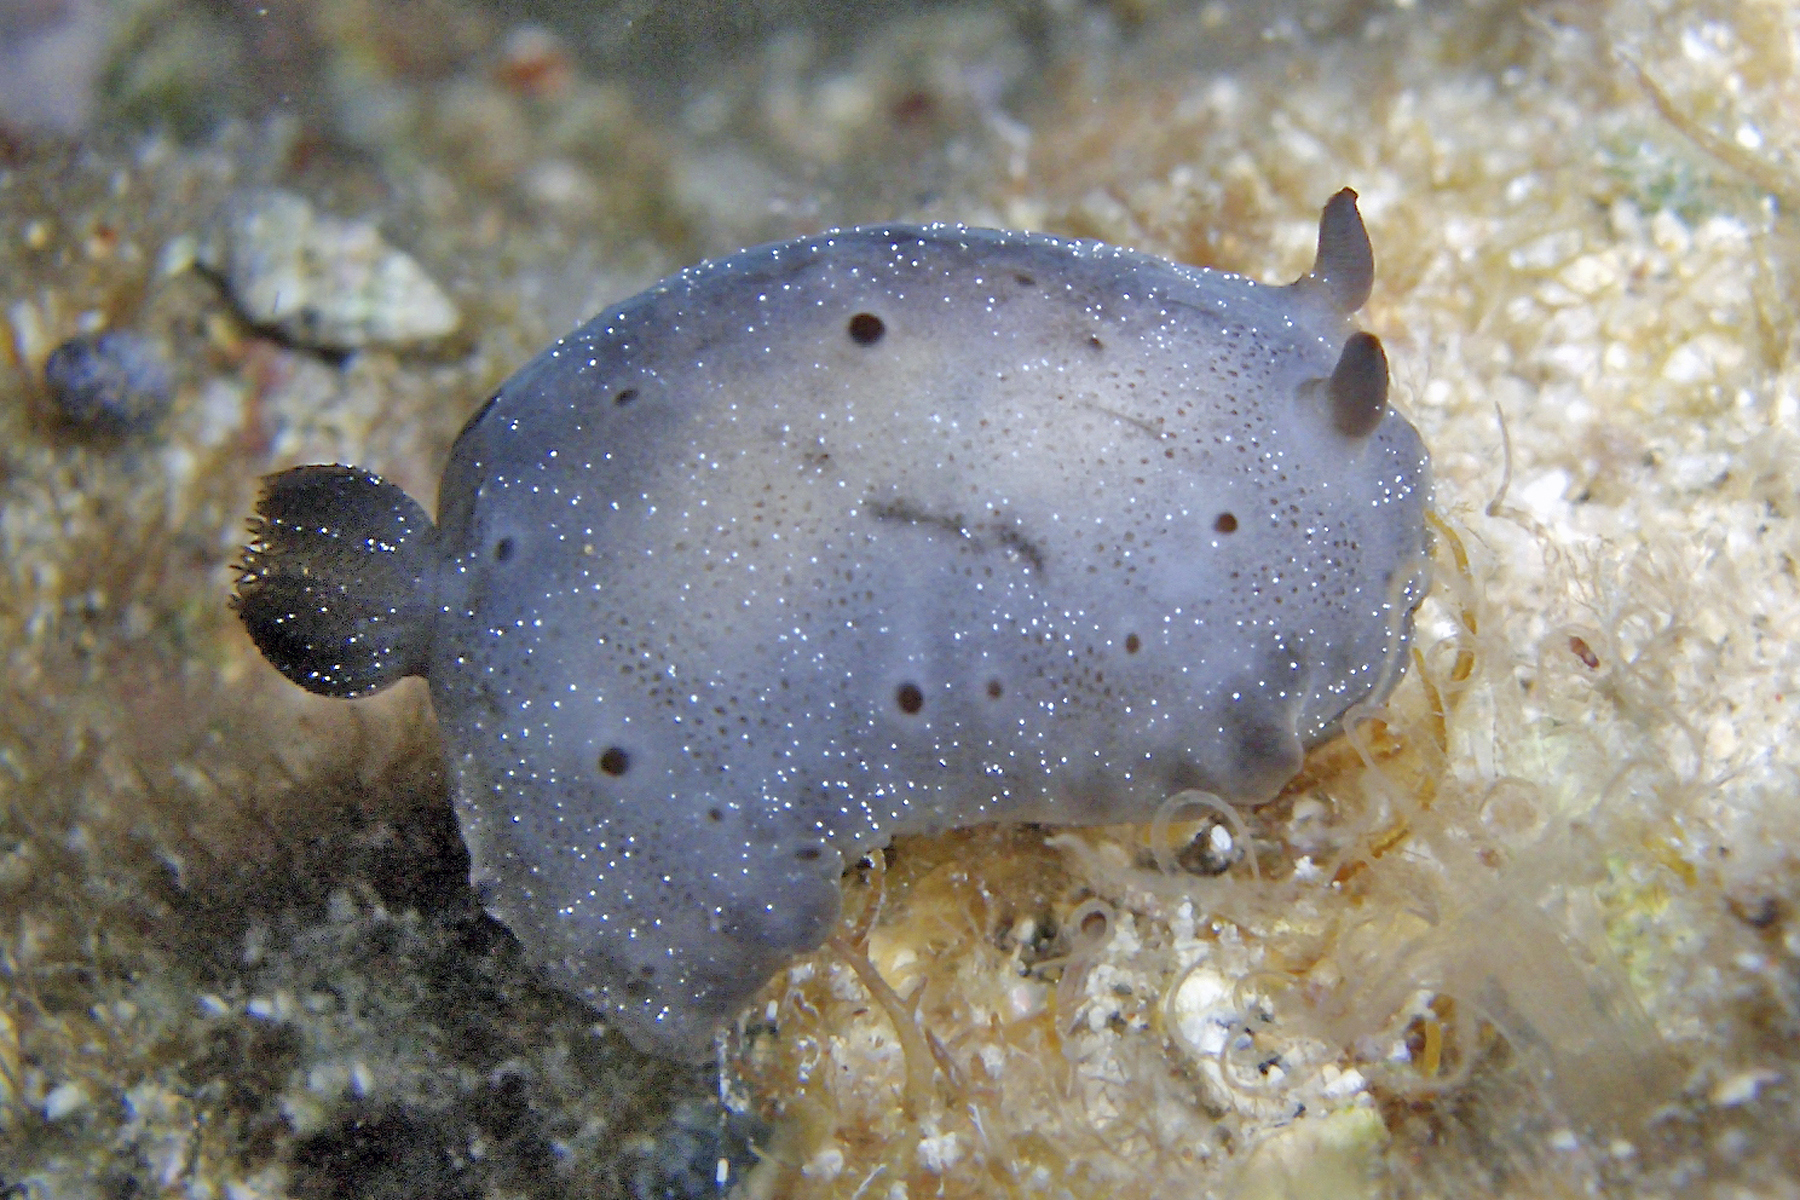
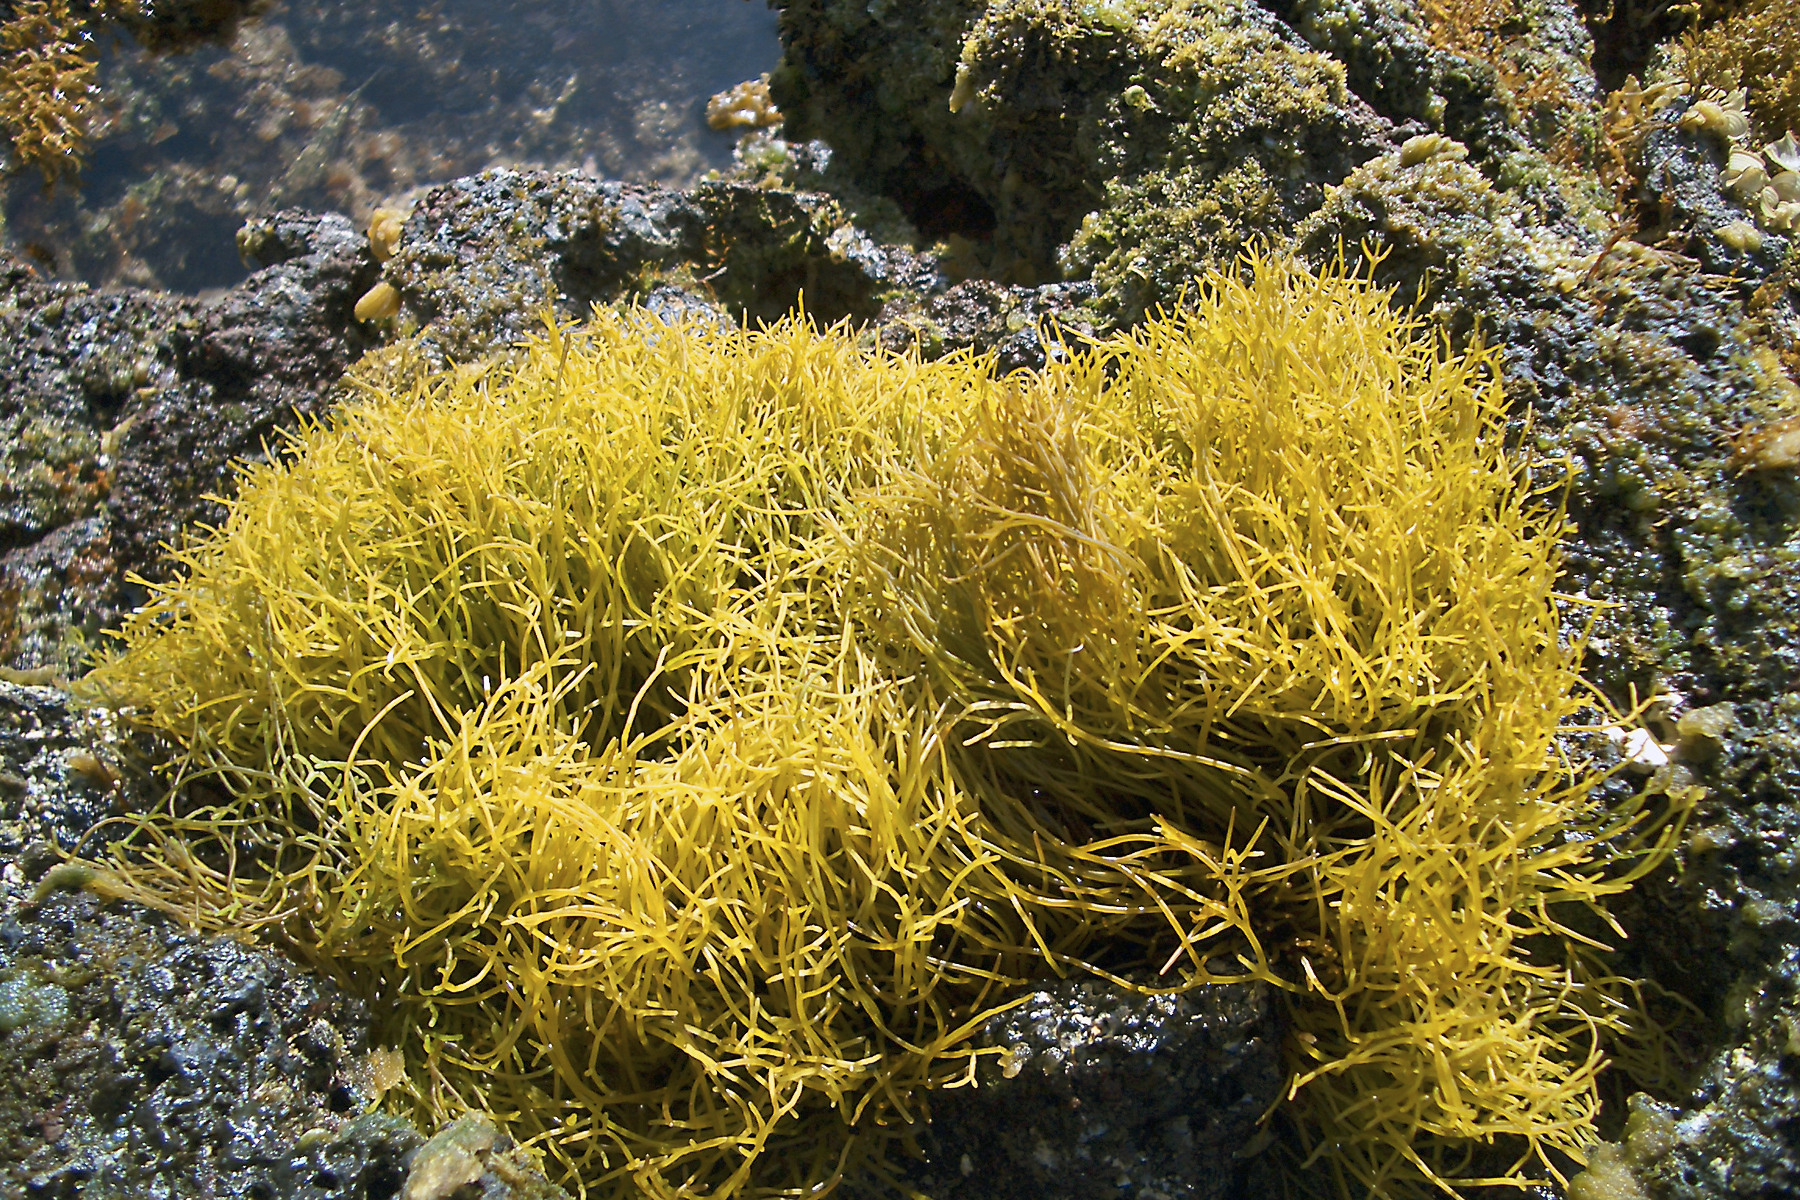
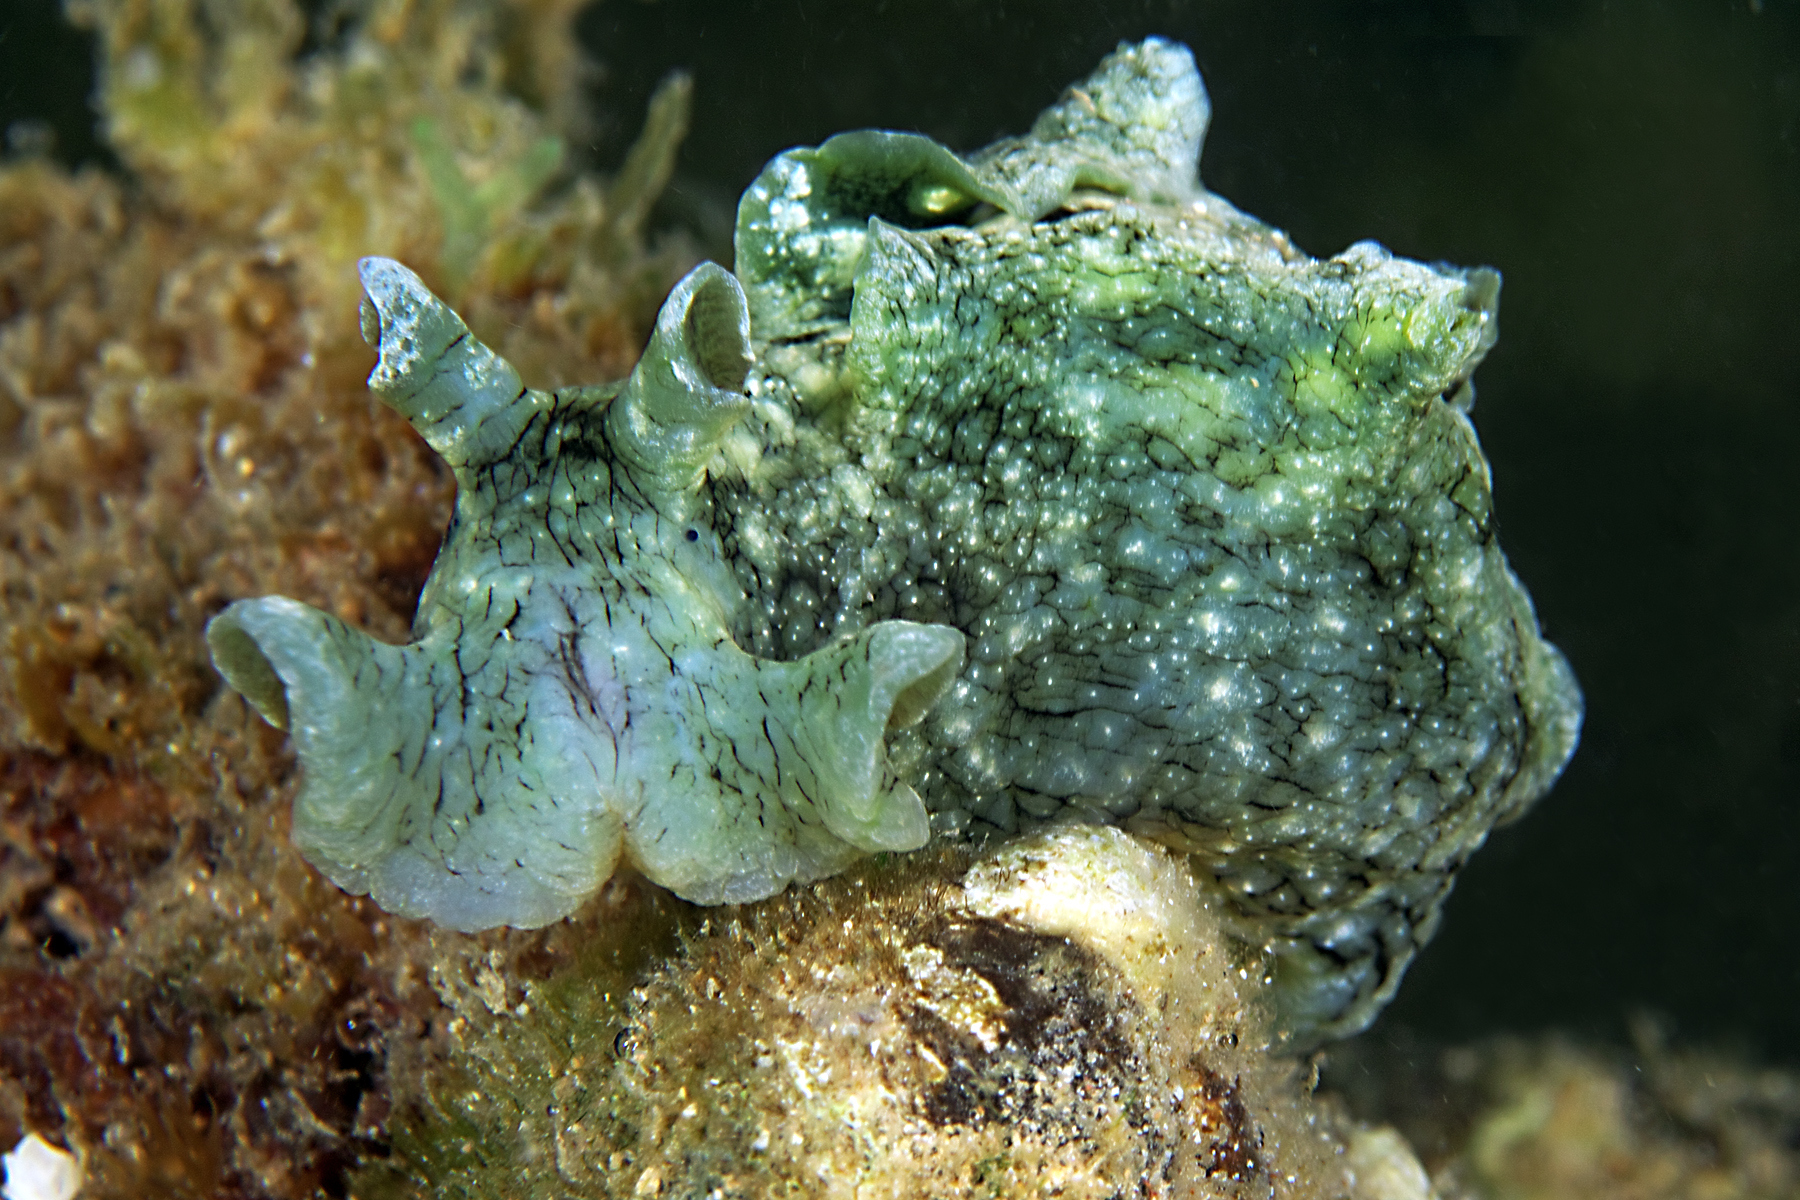
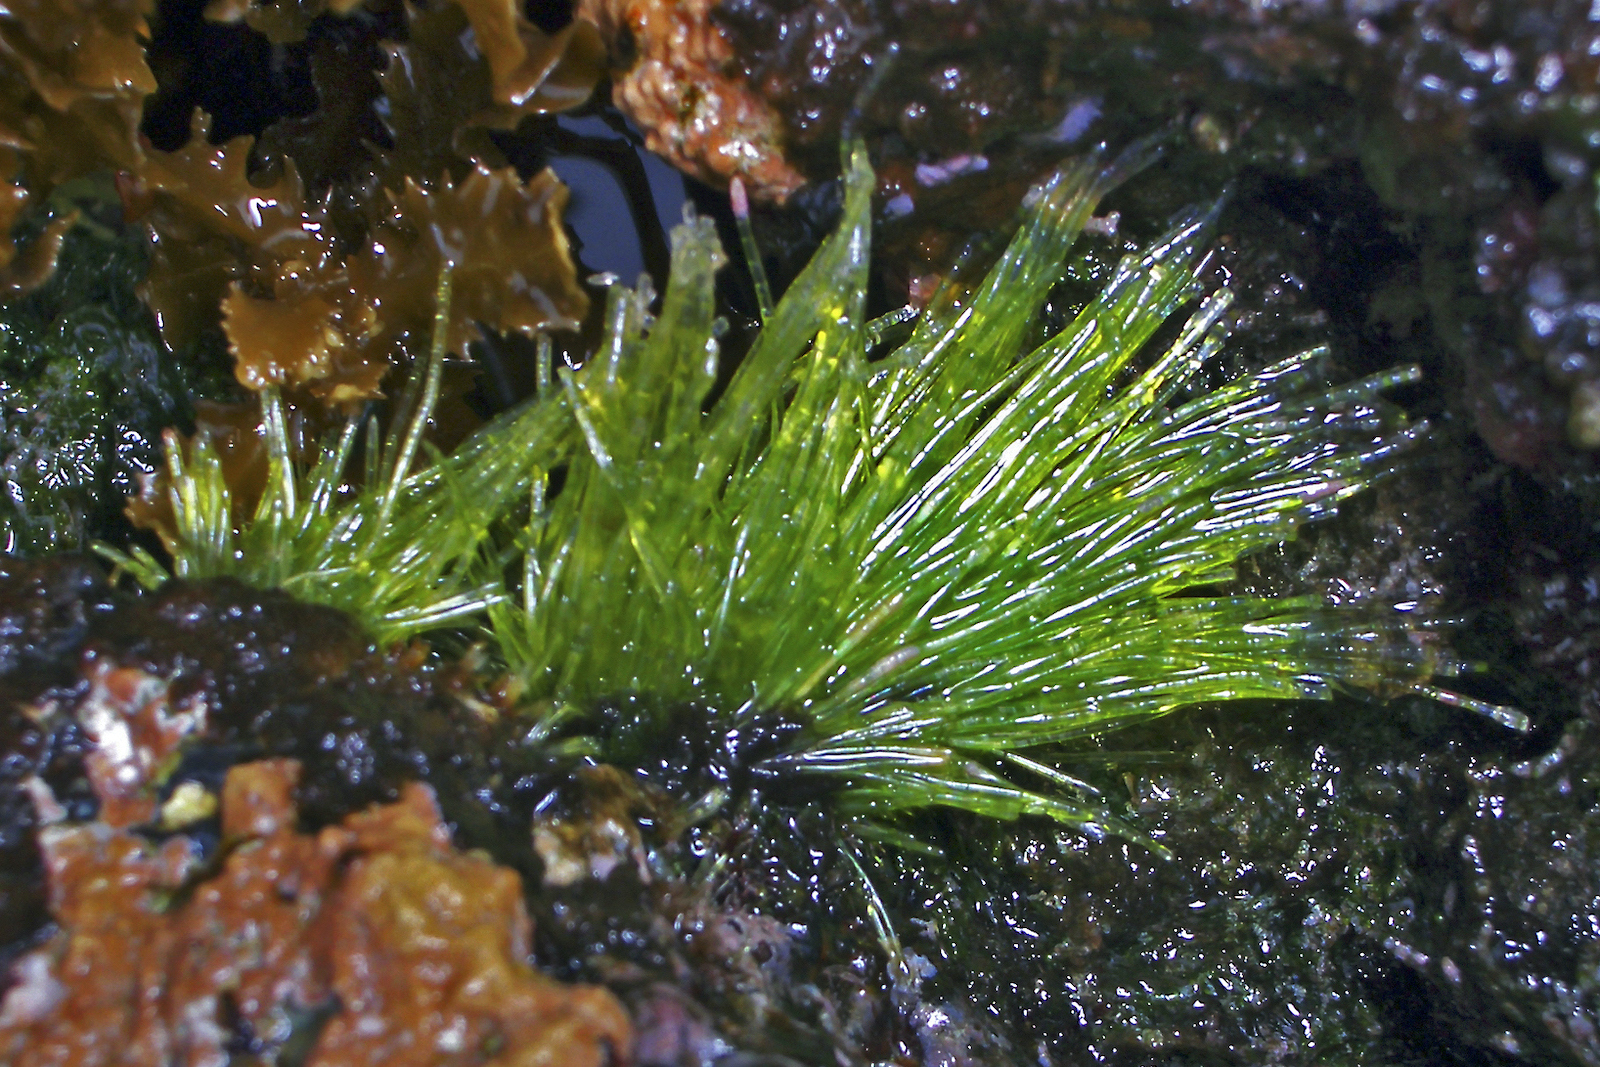
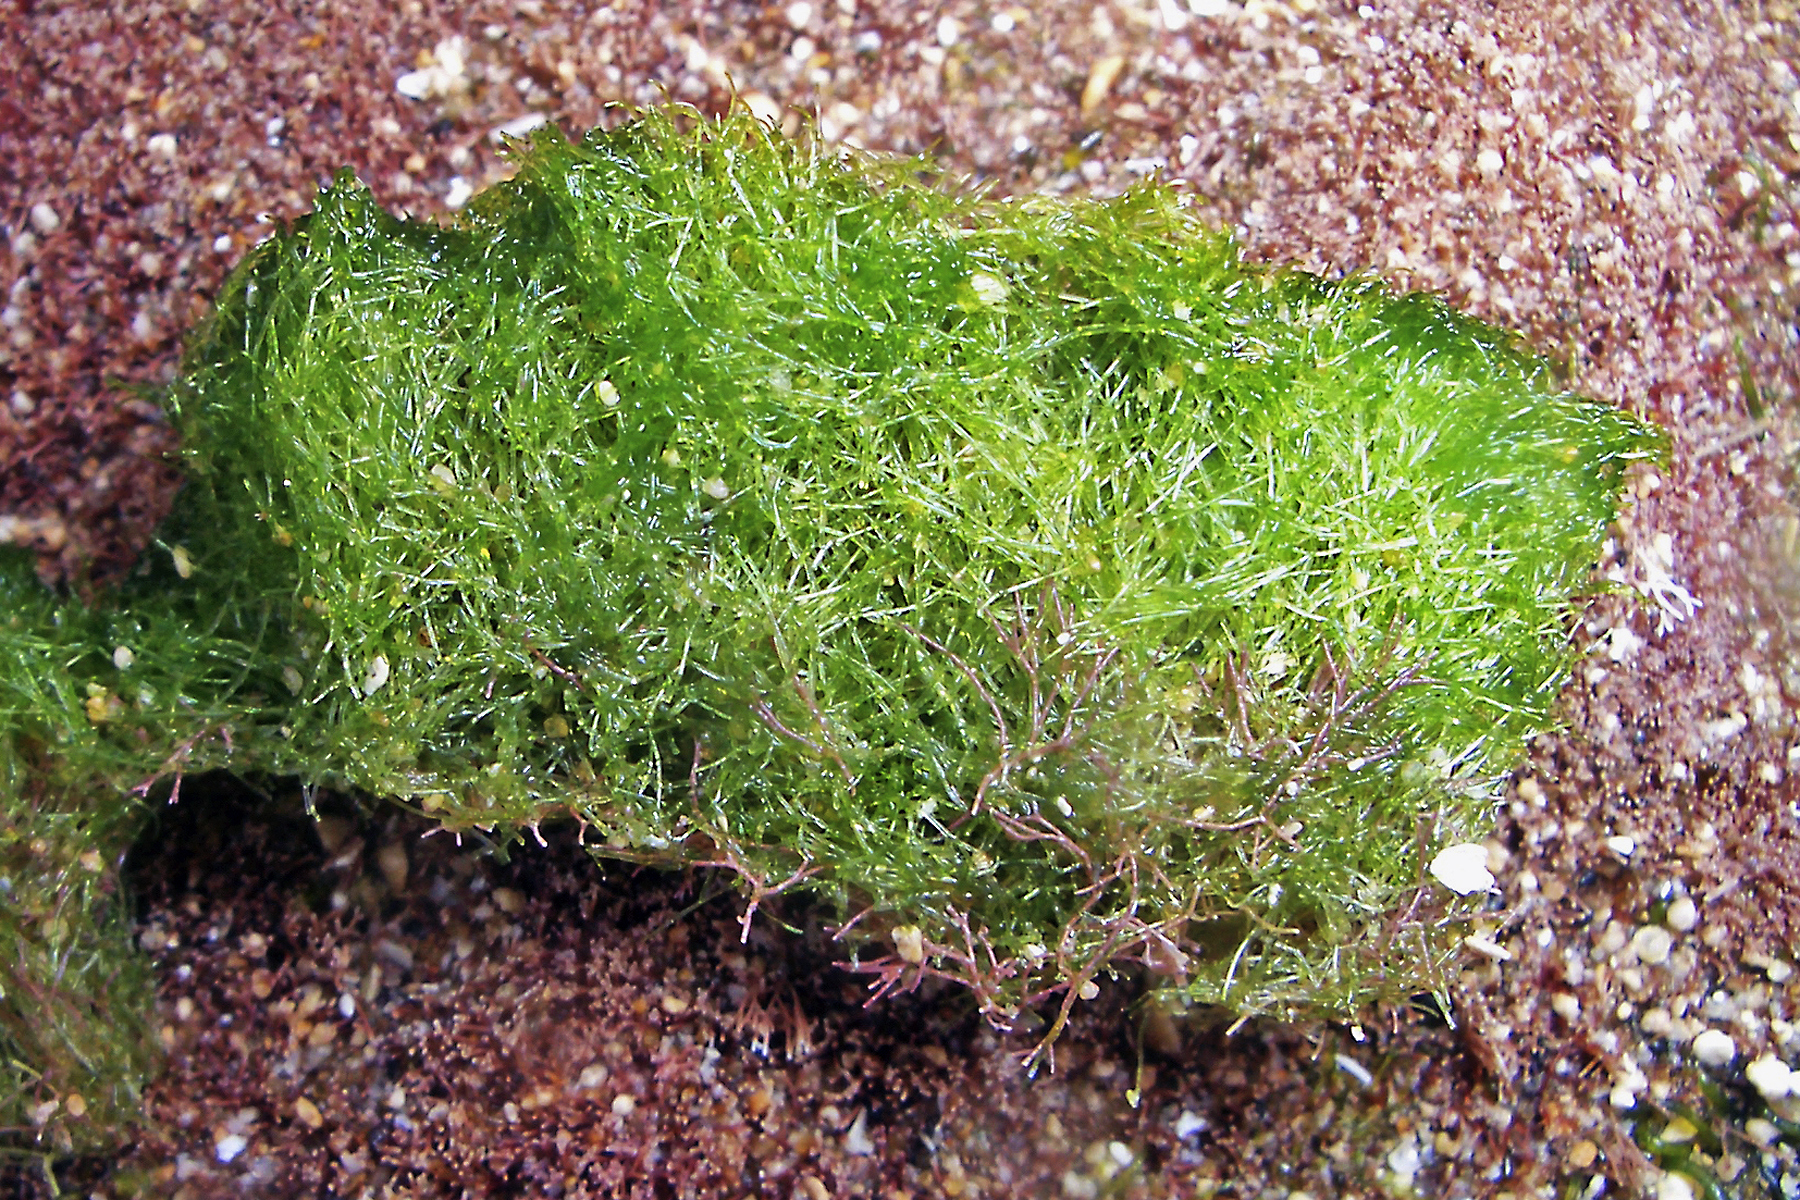
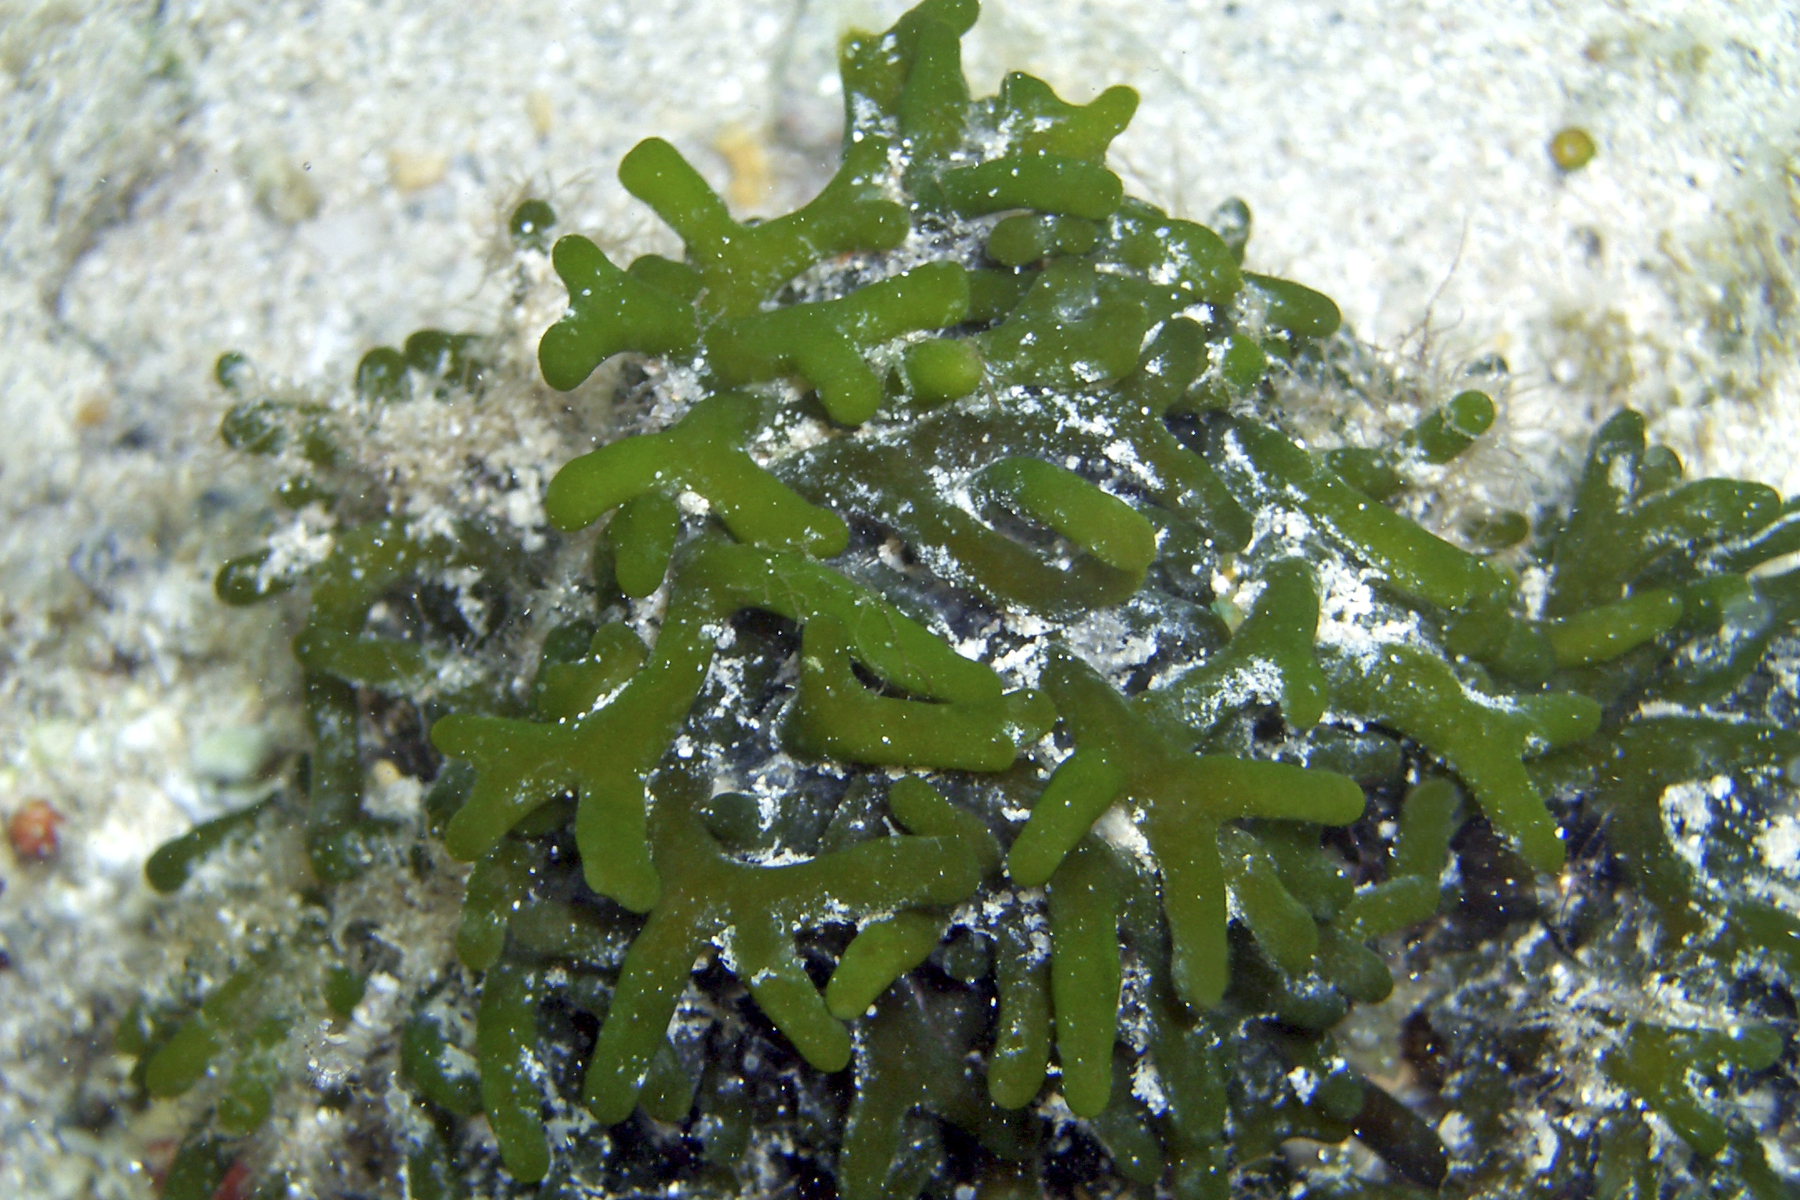
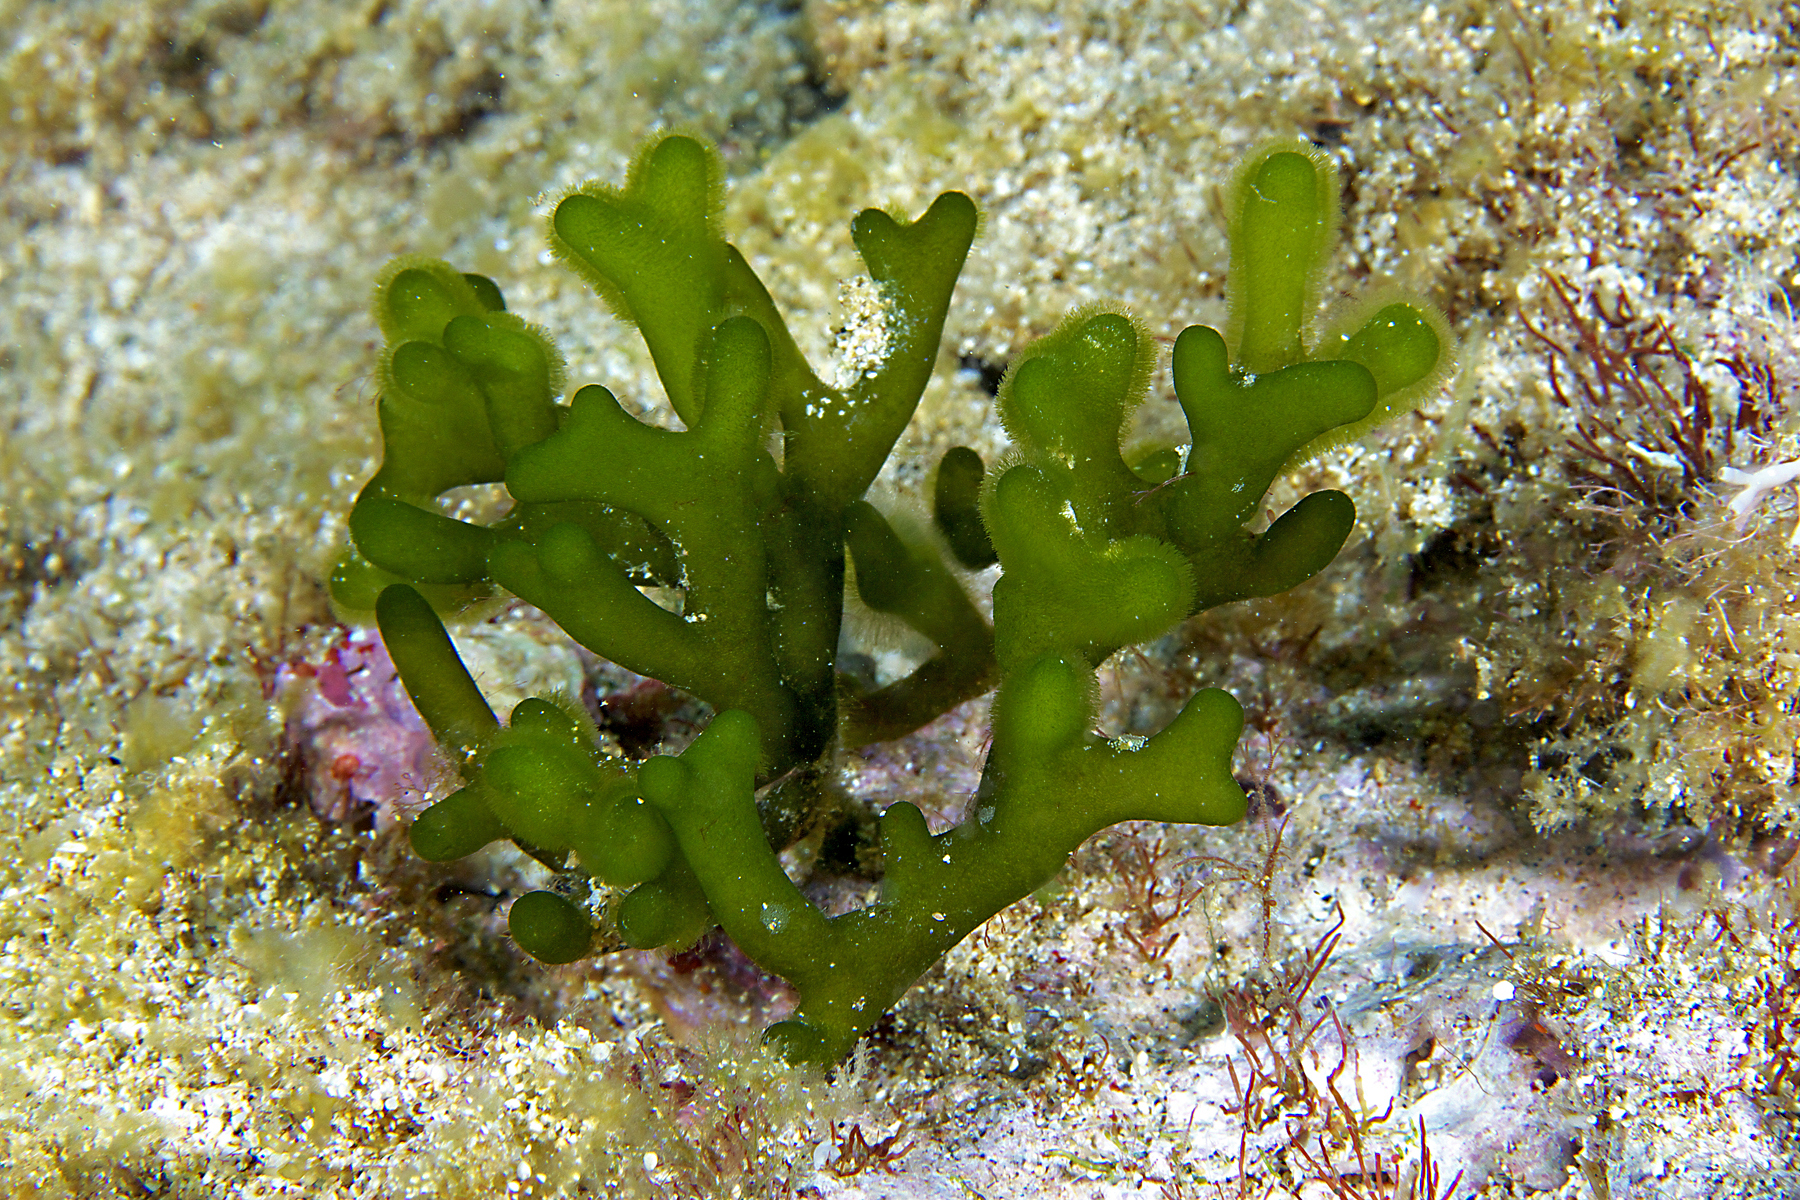
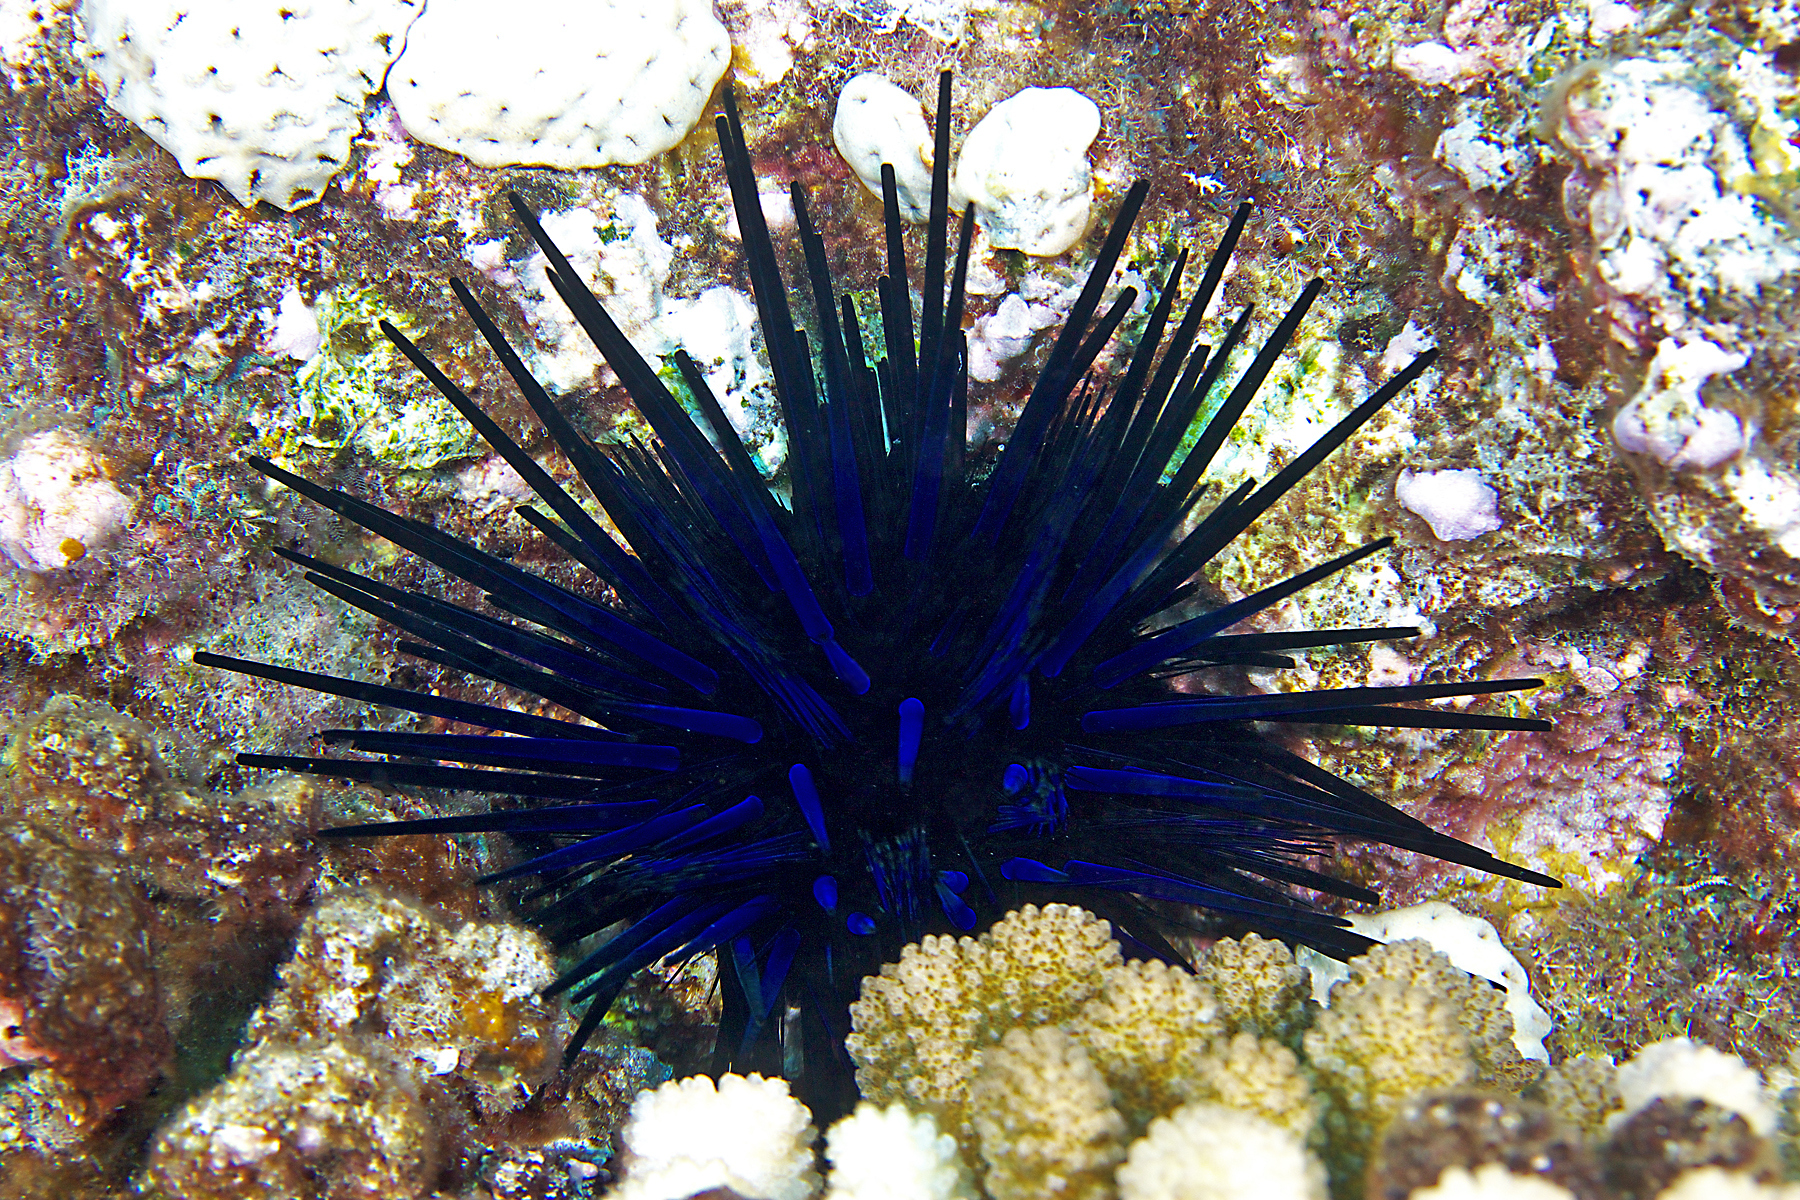
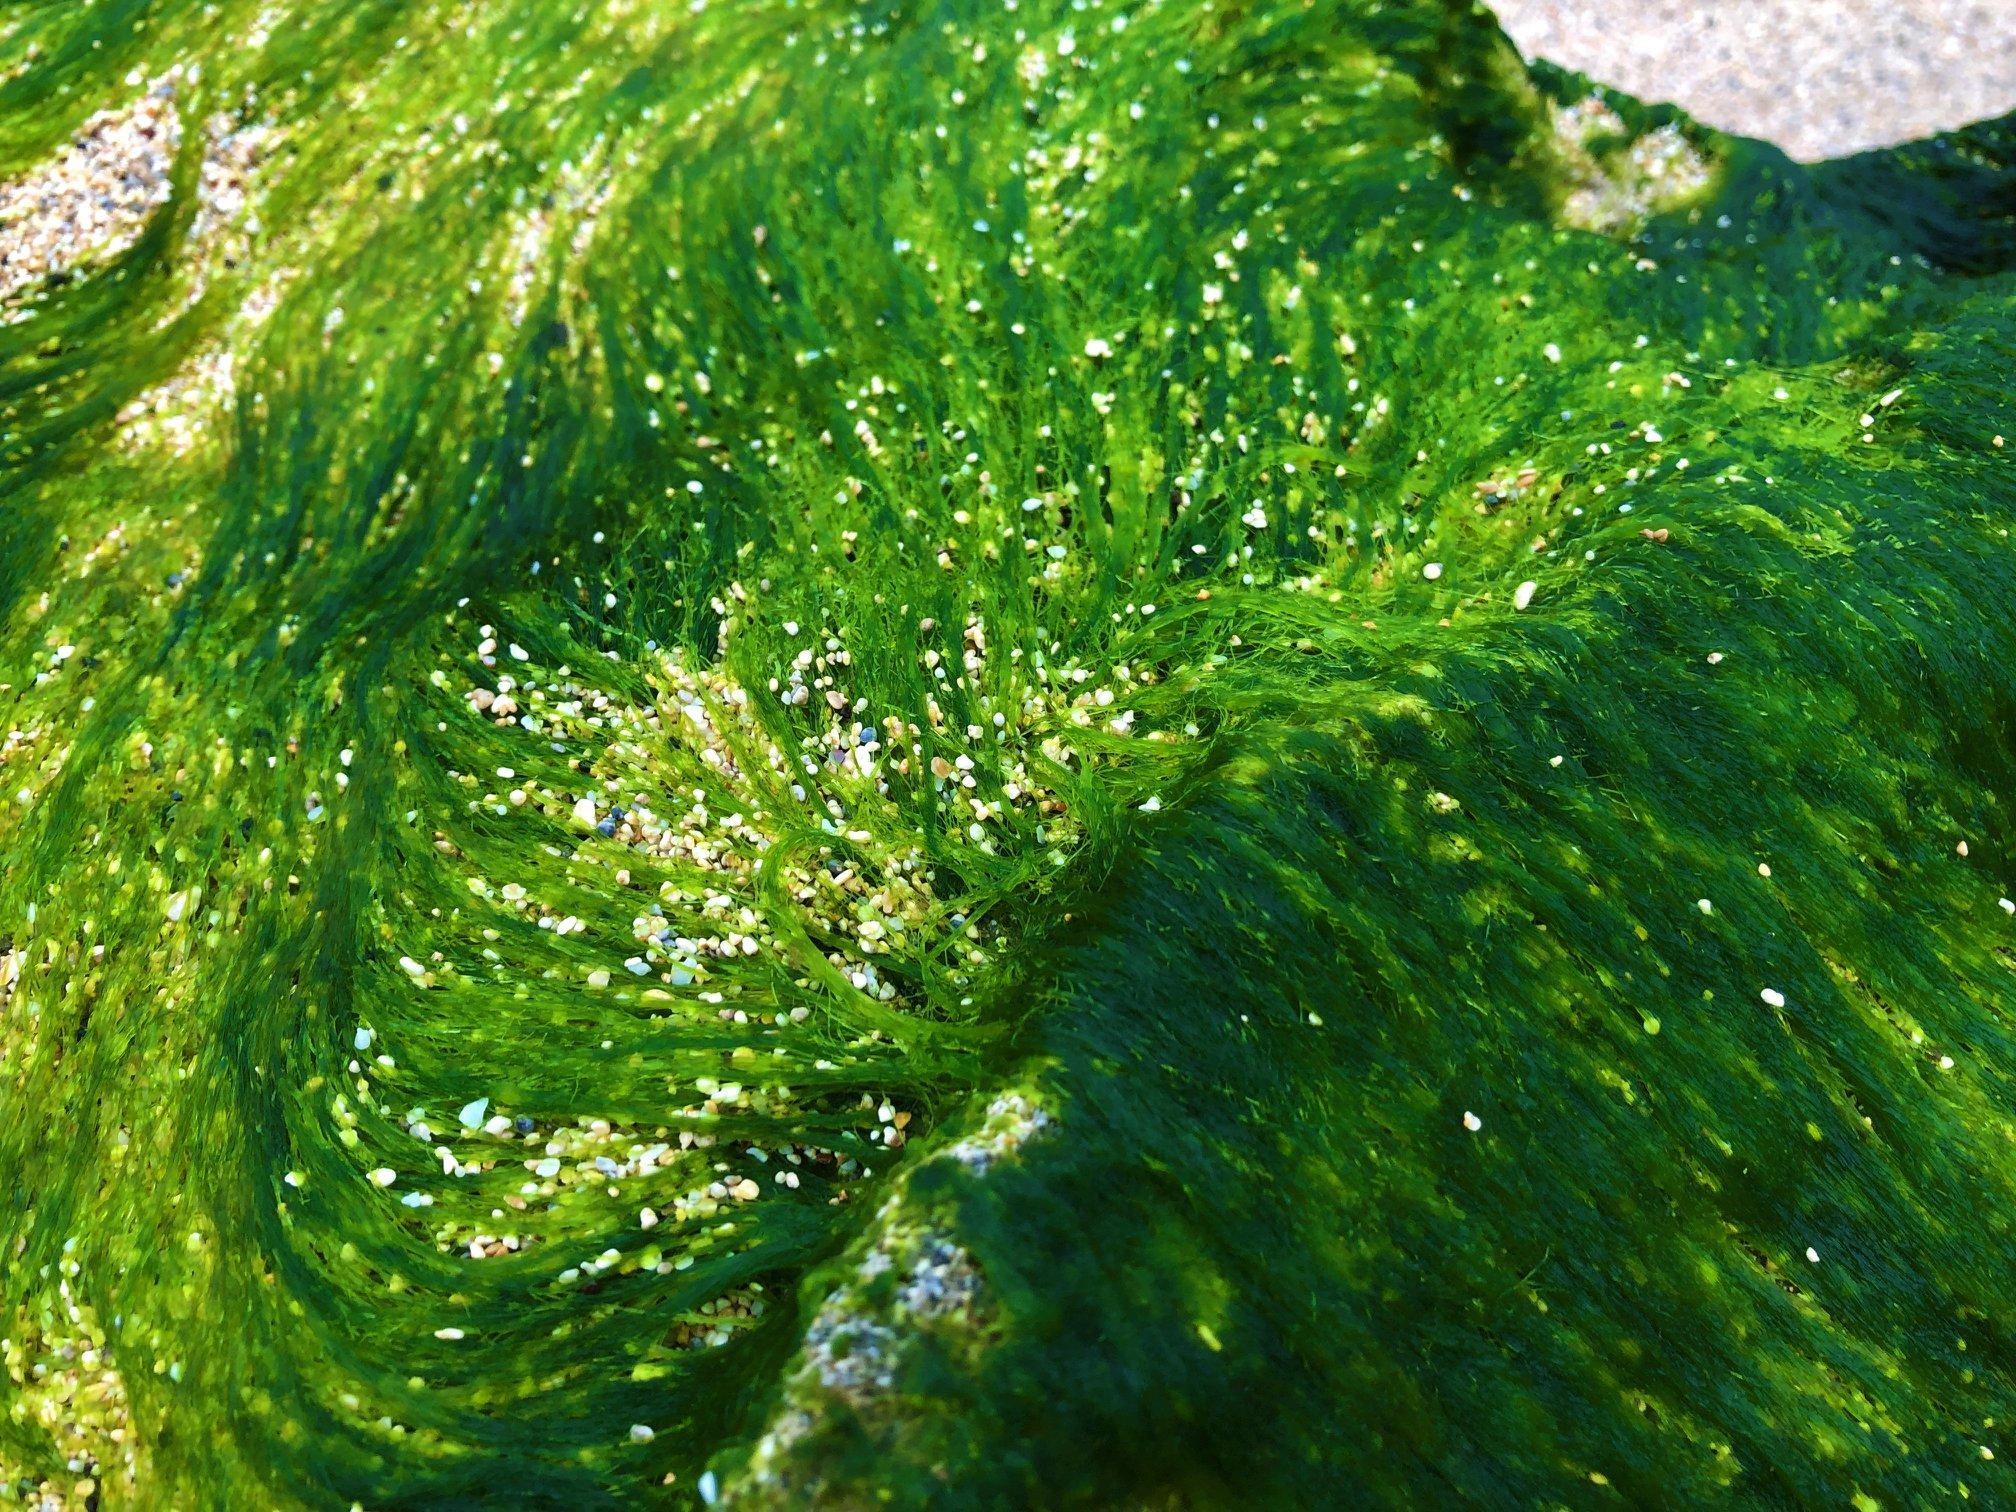
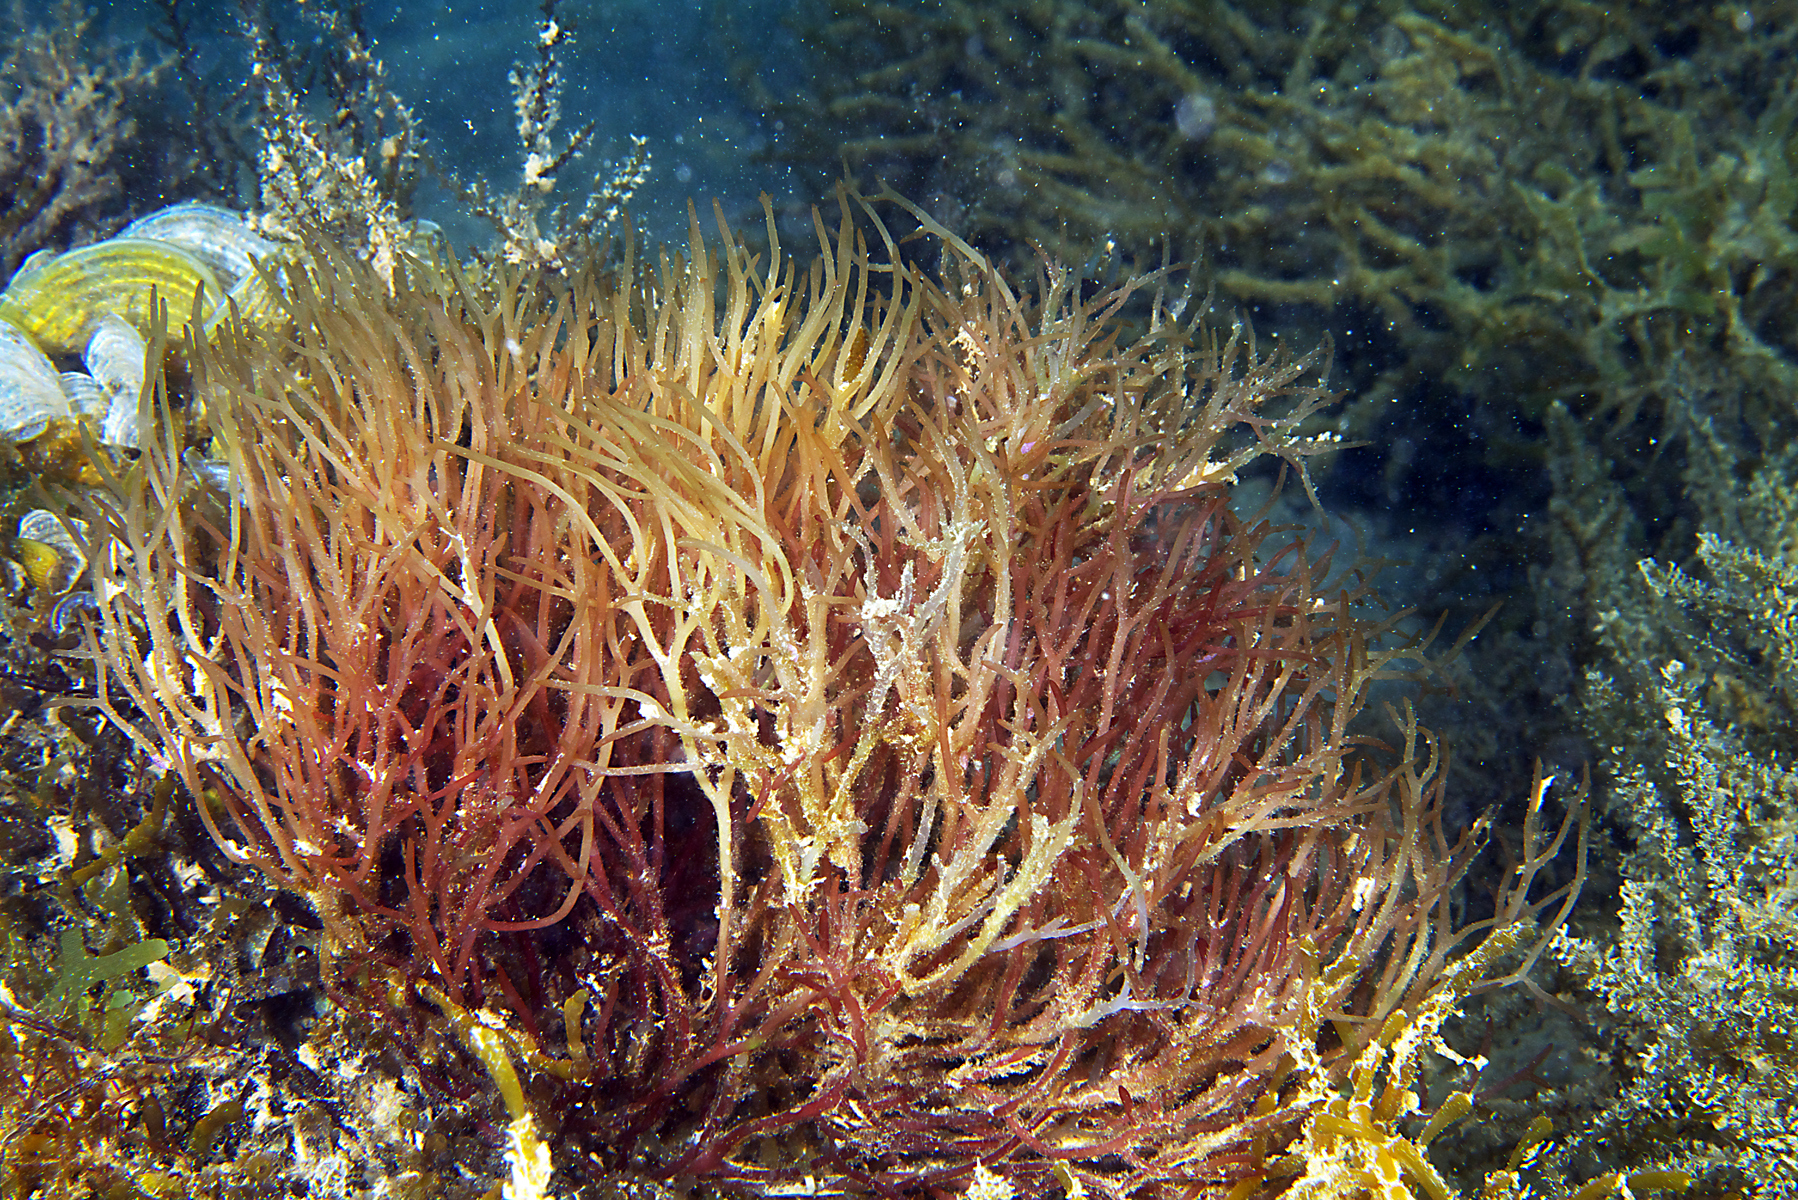
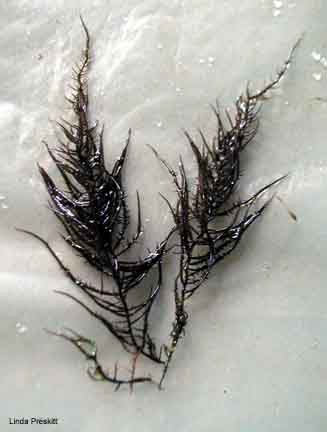
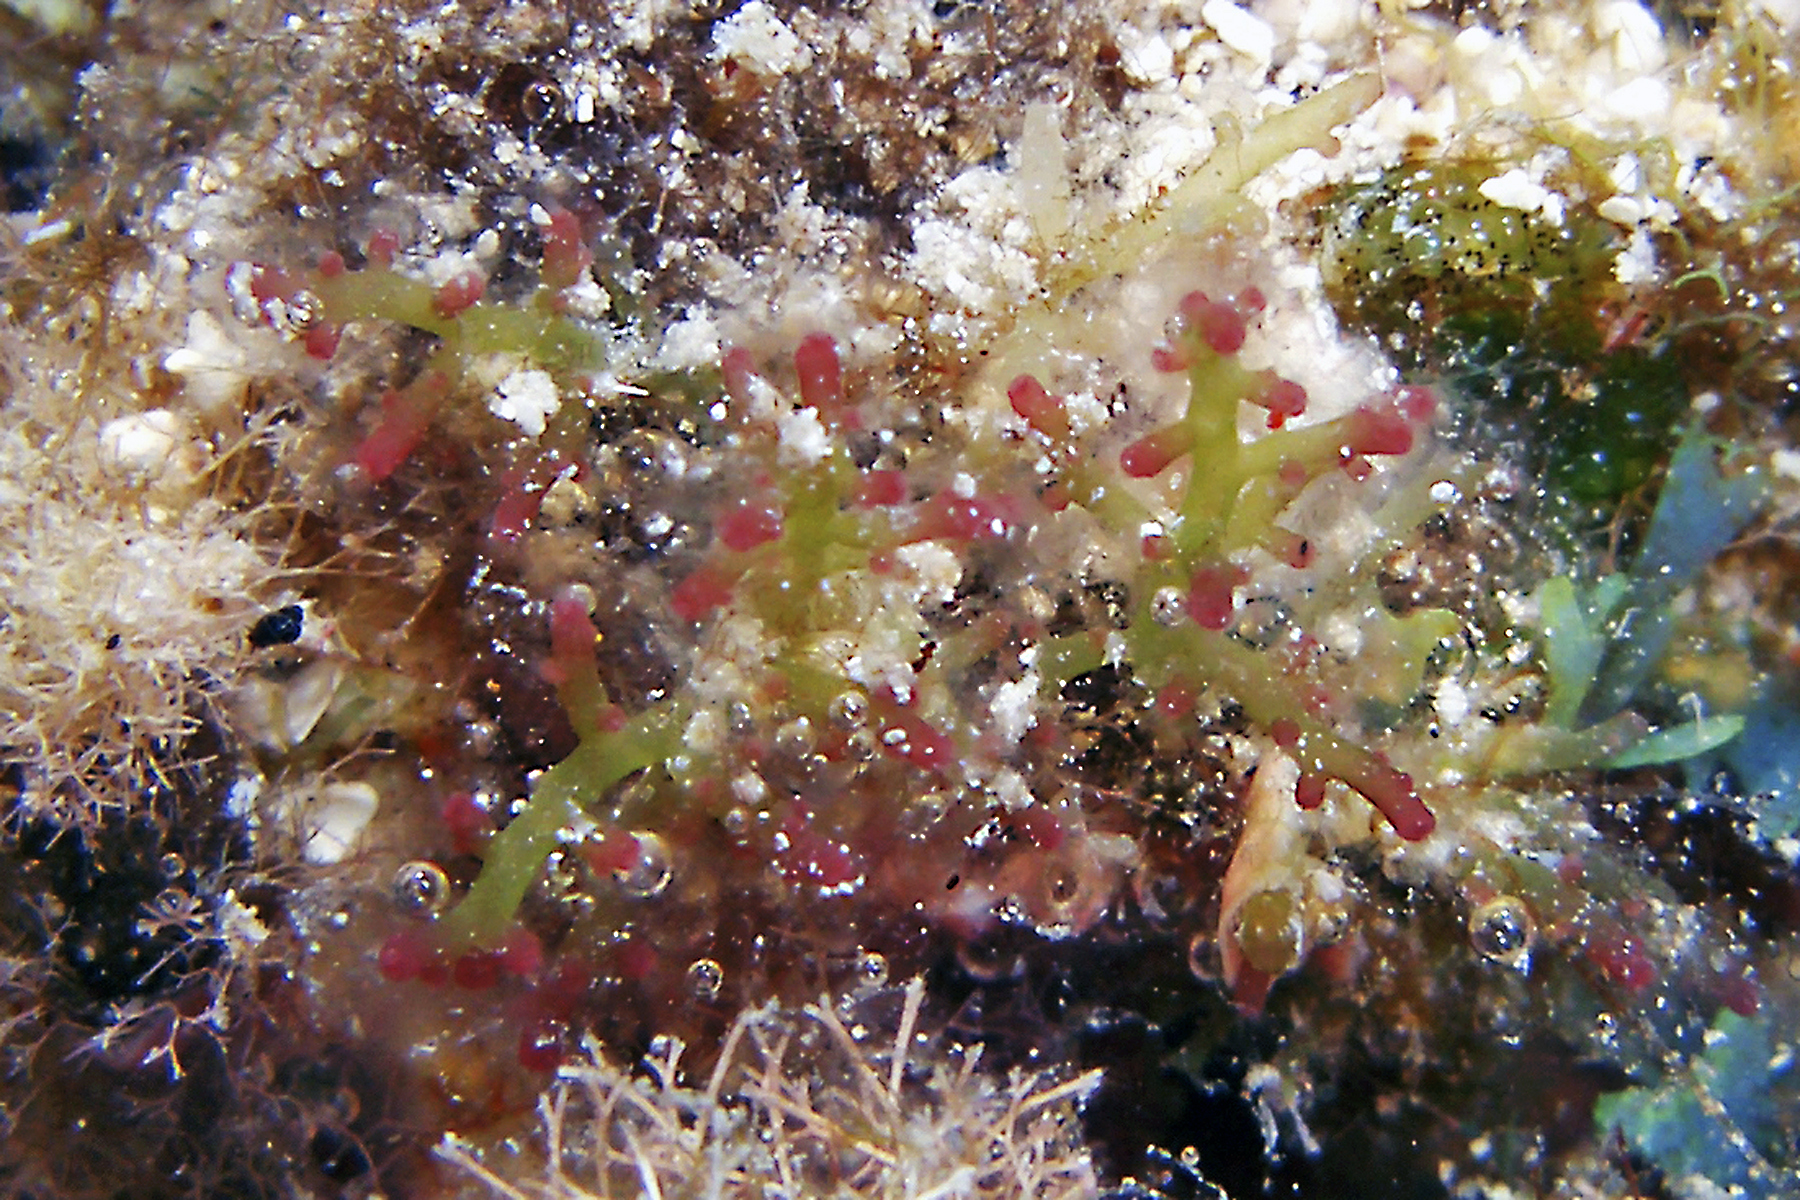
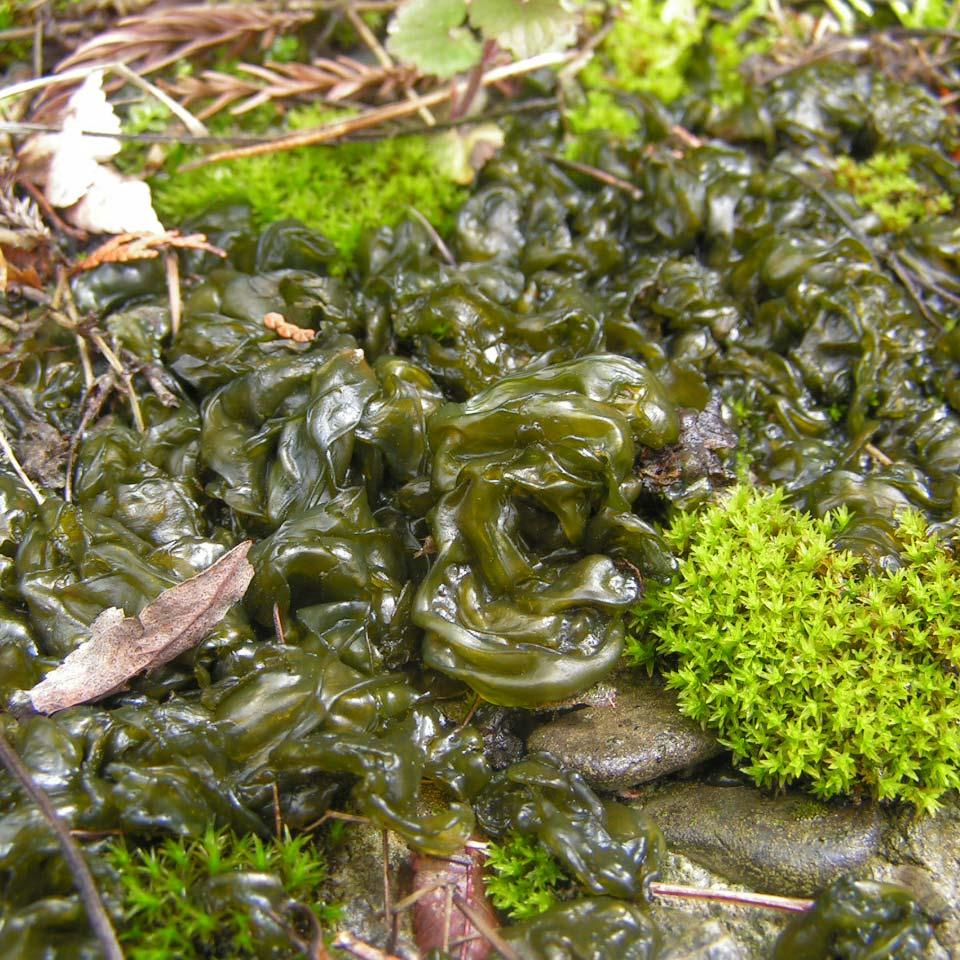
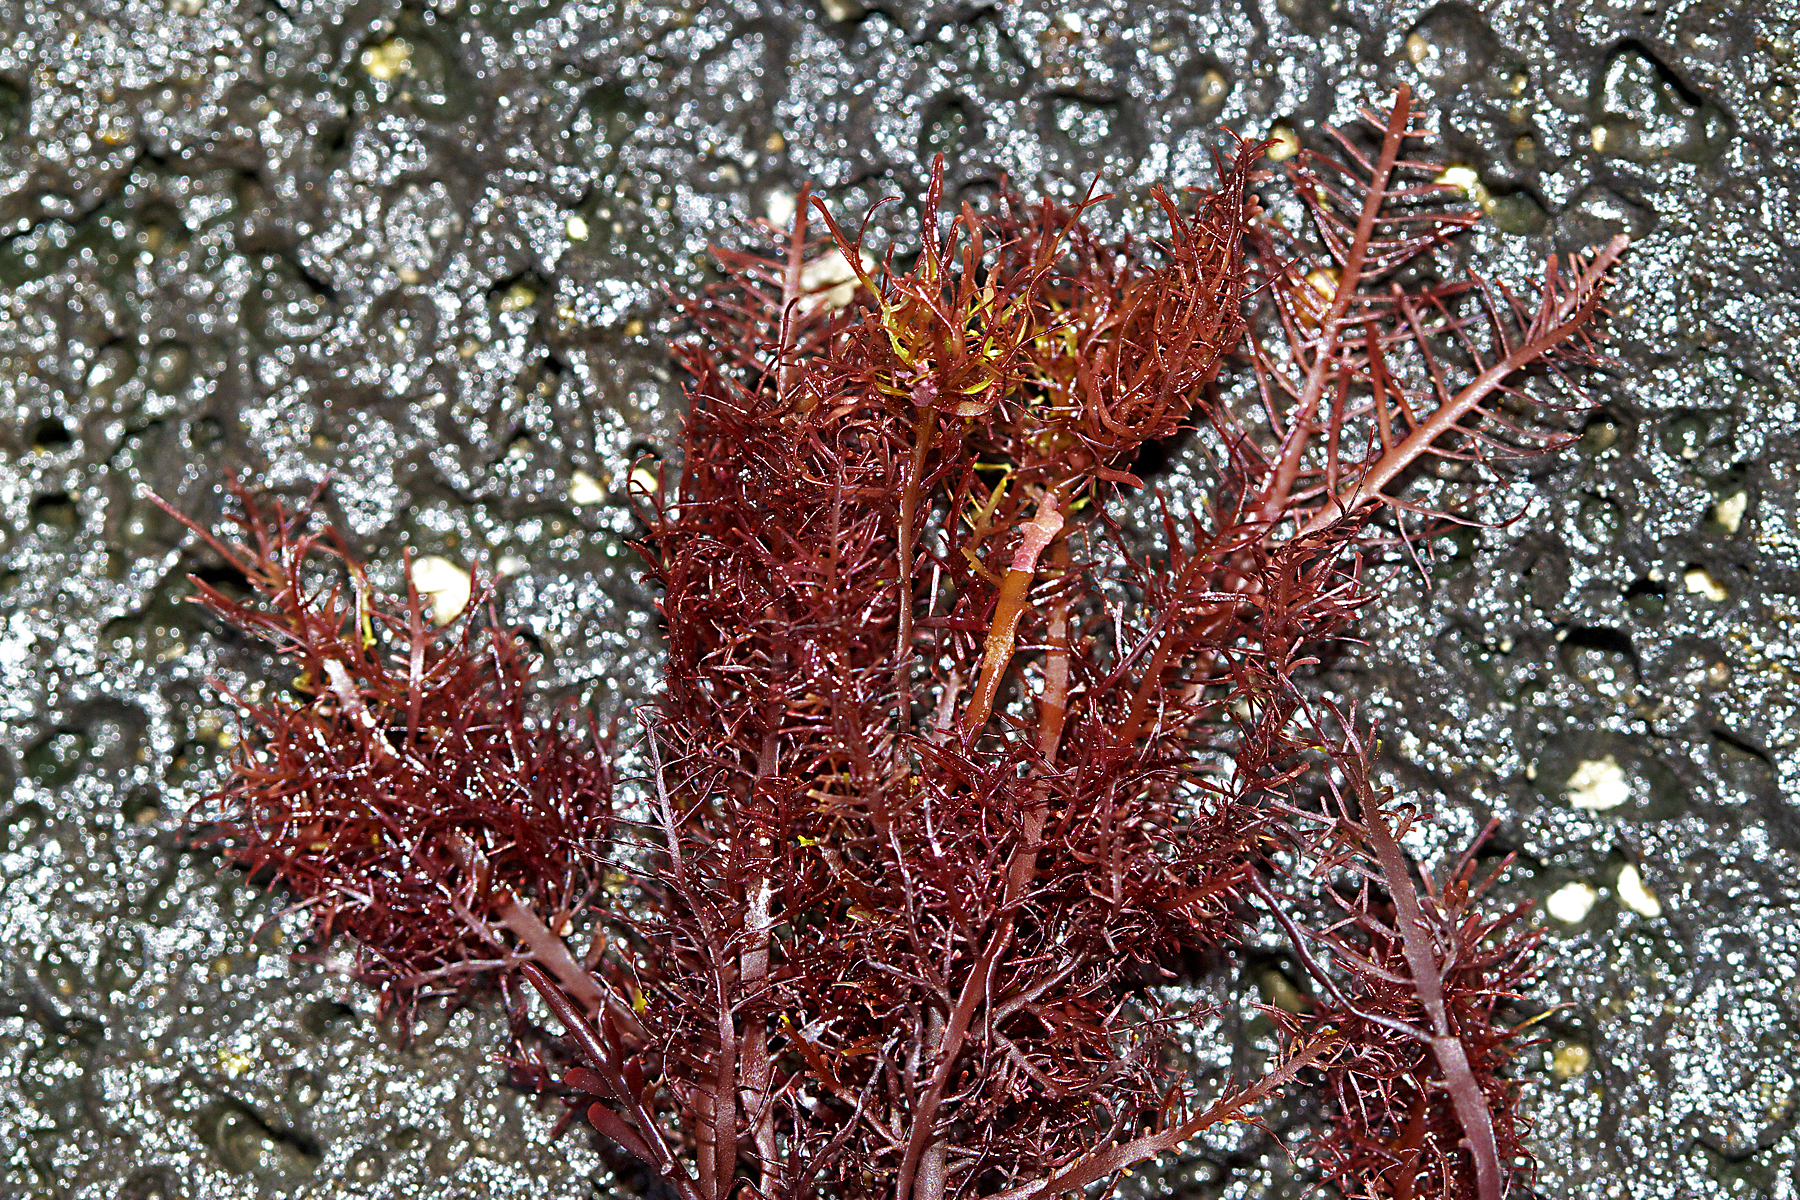
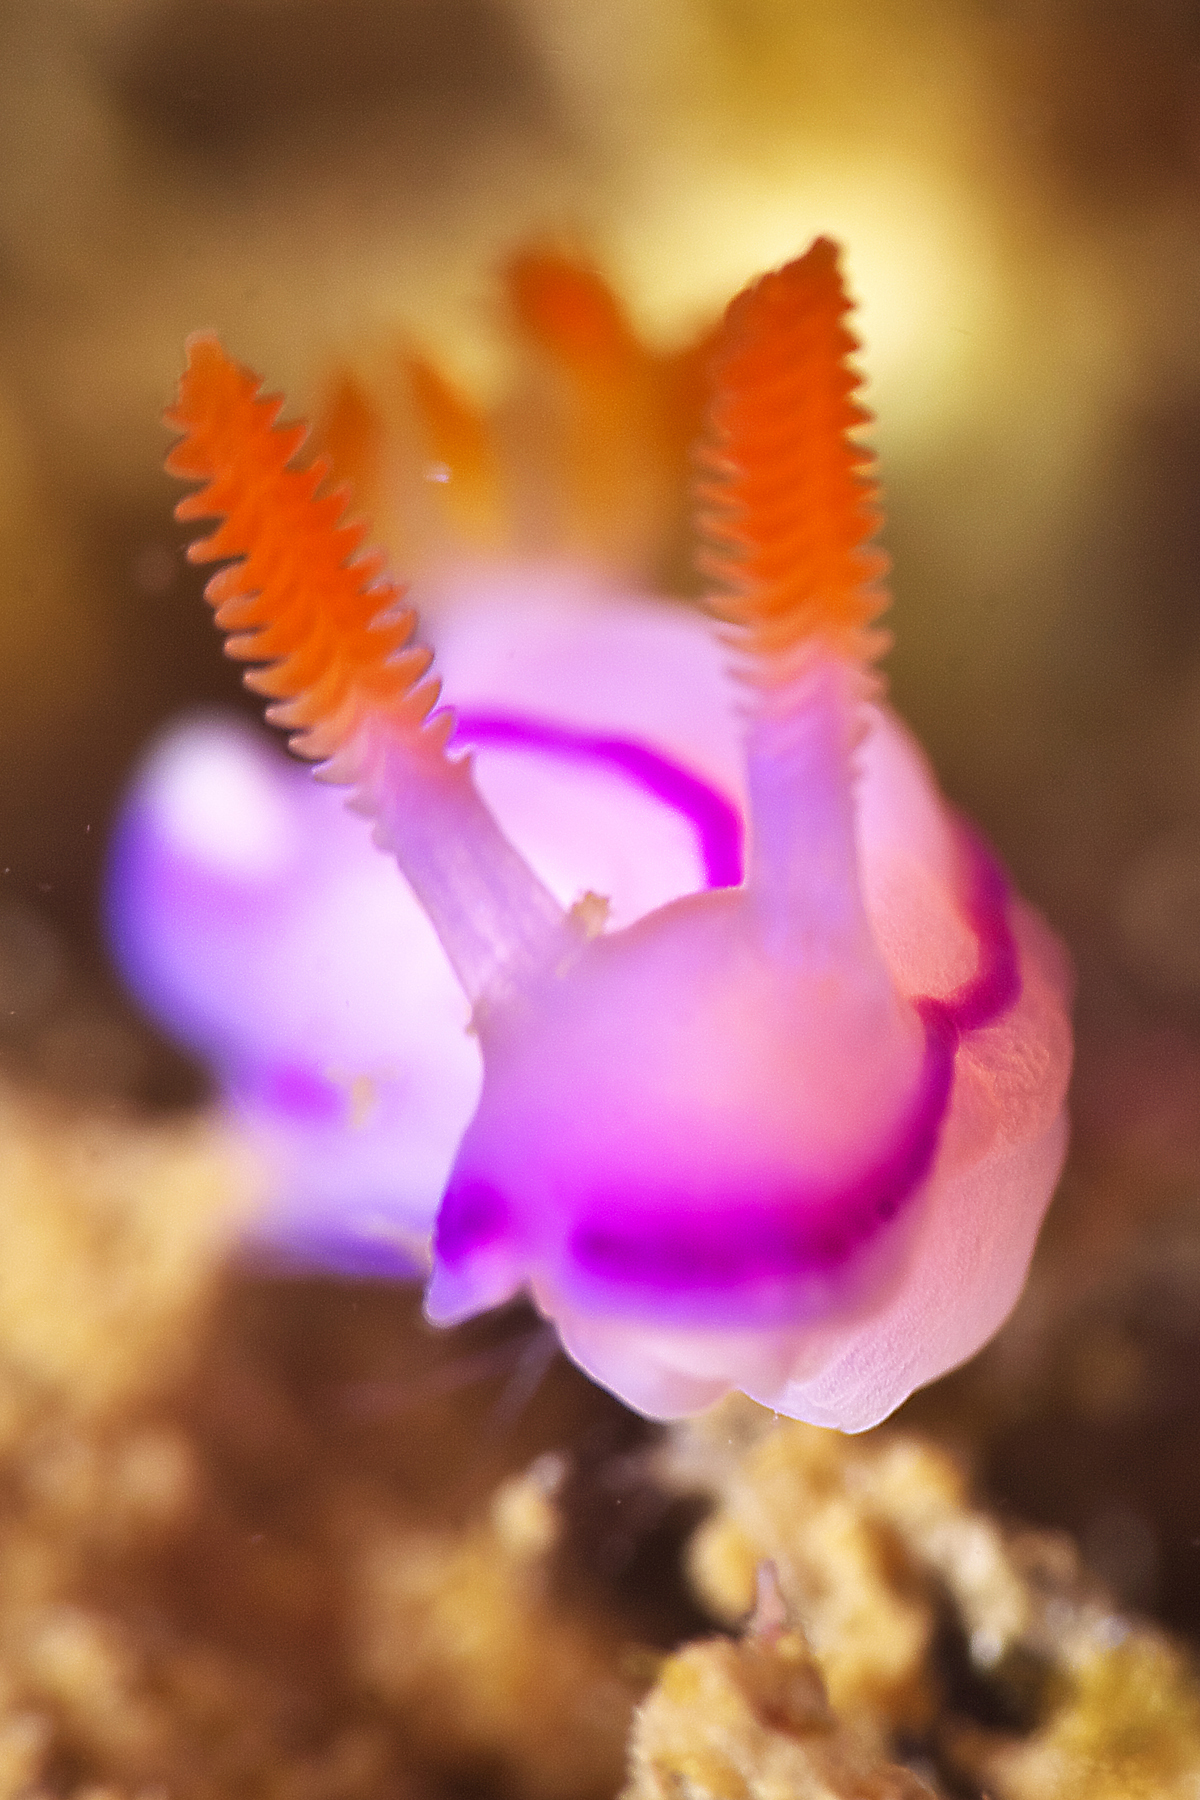
WASTEWATER CONTAINS NUTRIENT POLLUTION THAT CHANGES MARINE LIMU
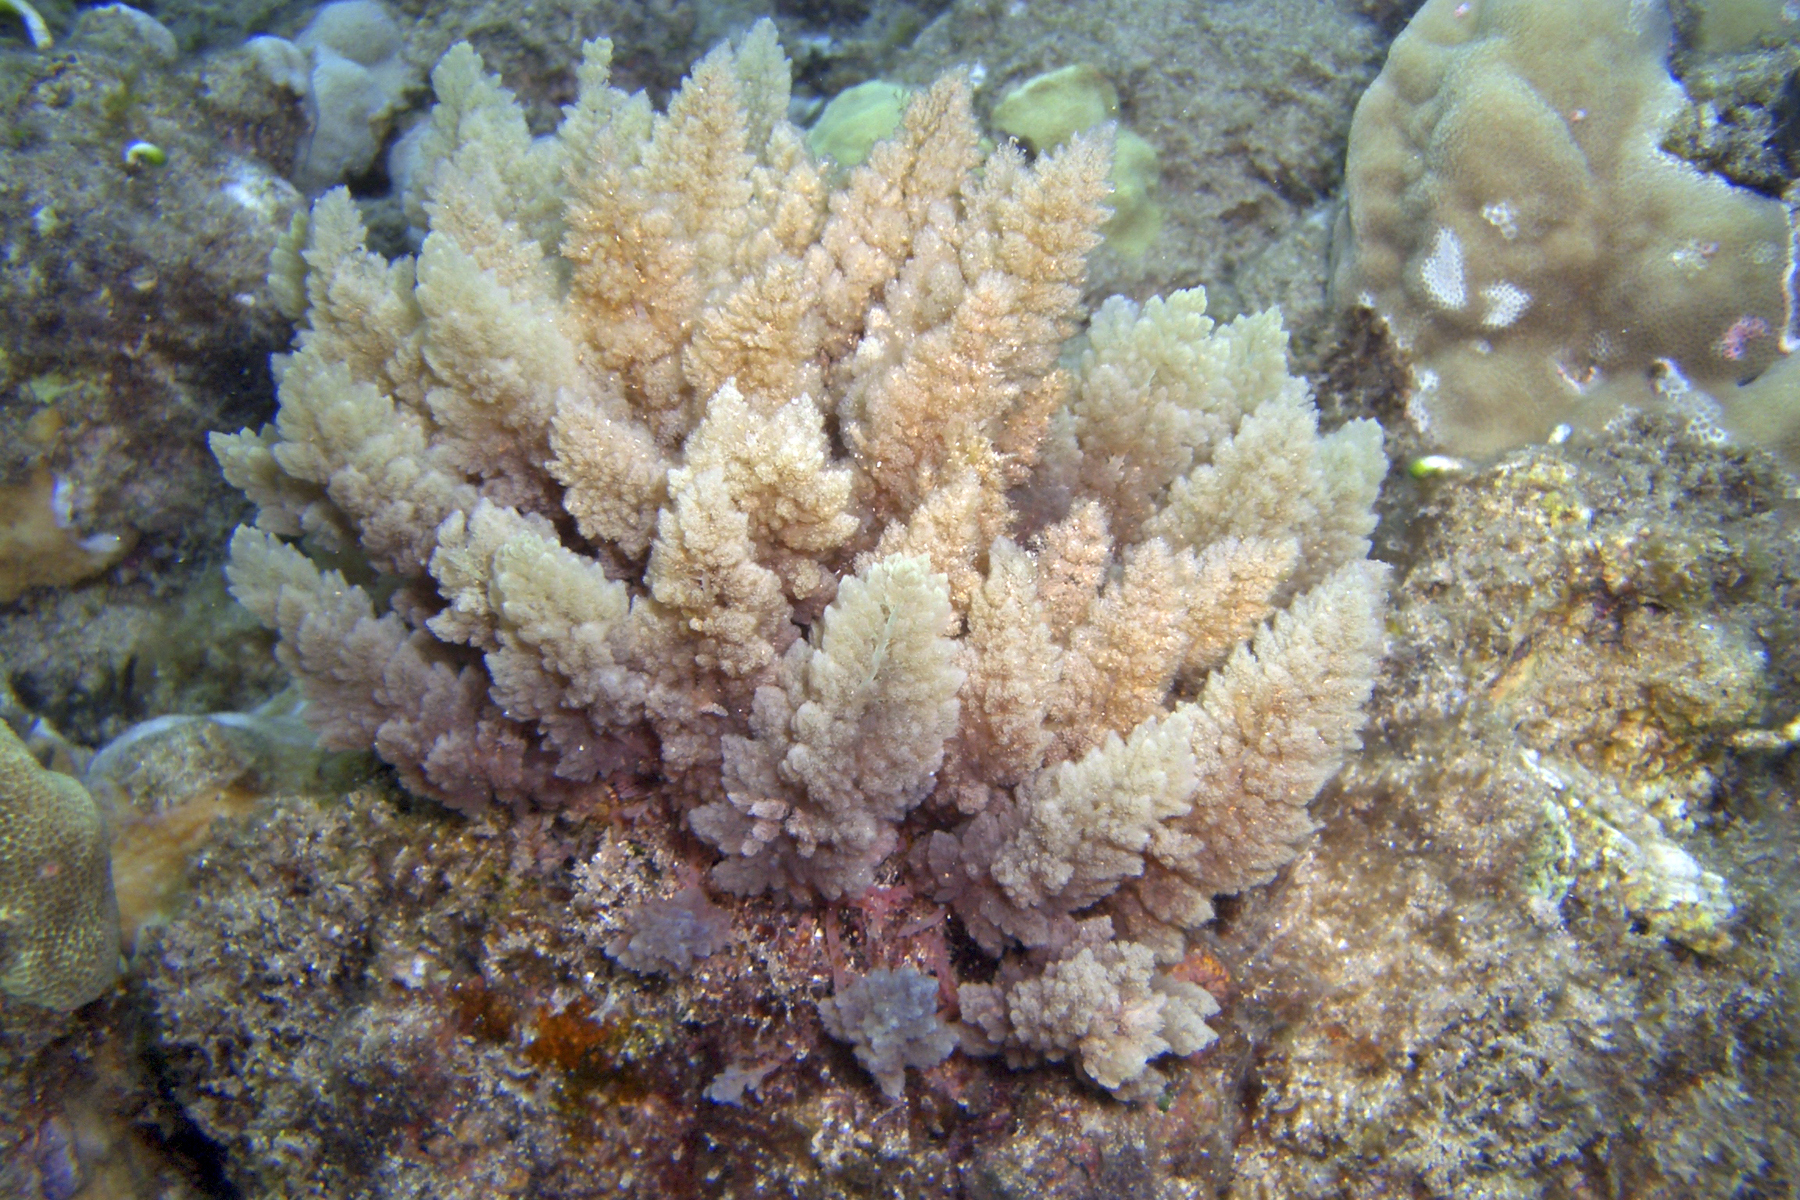
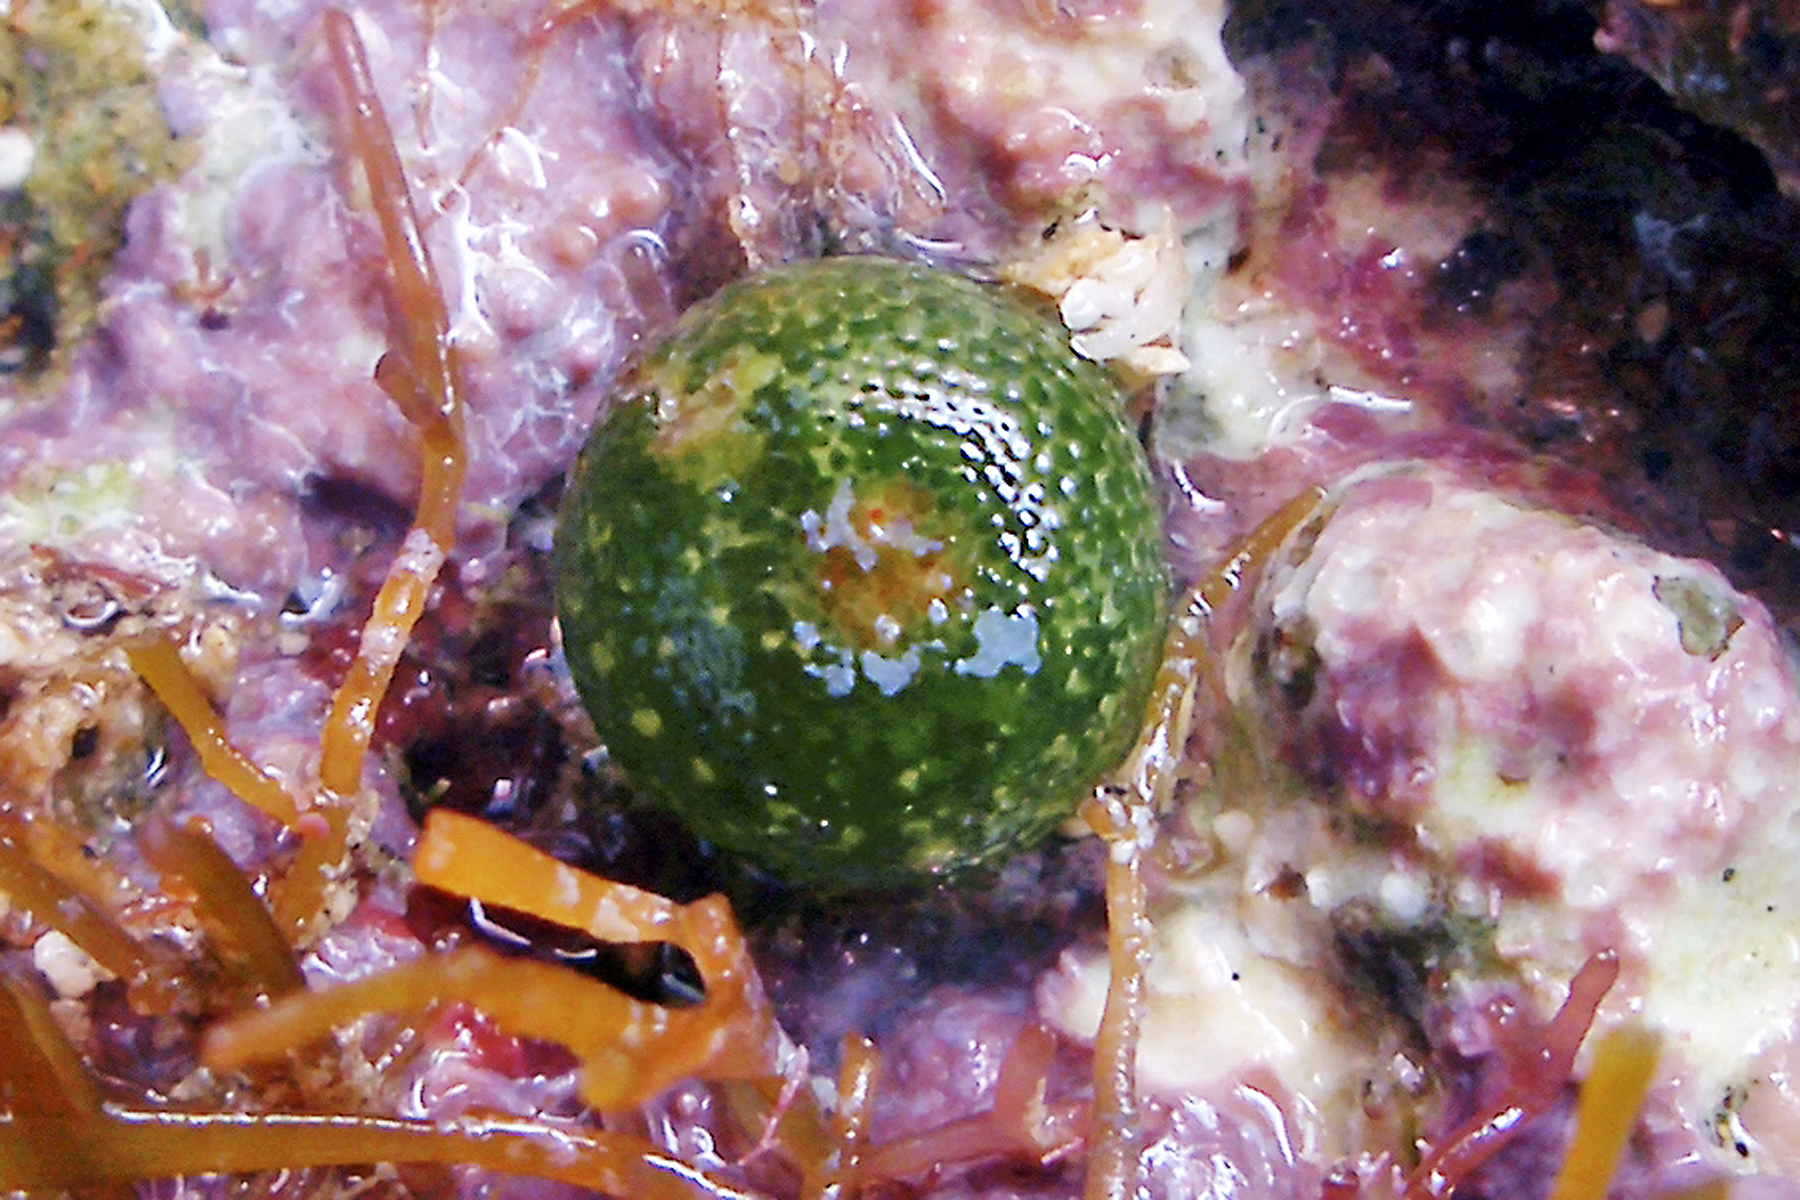
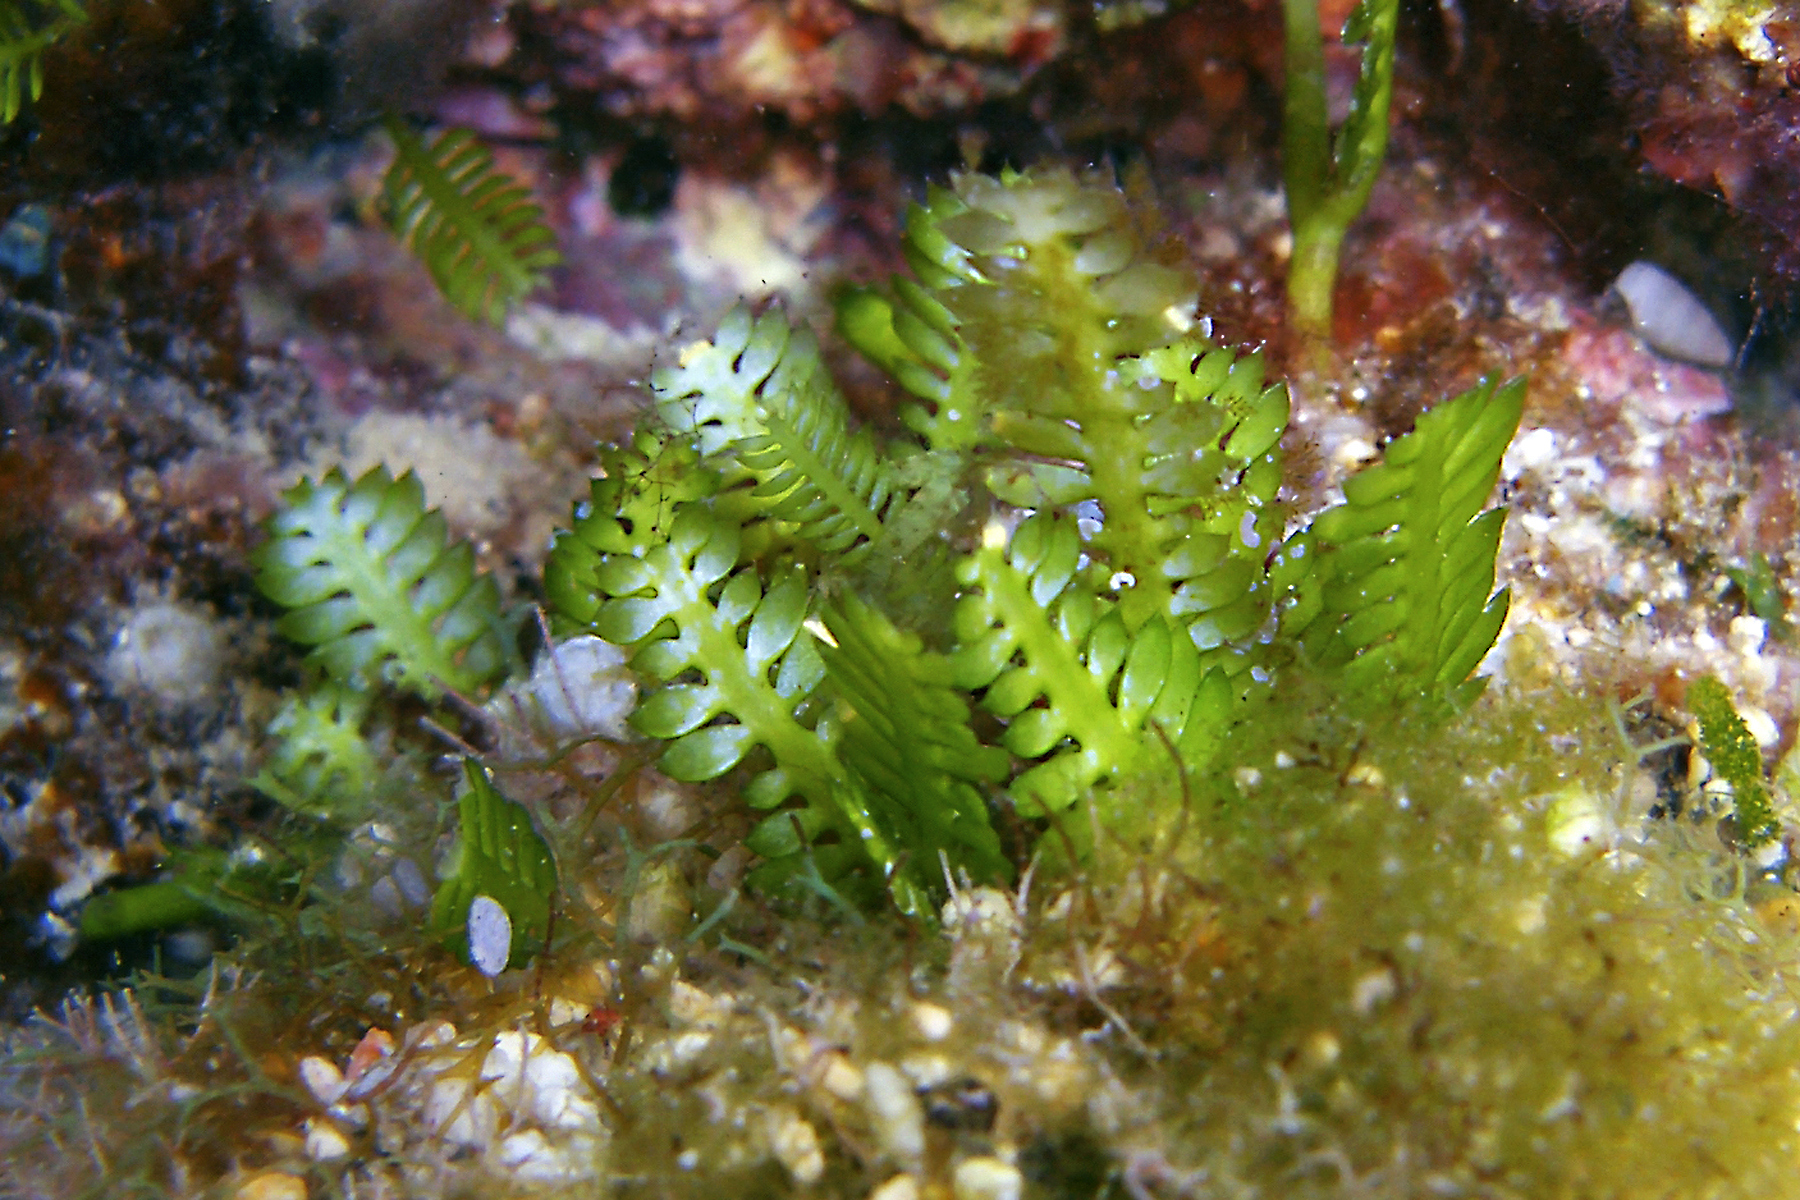
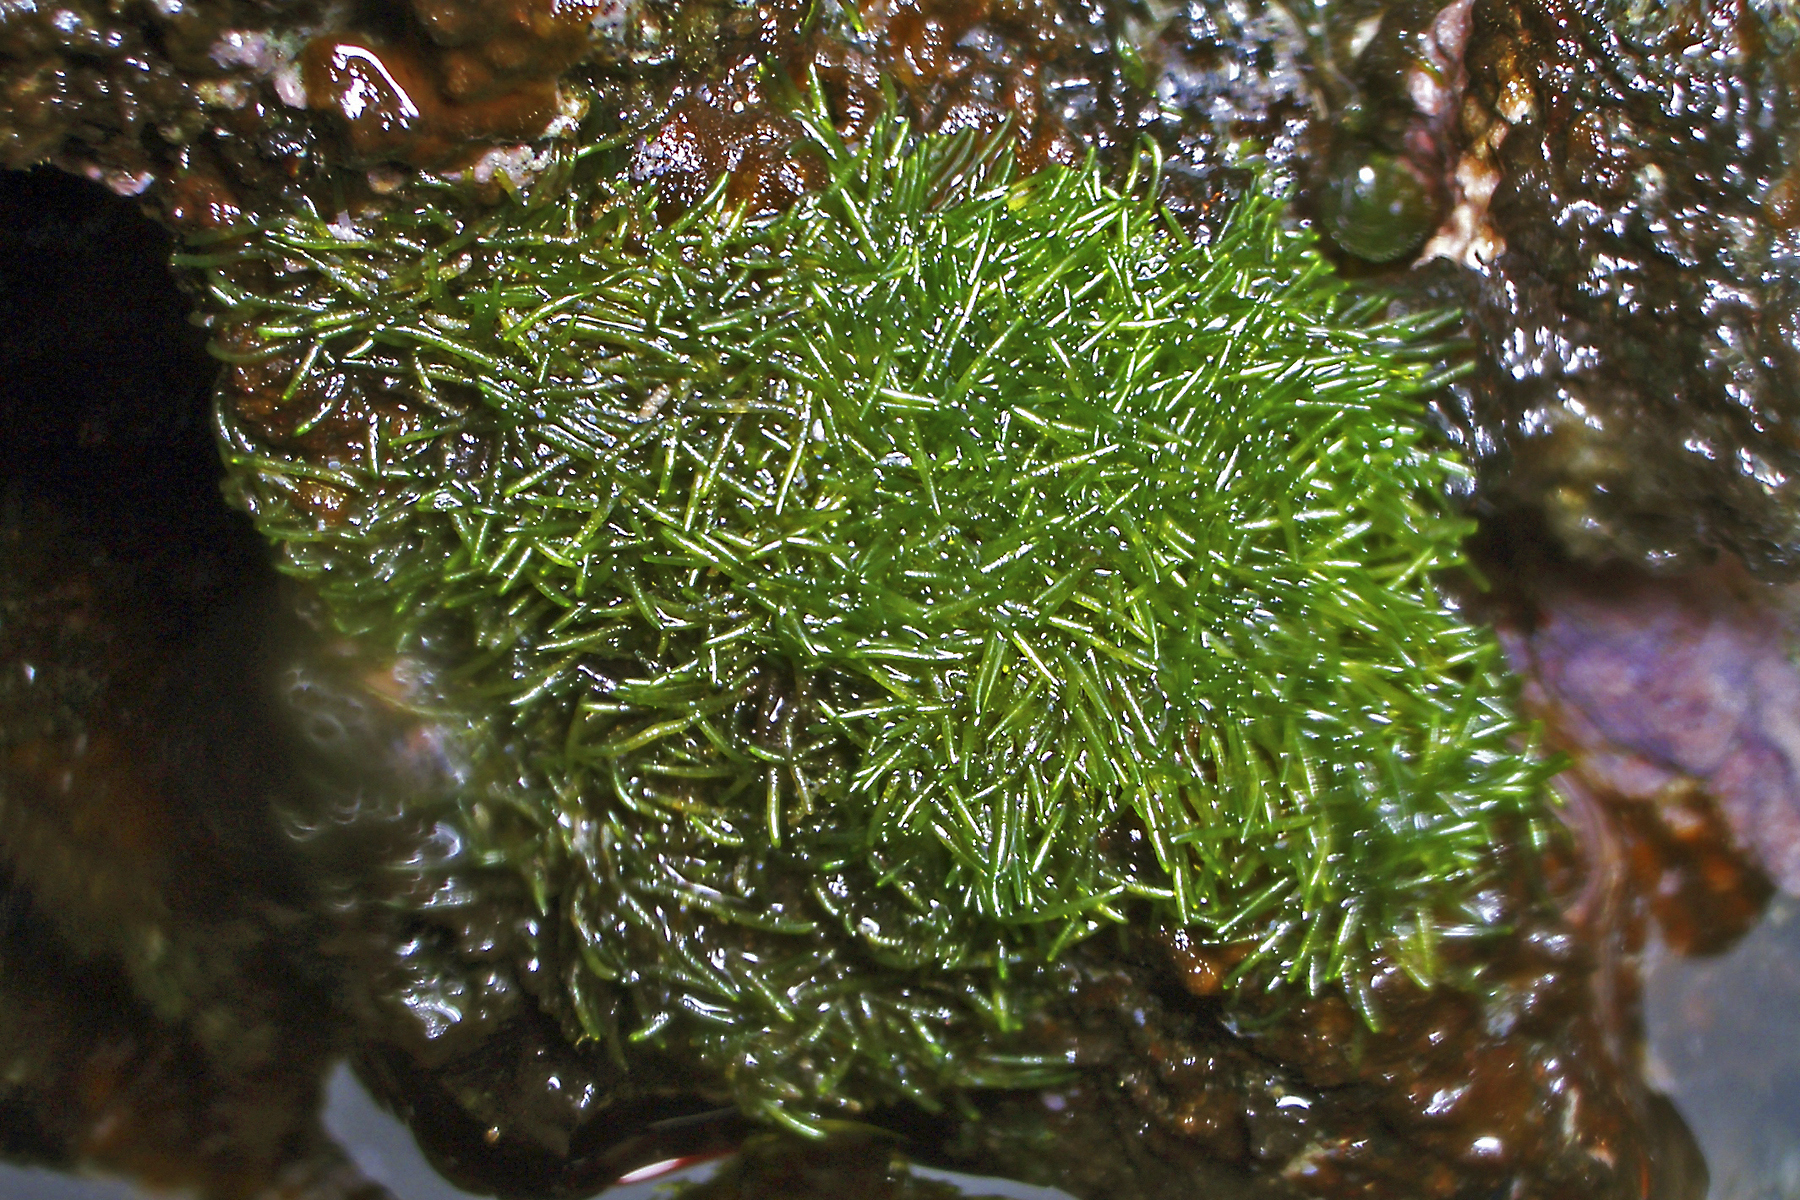
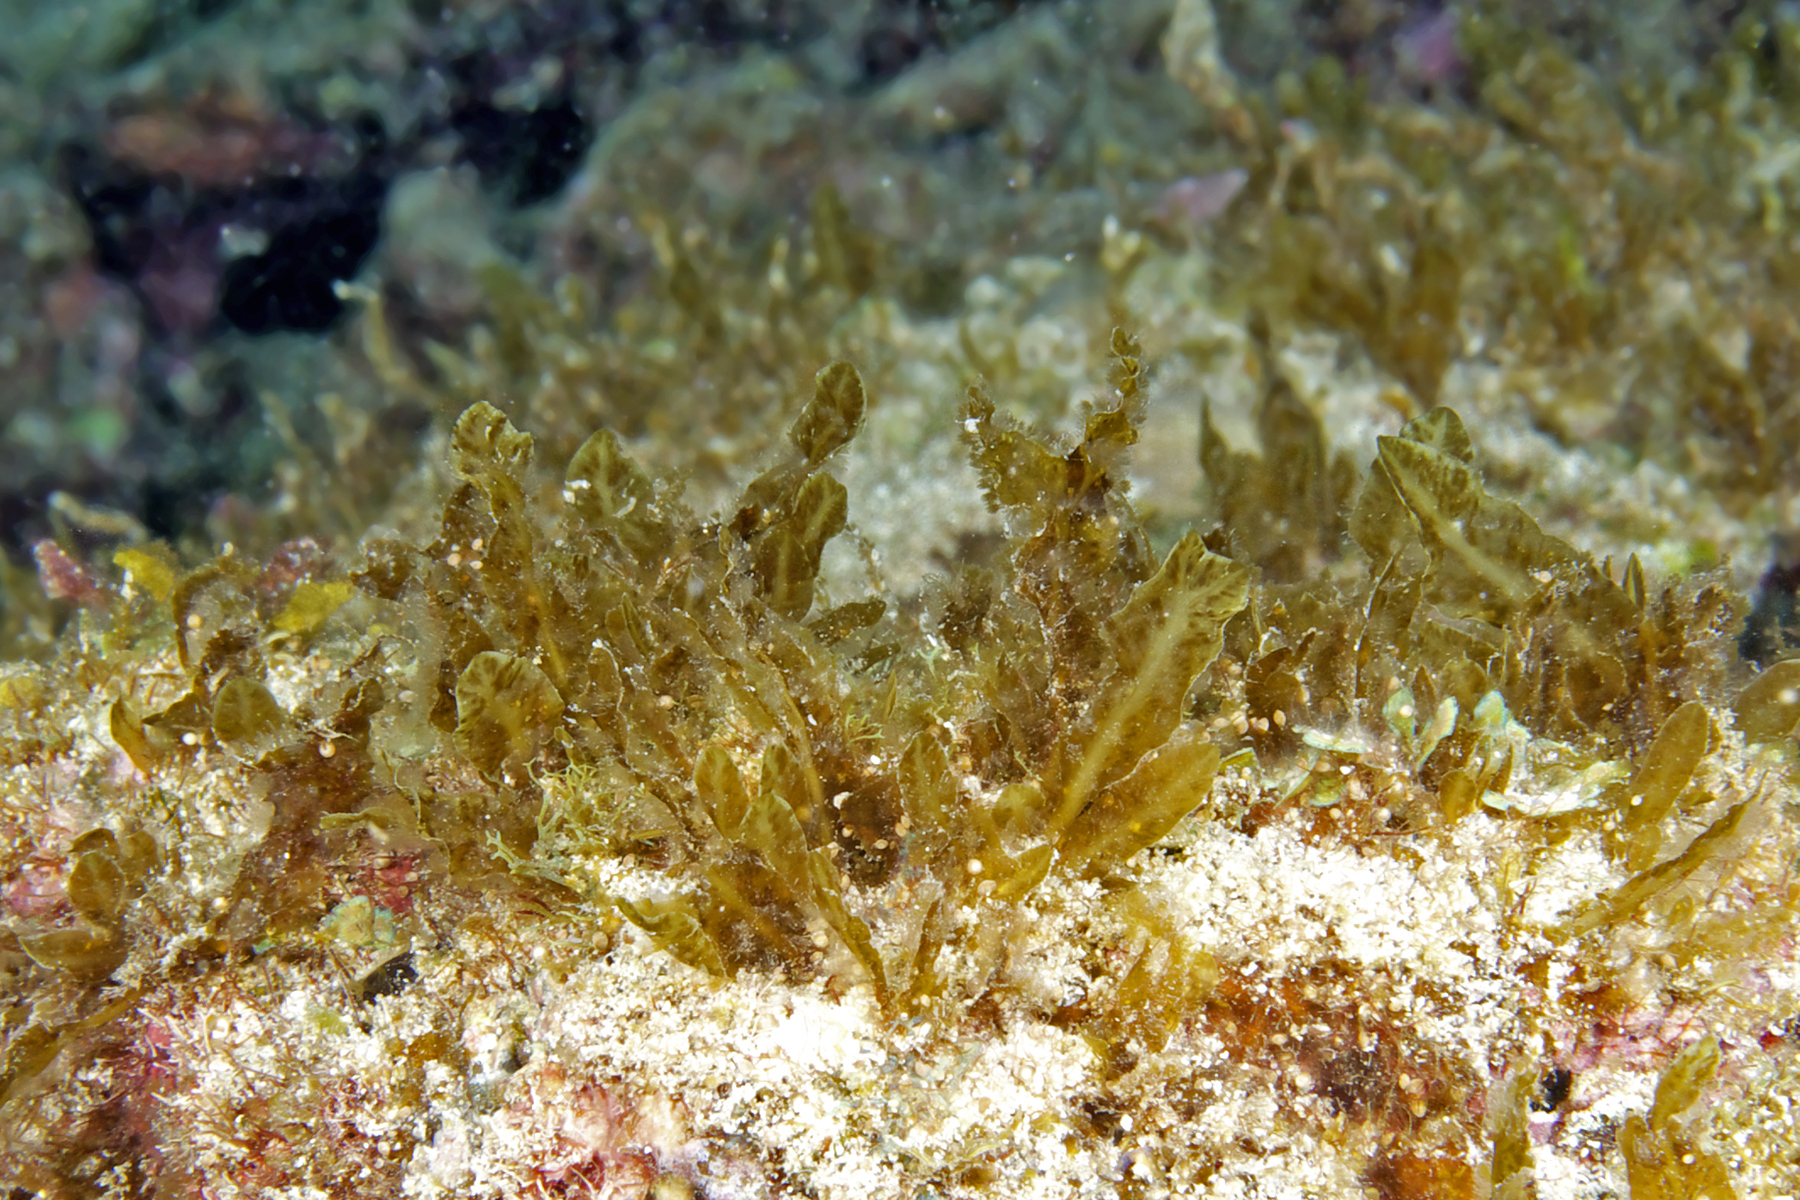
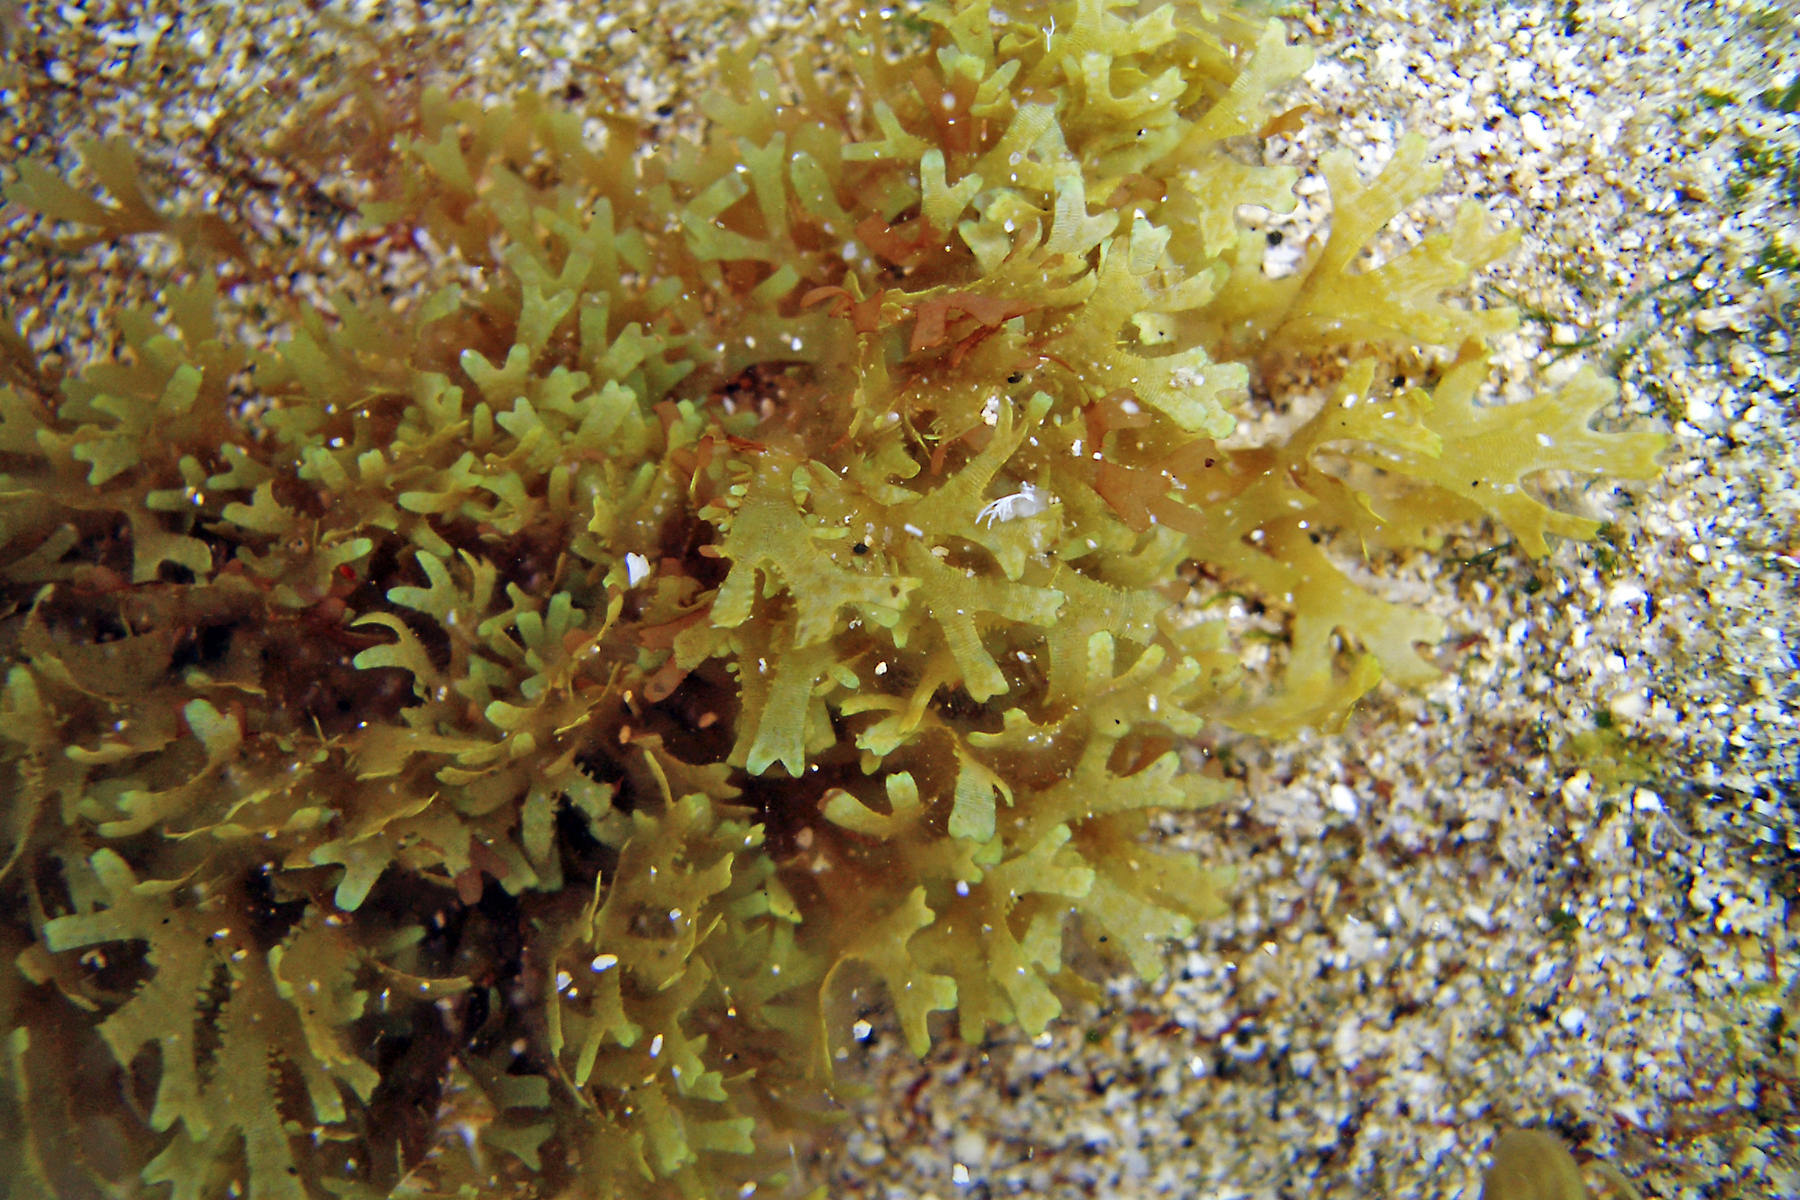
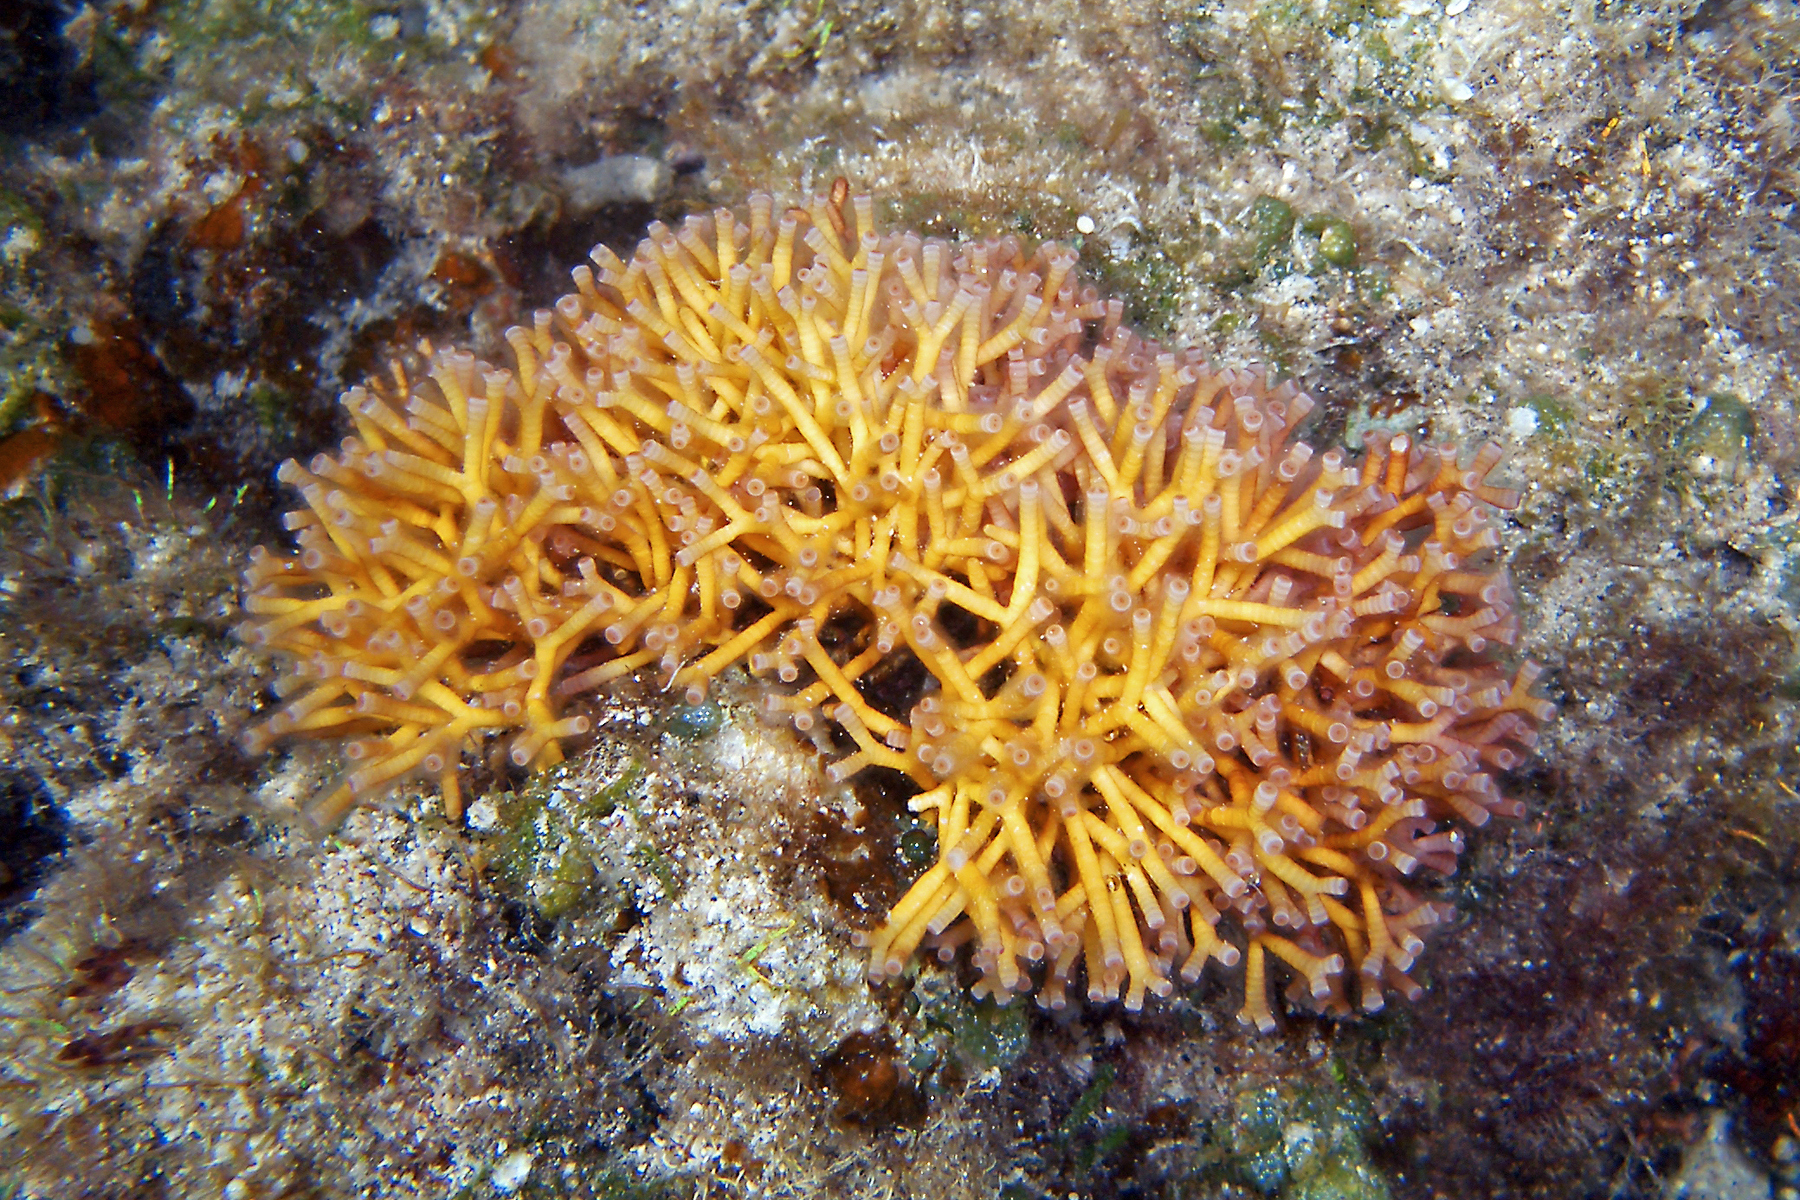
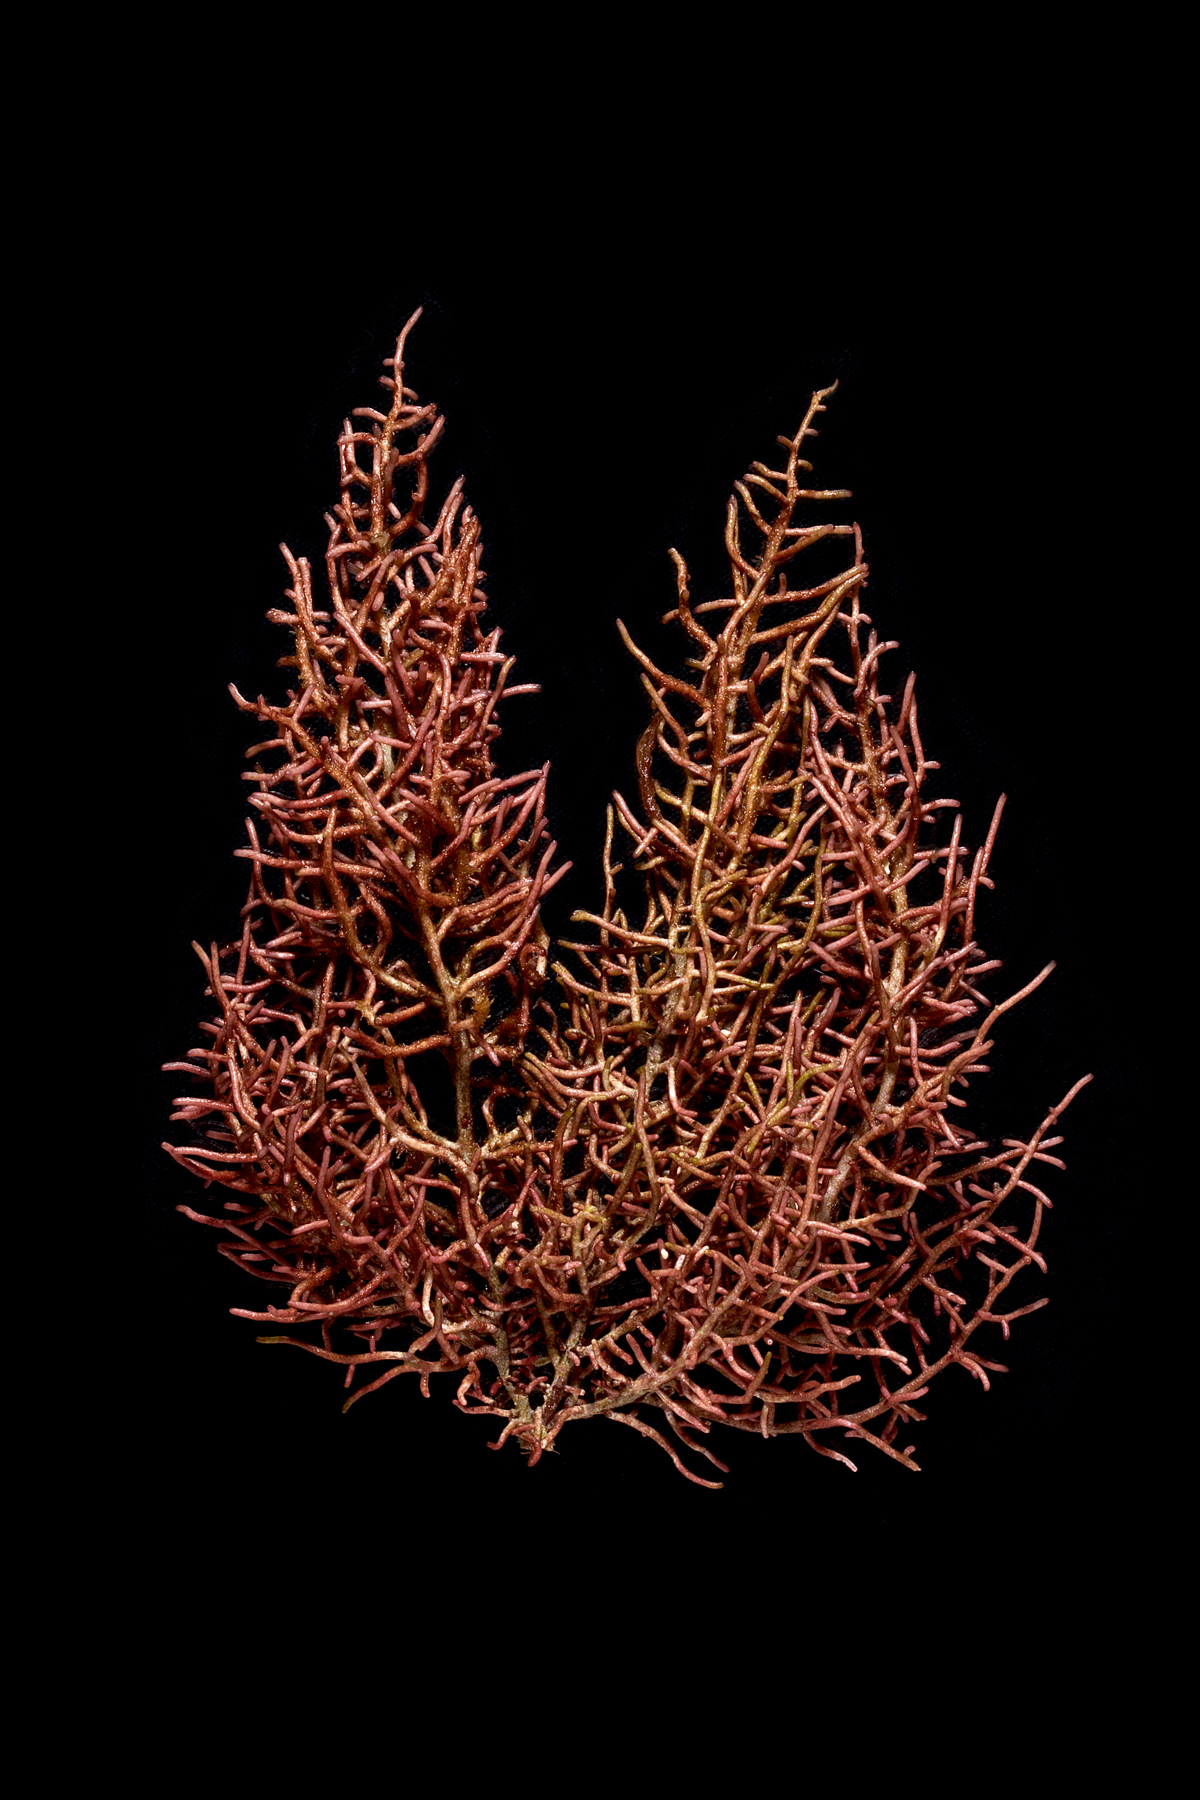
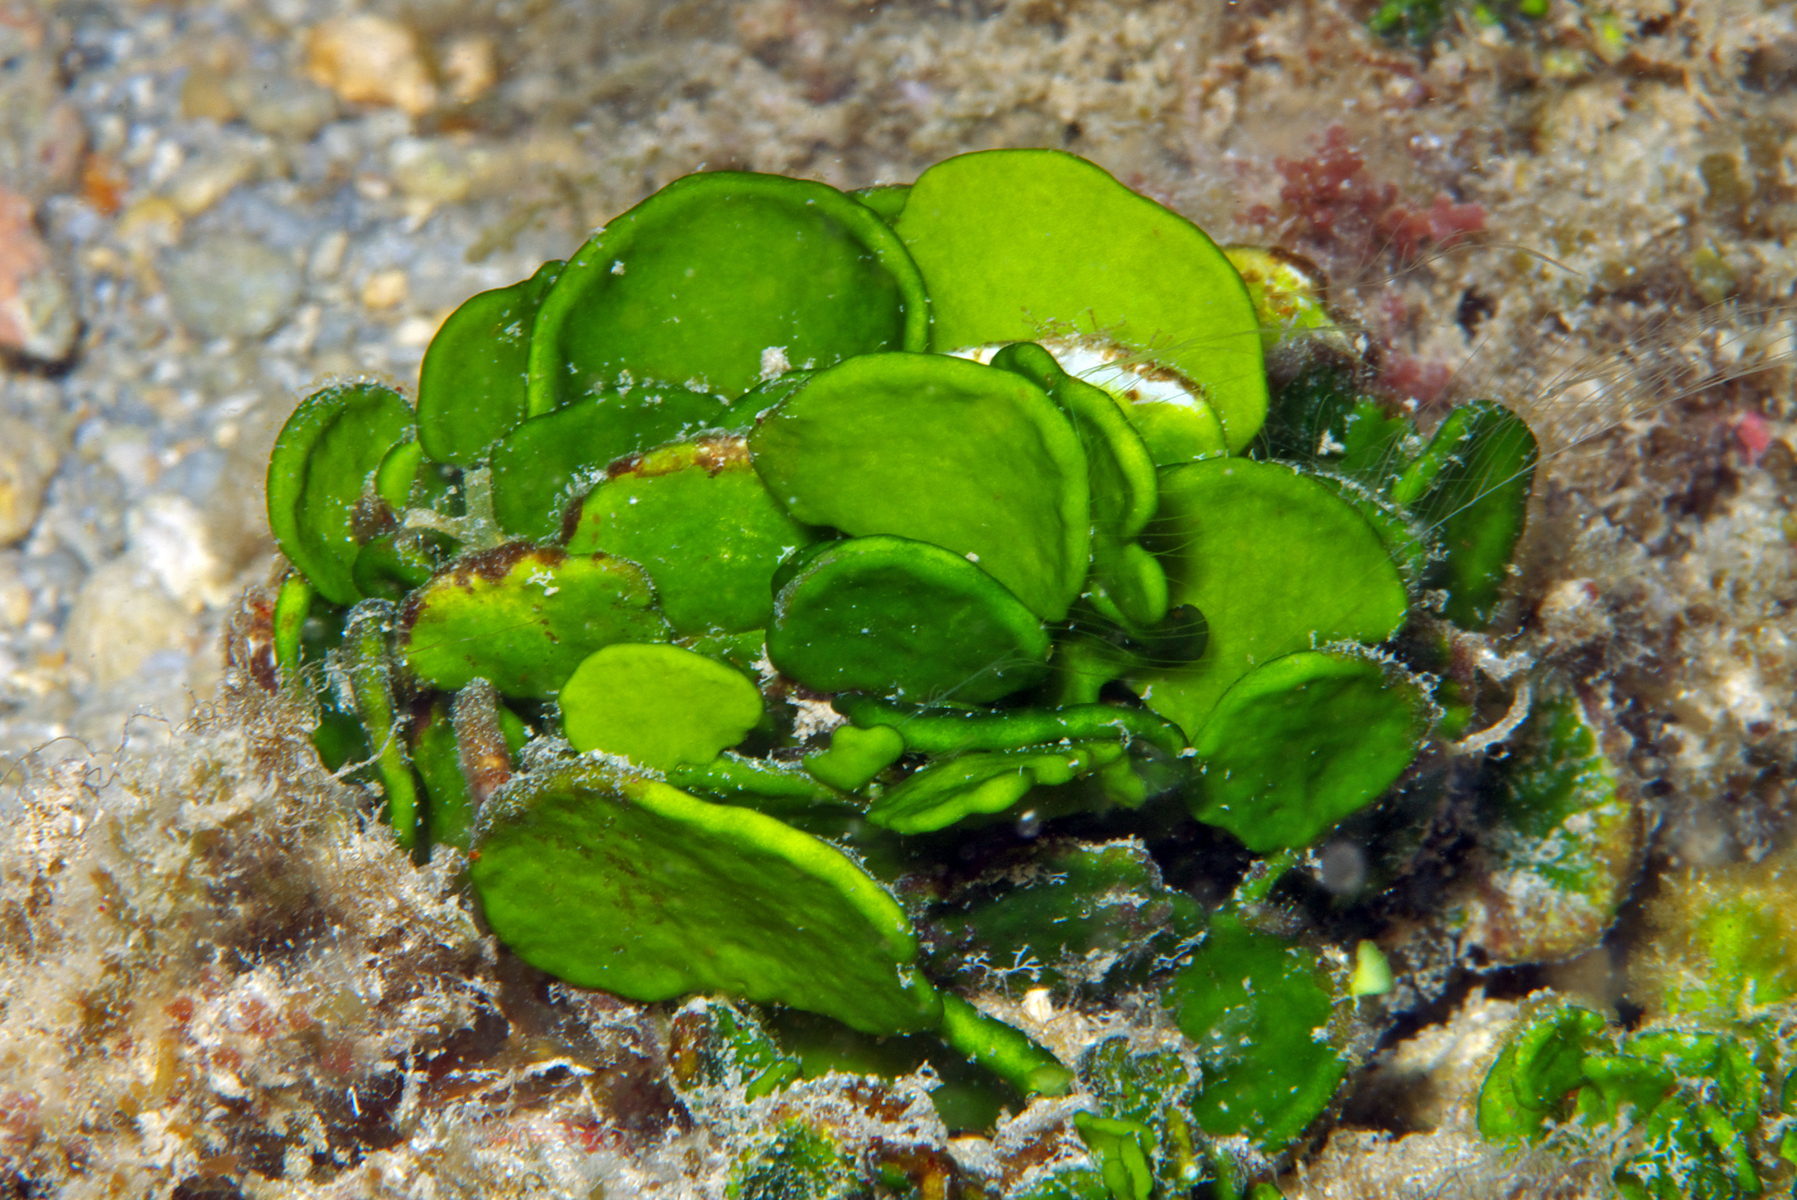
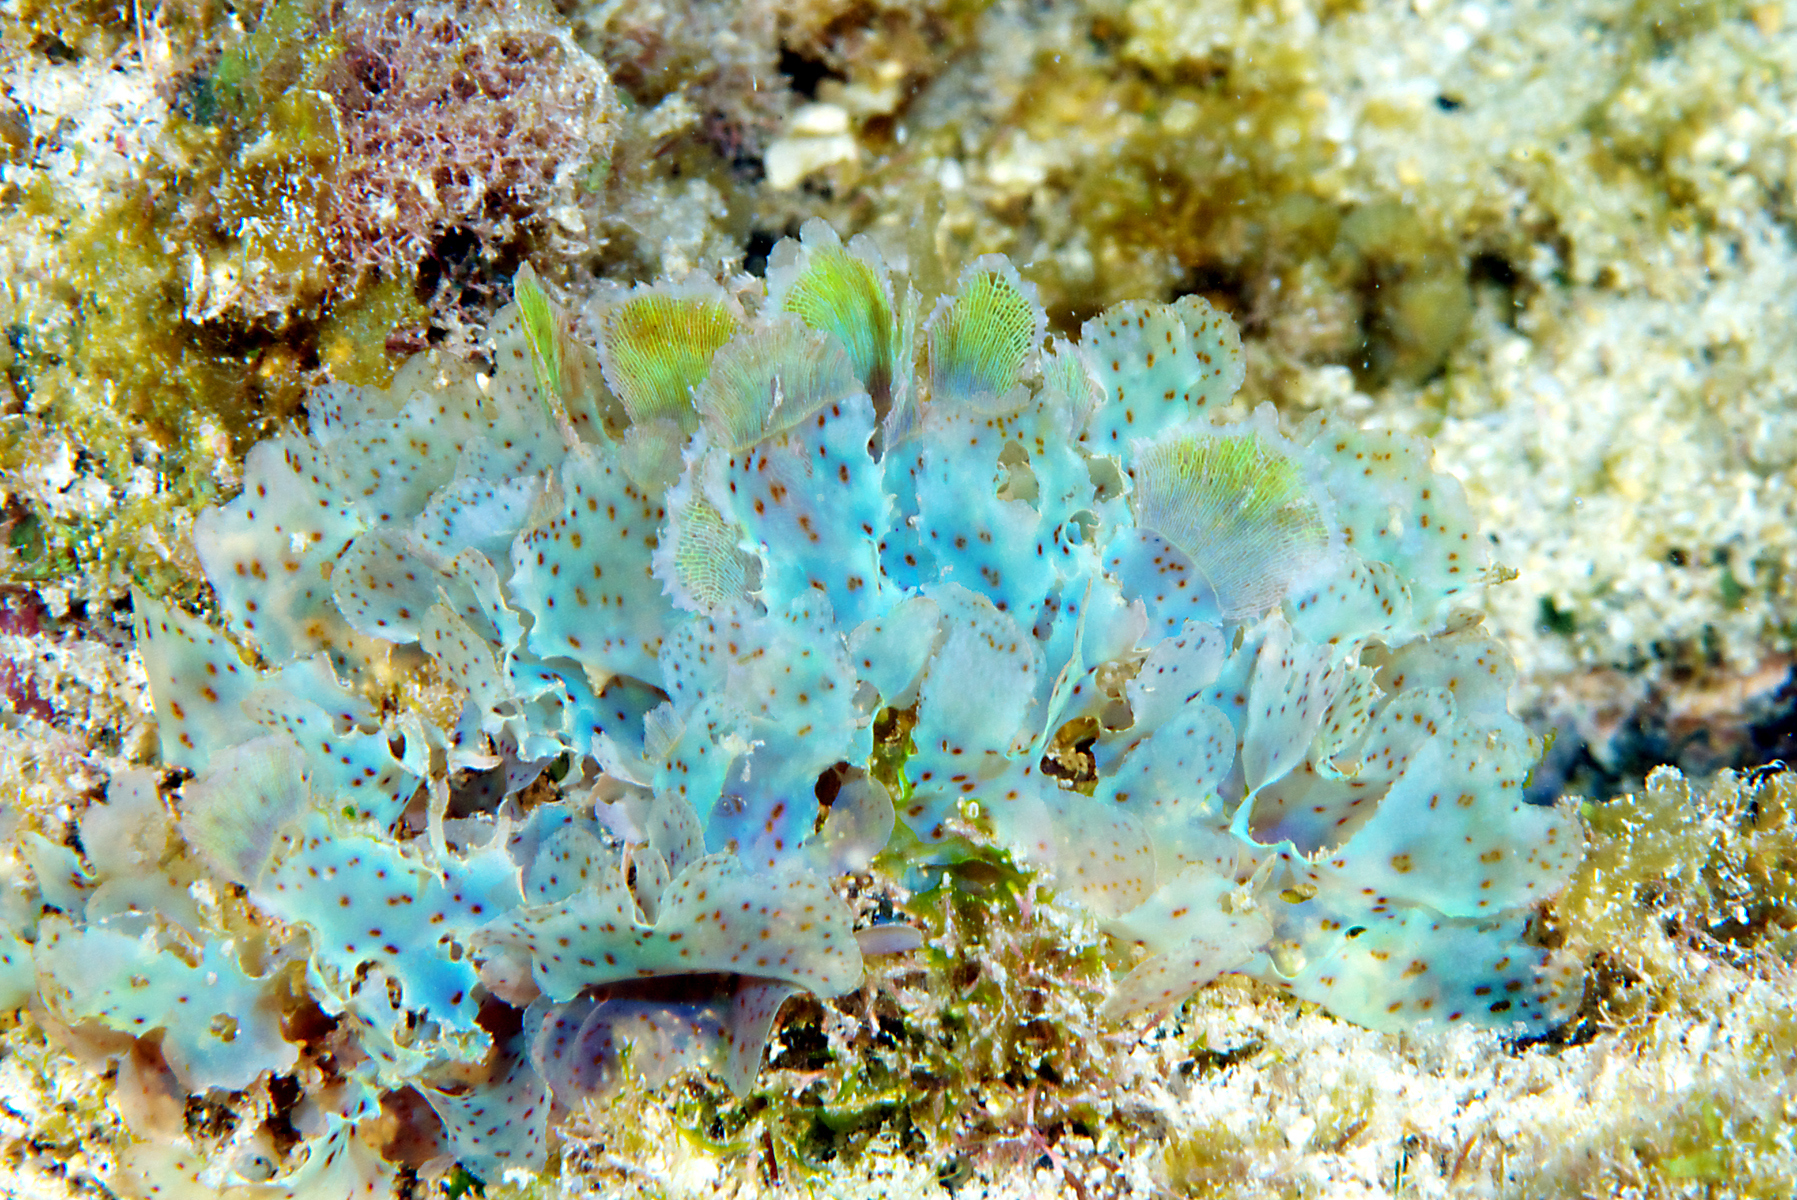
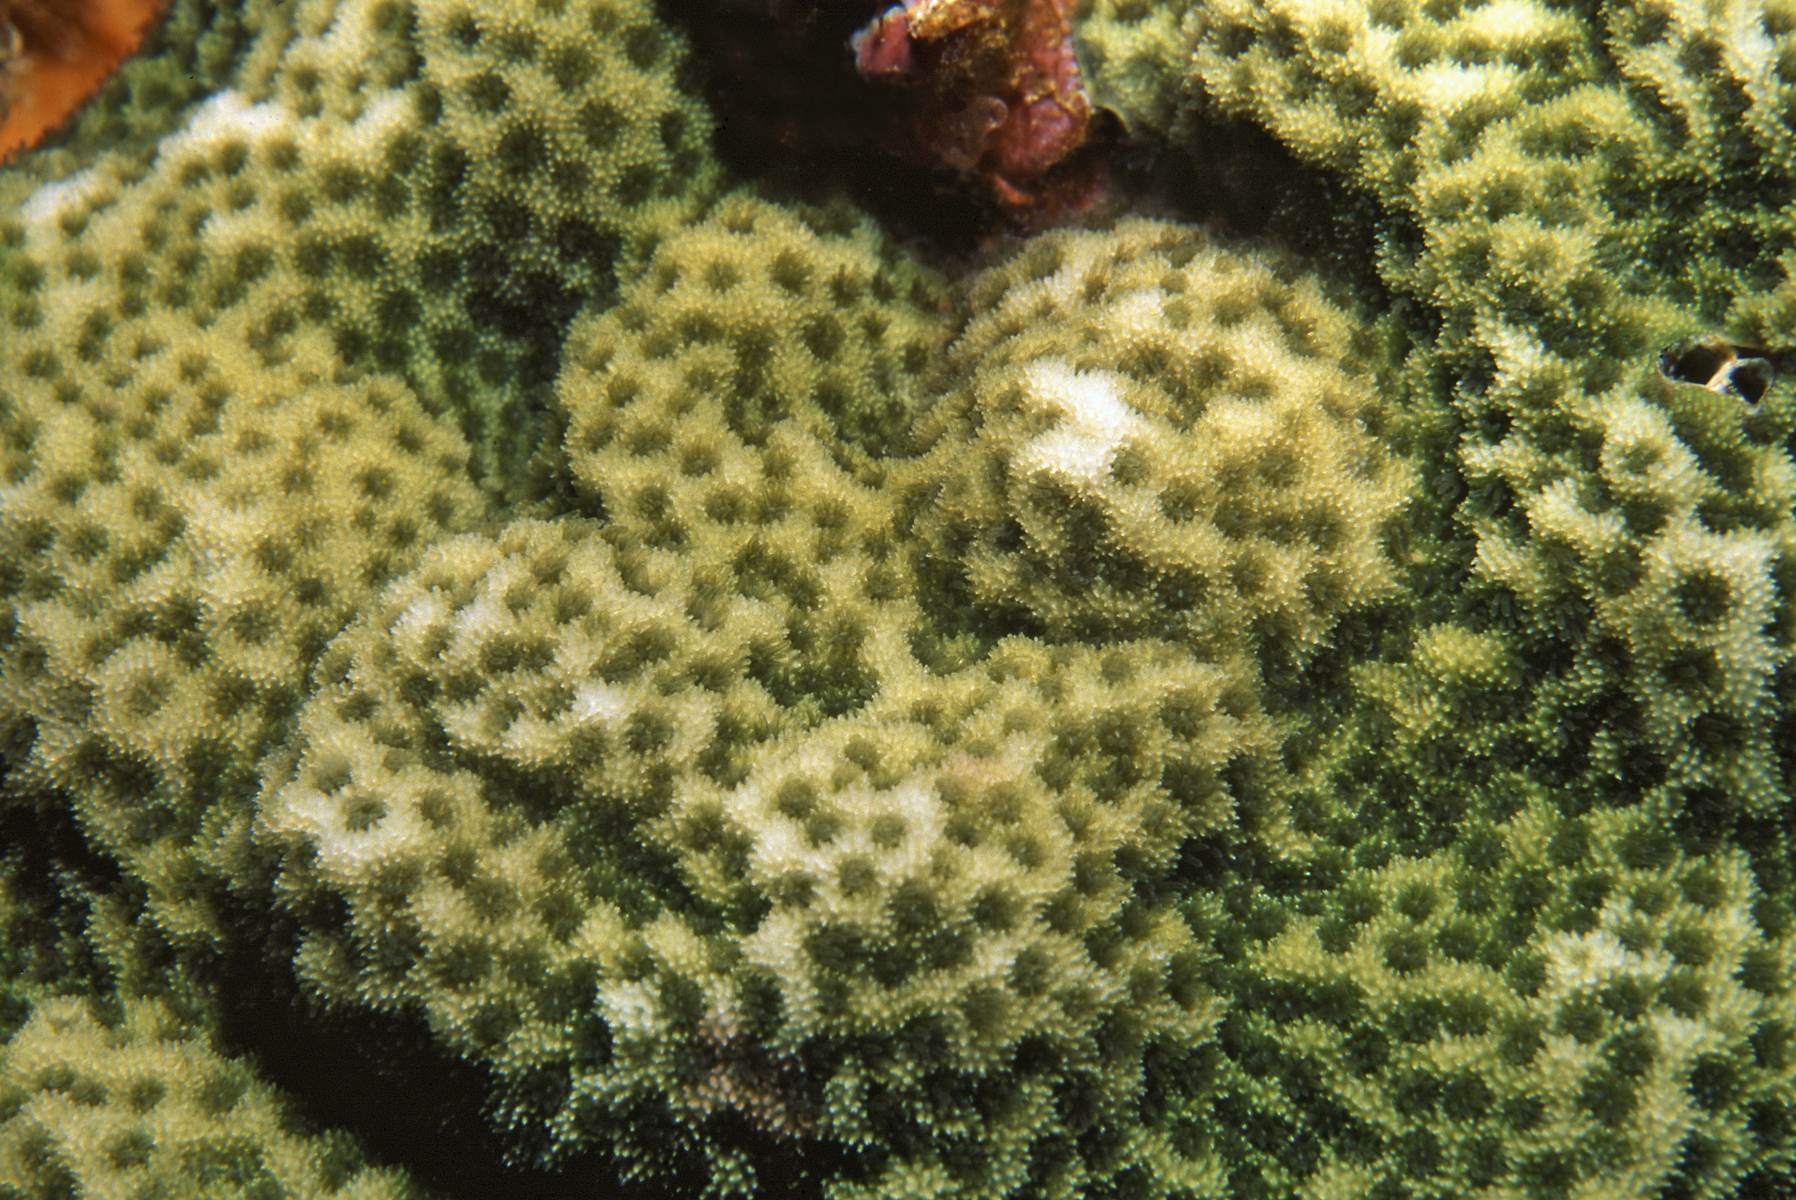
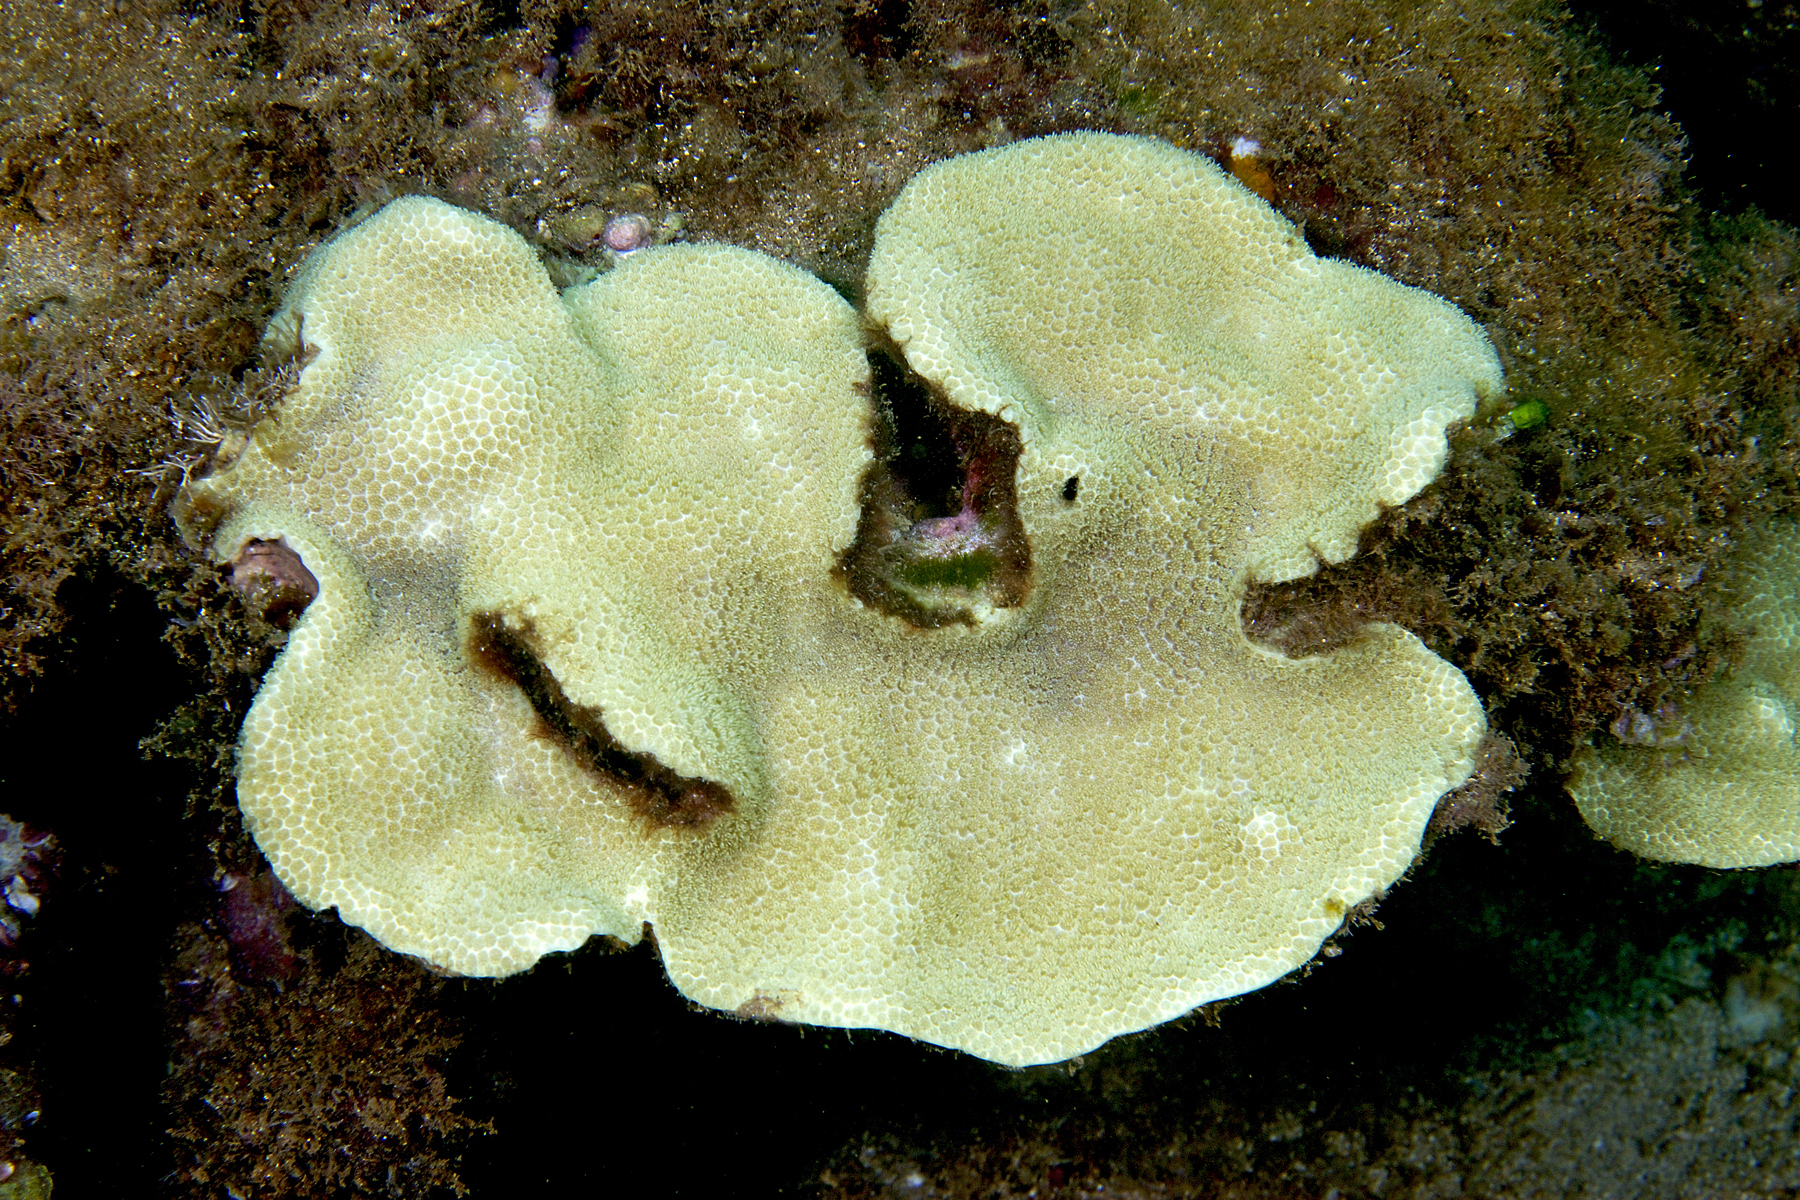
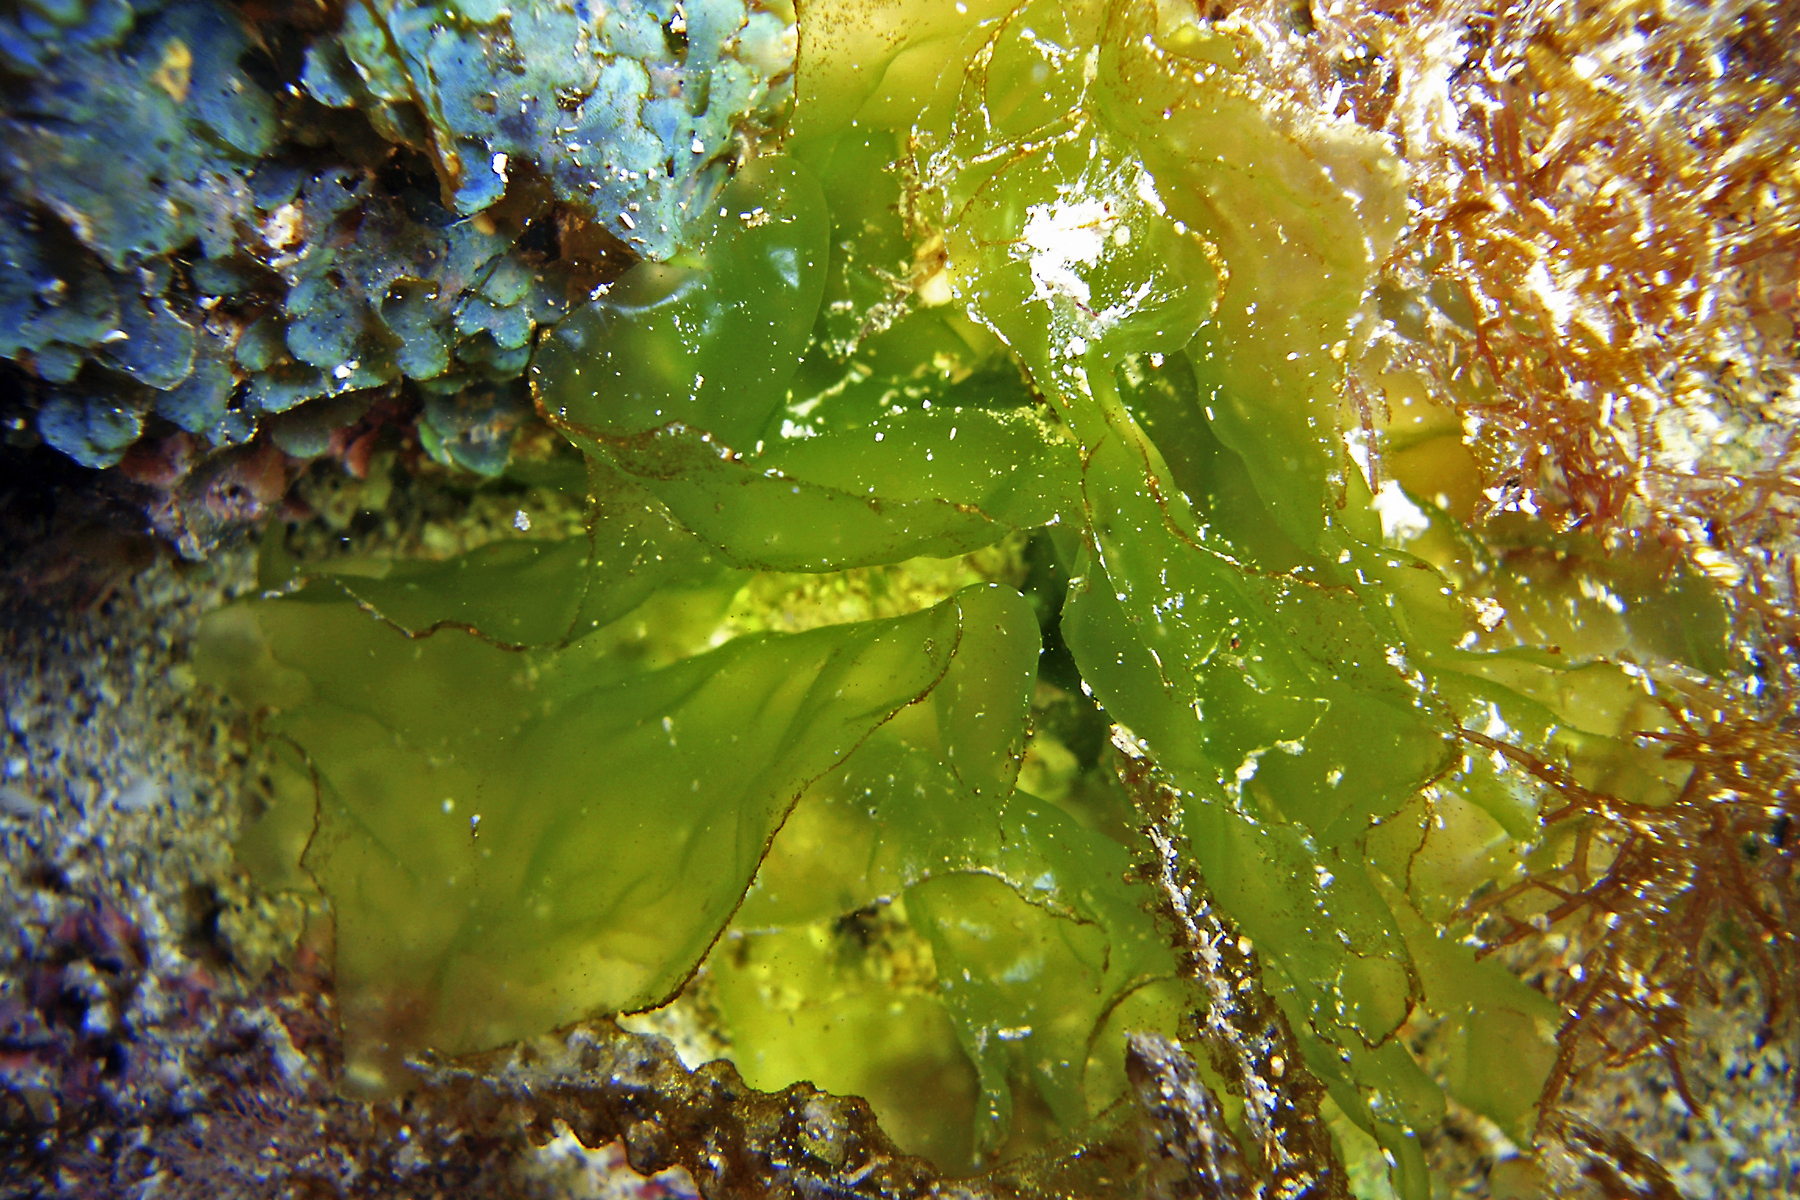
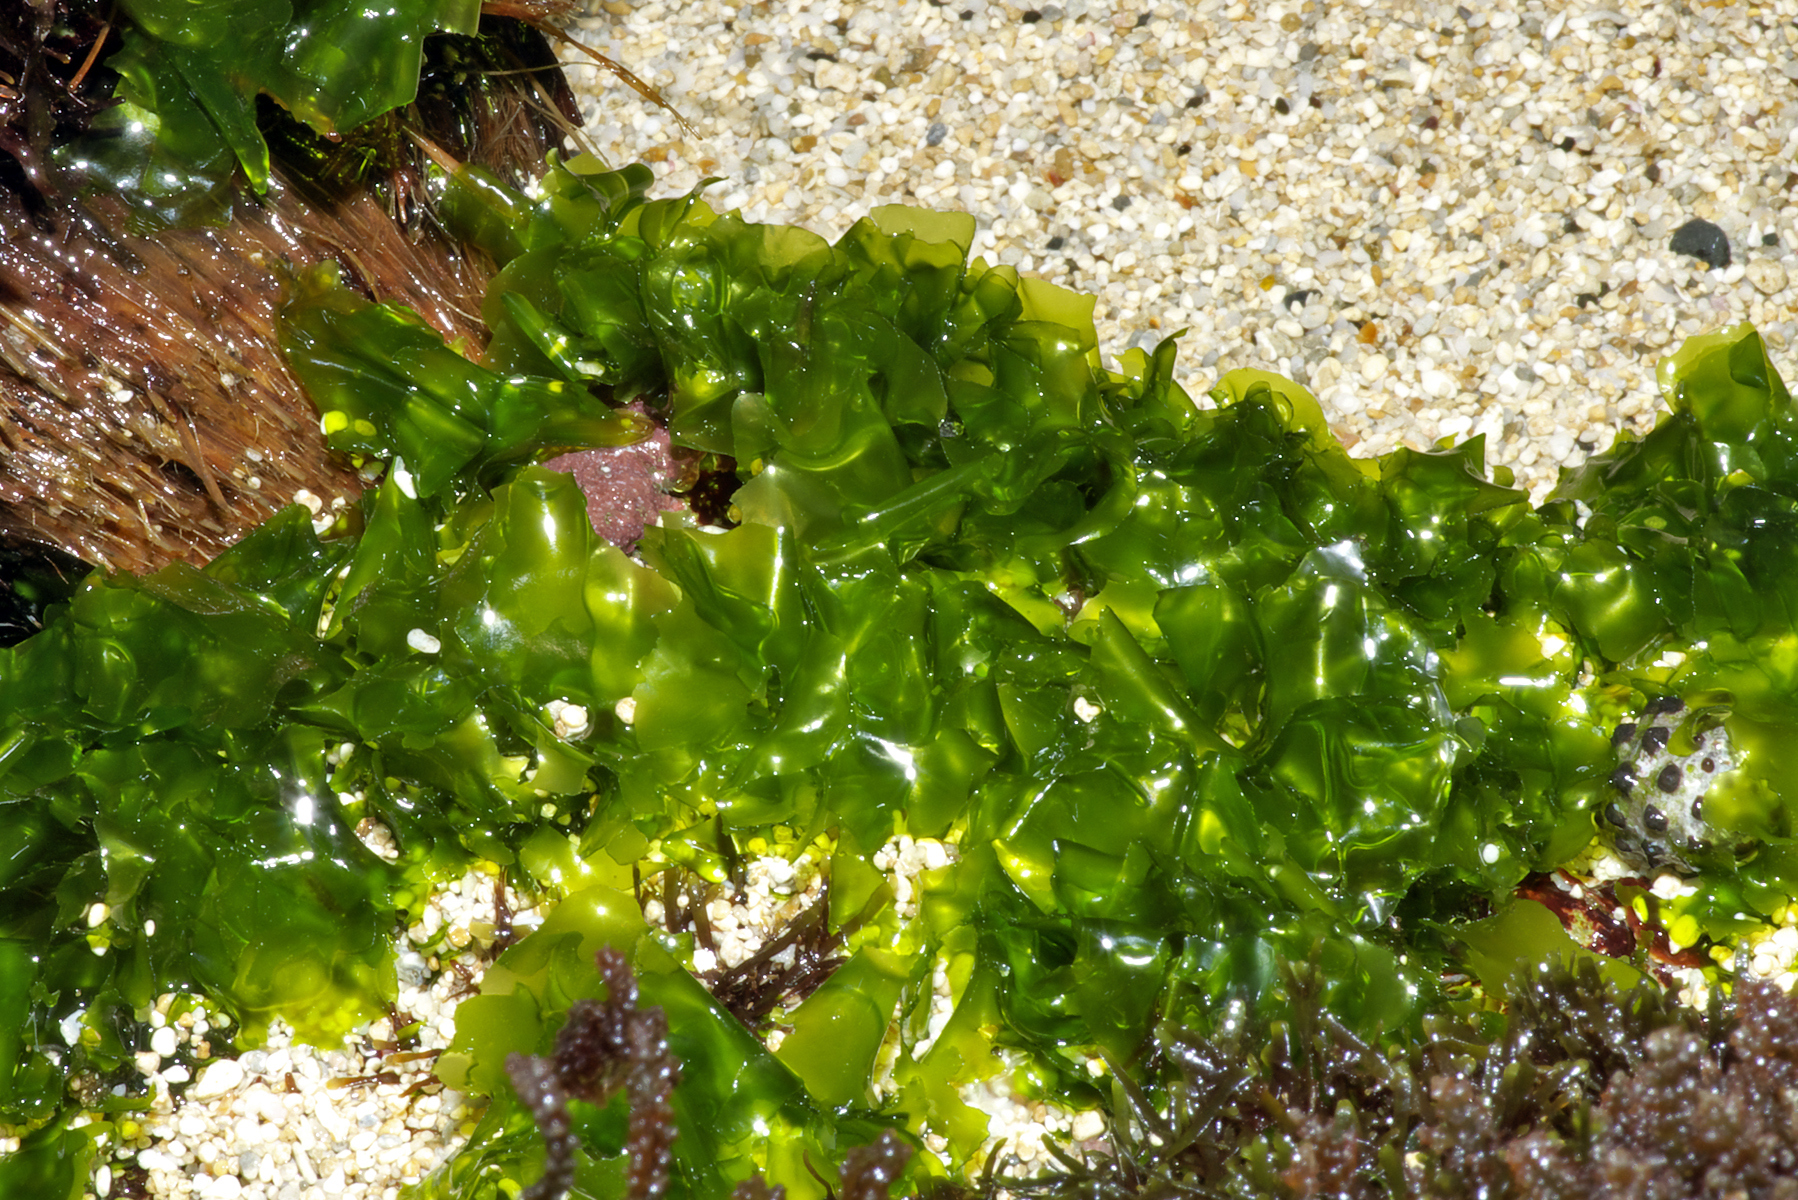
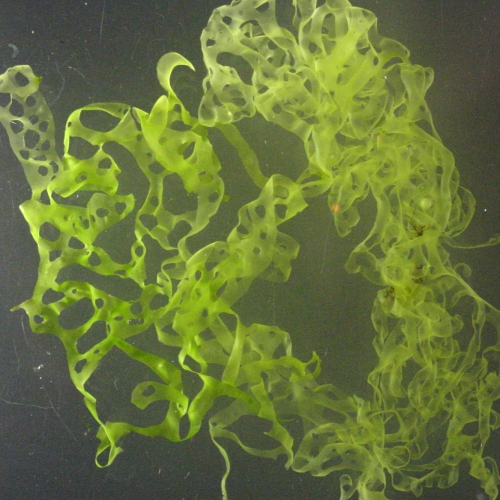
This image shows two samples of the same species of marine limu. The sample on the left is rich in δ15 N nitrogen from processed wastewater, while the one on the right is “natural” limu low in δ15 N nitrogen. Learn more
-
-
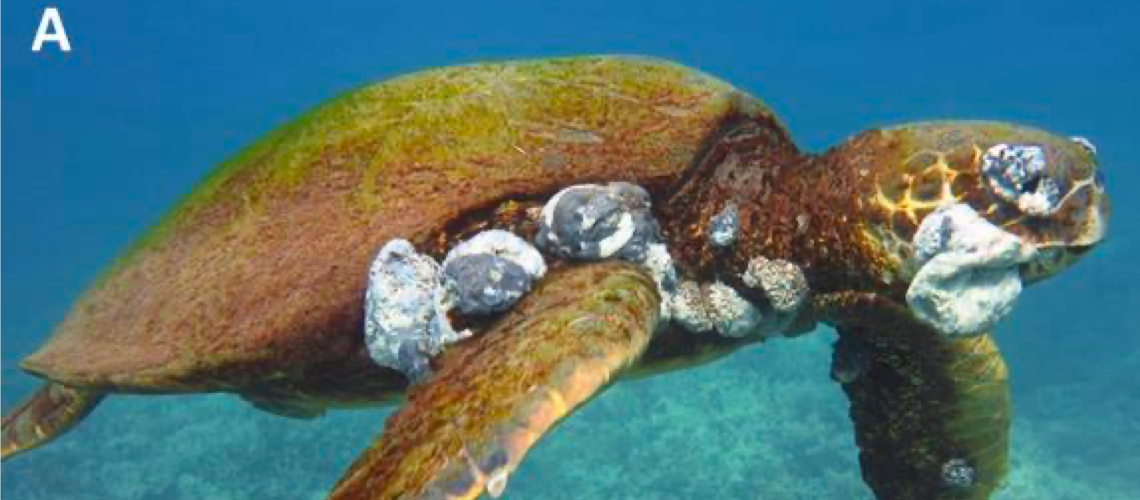
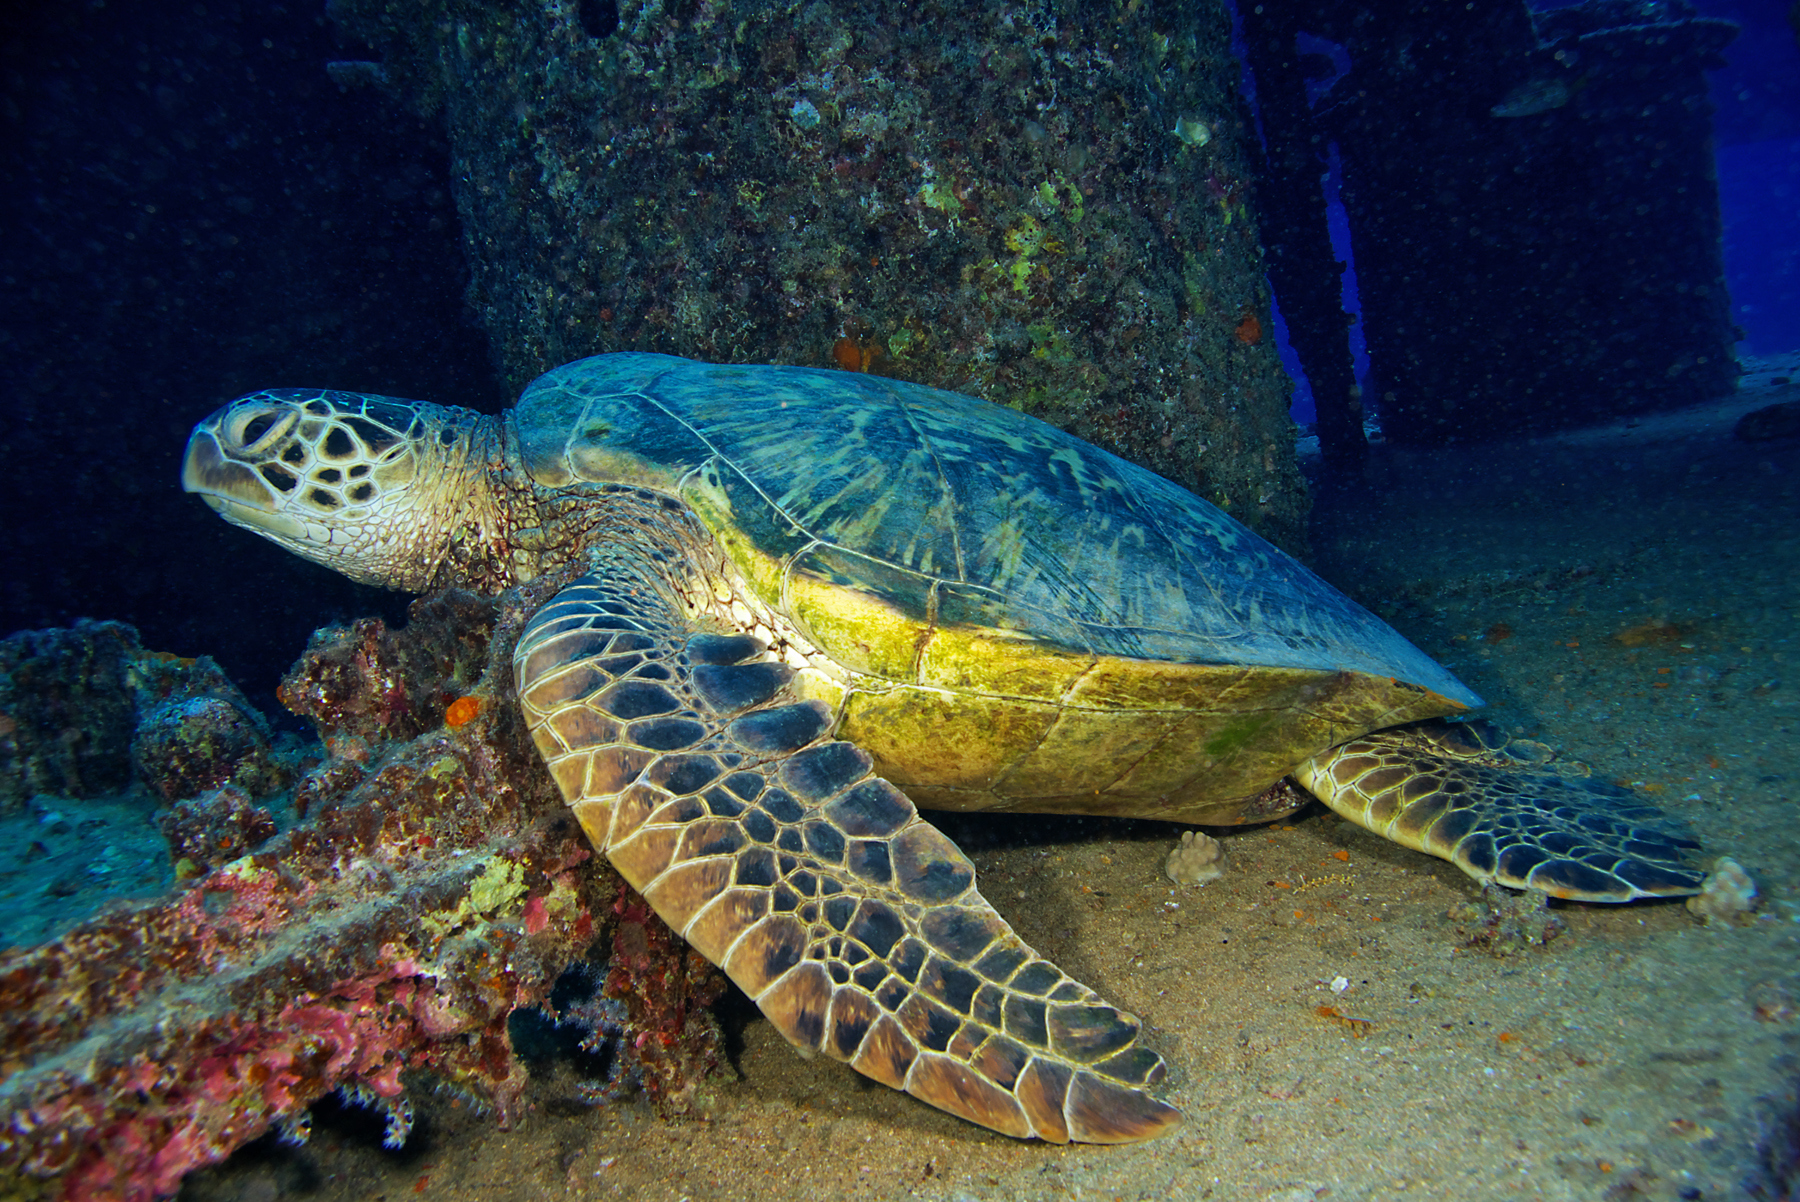
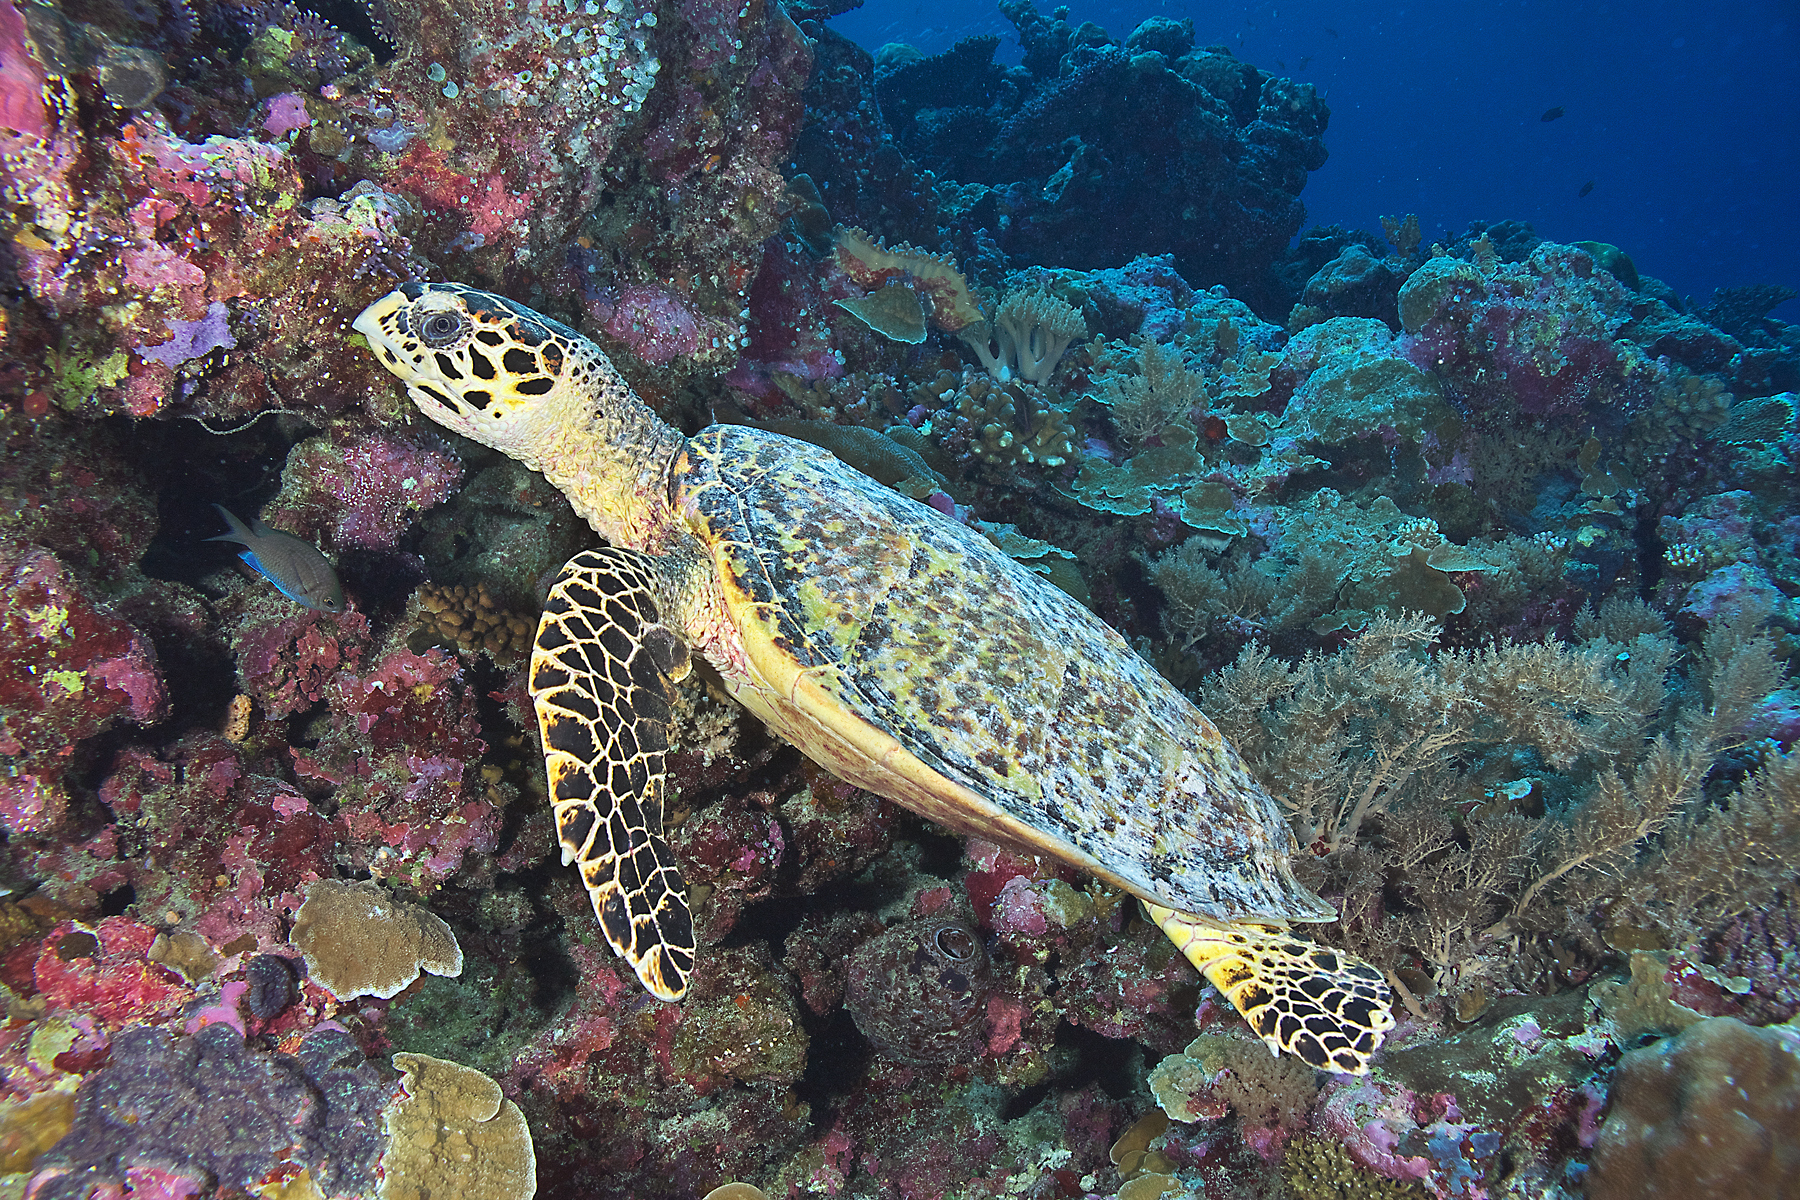
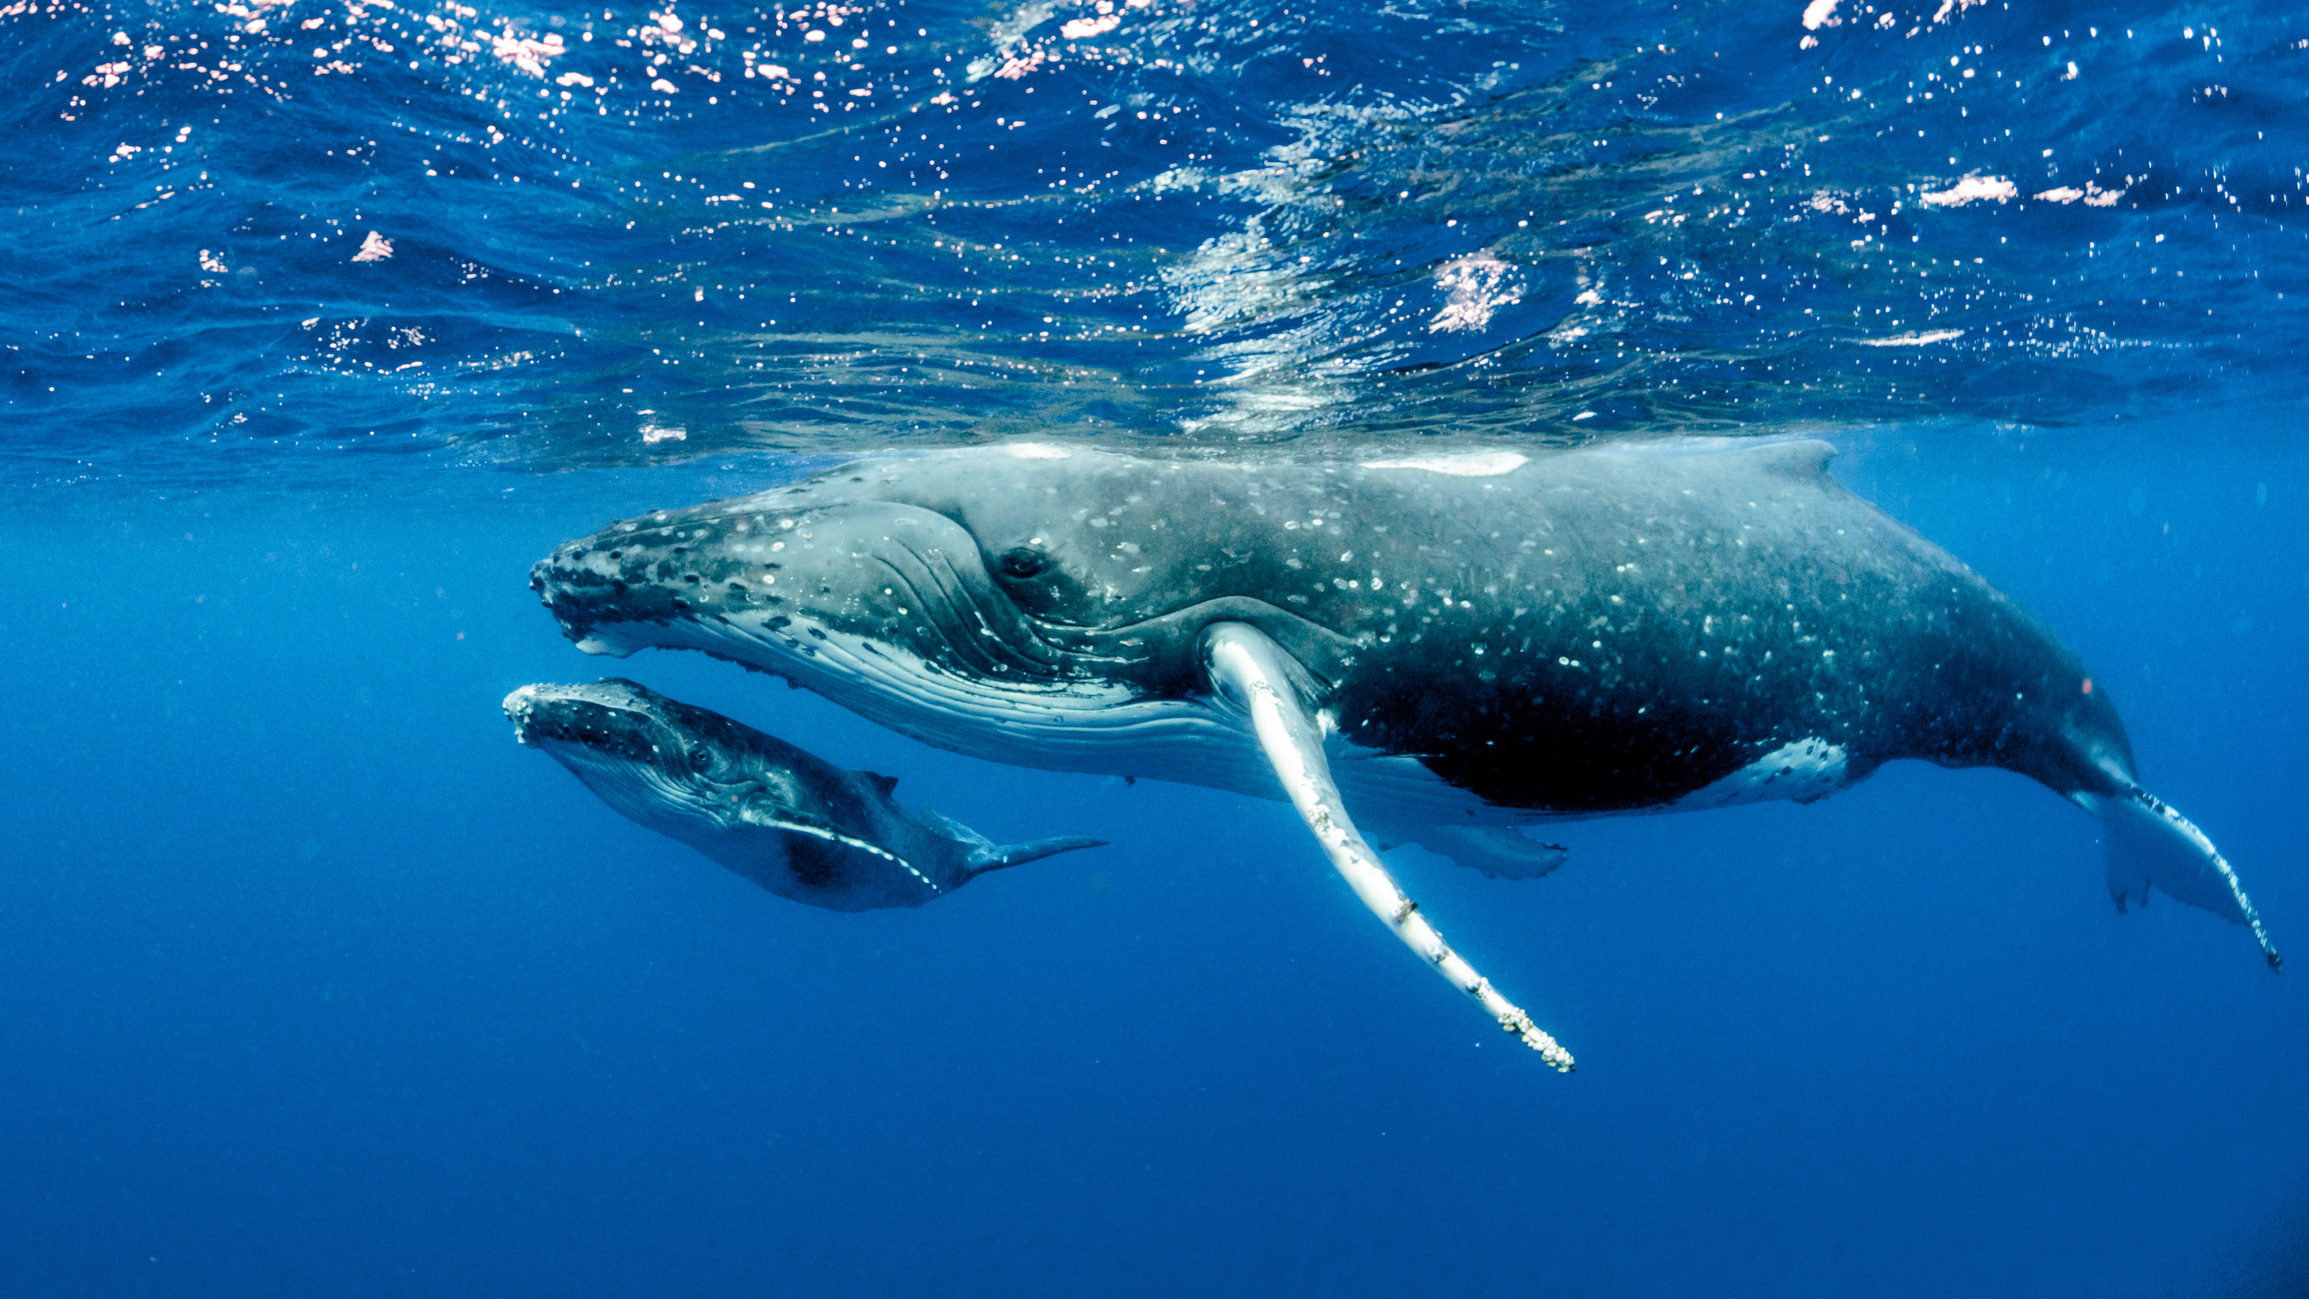
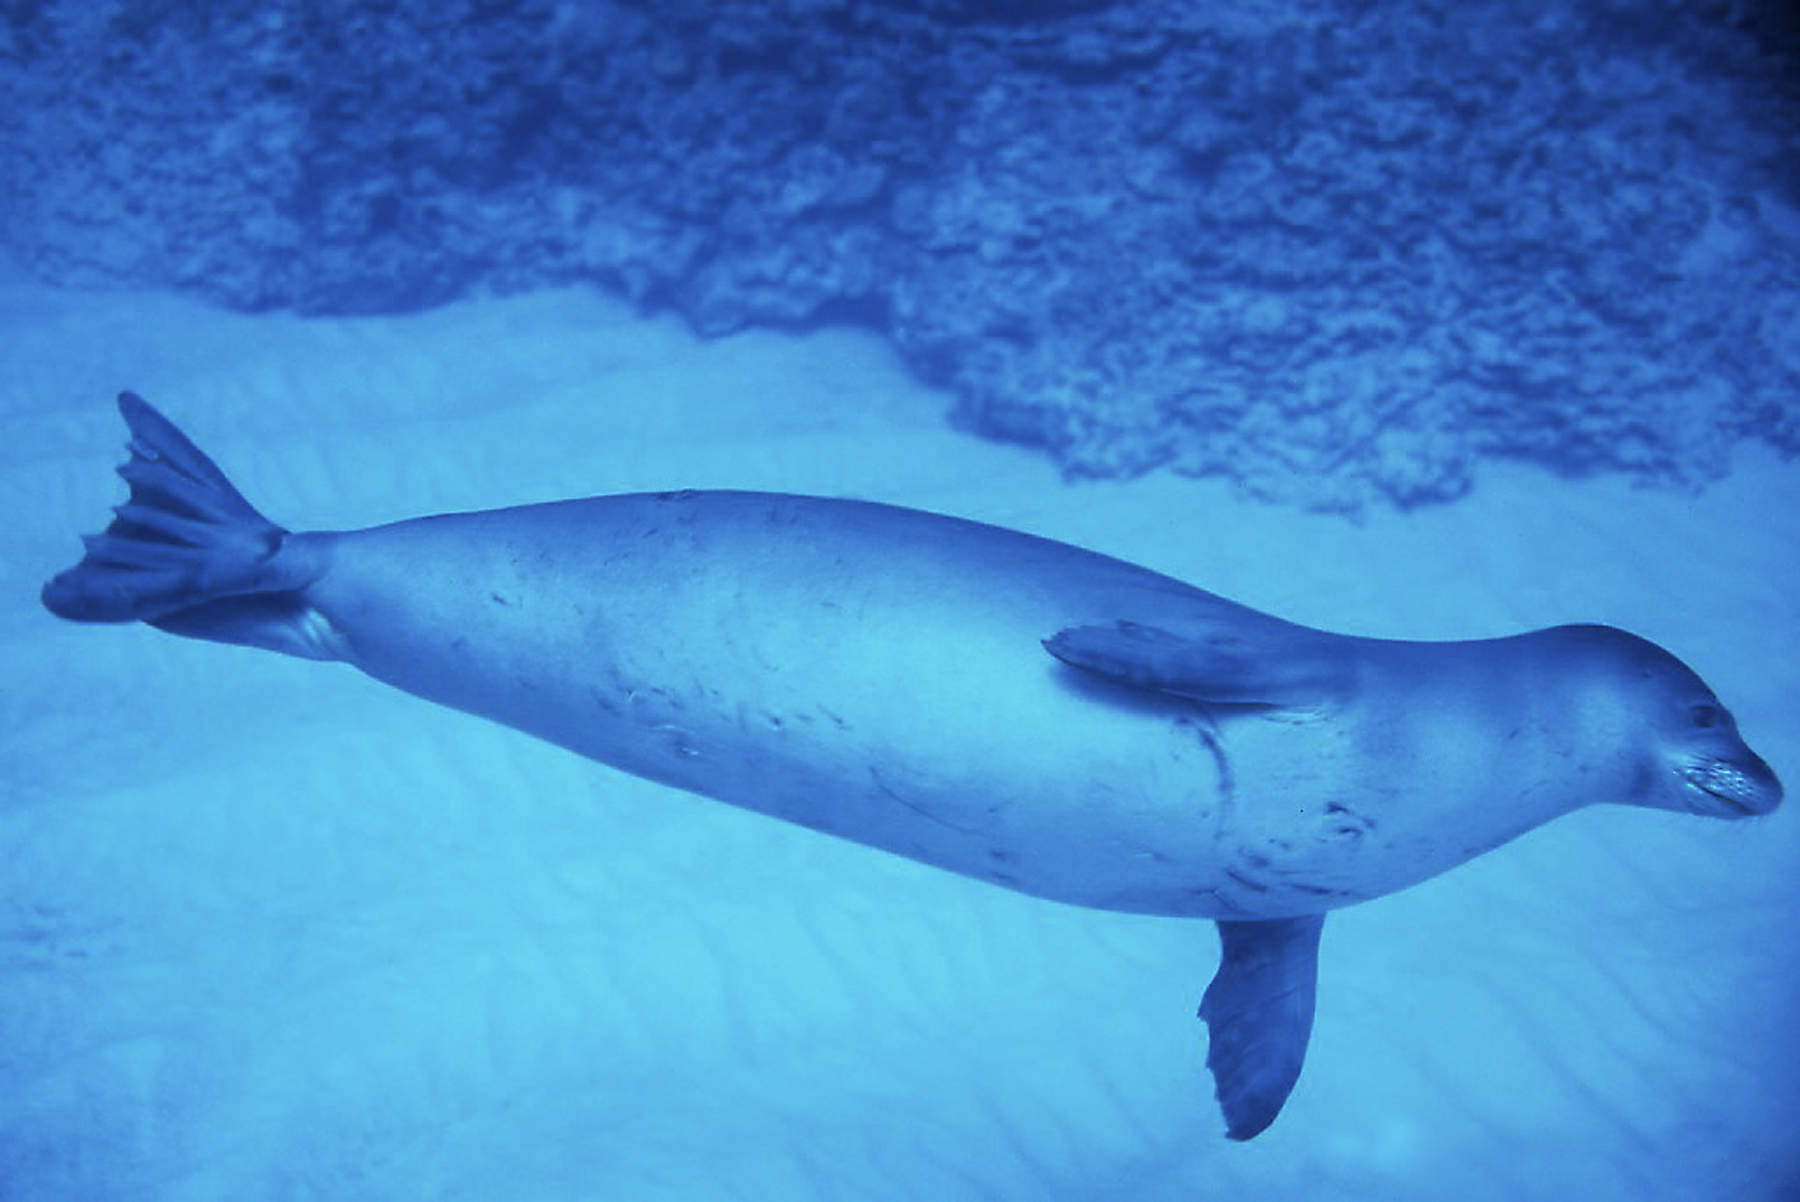
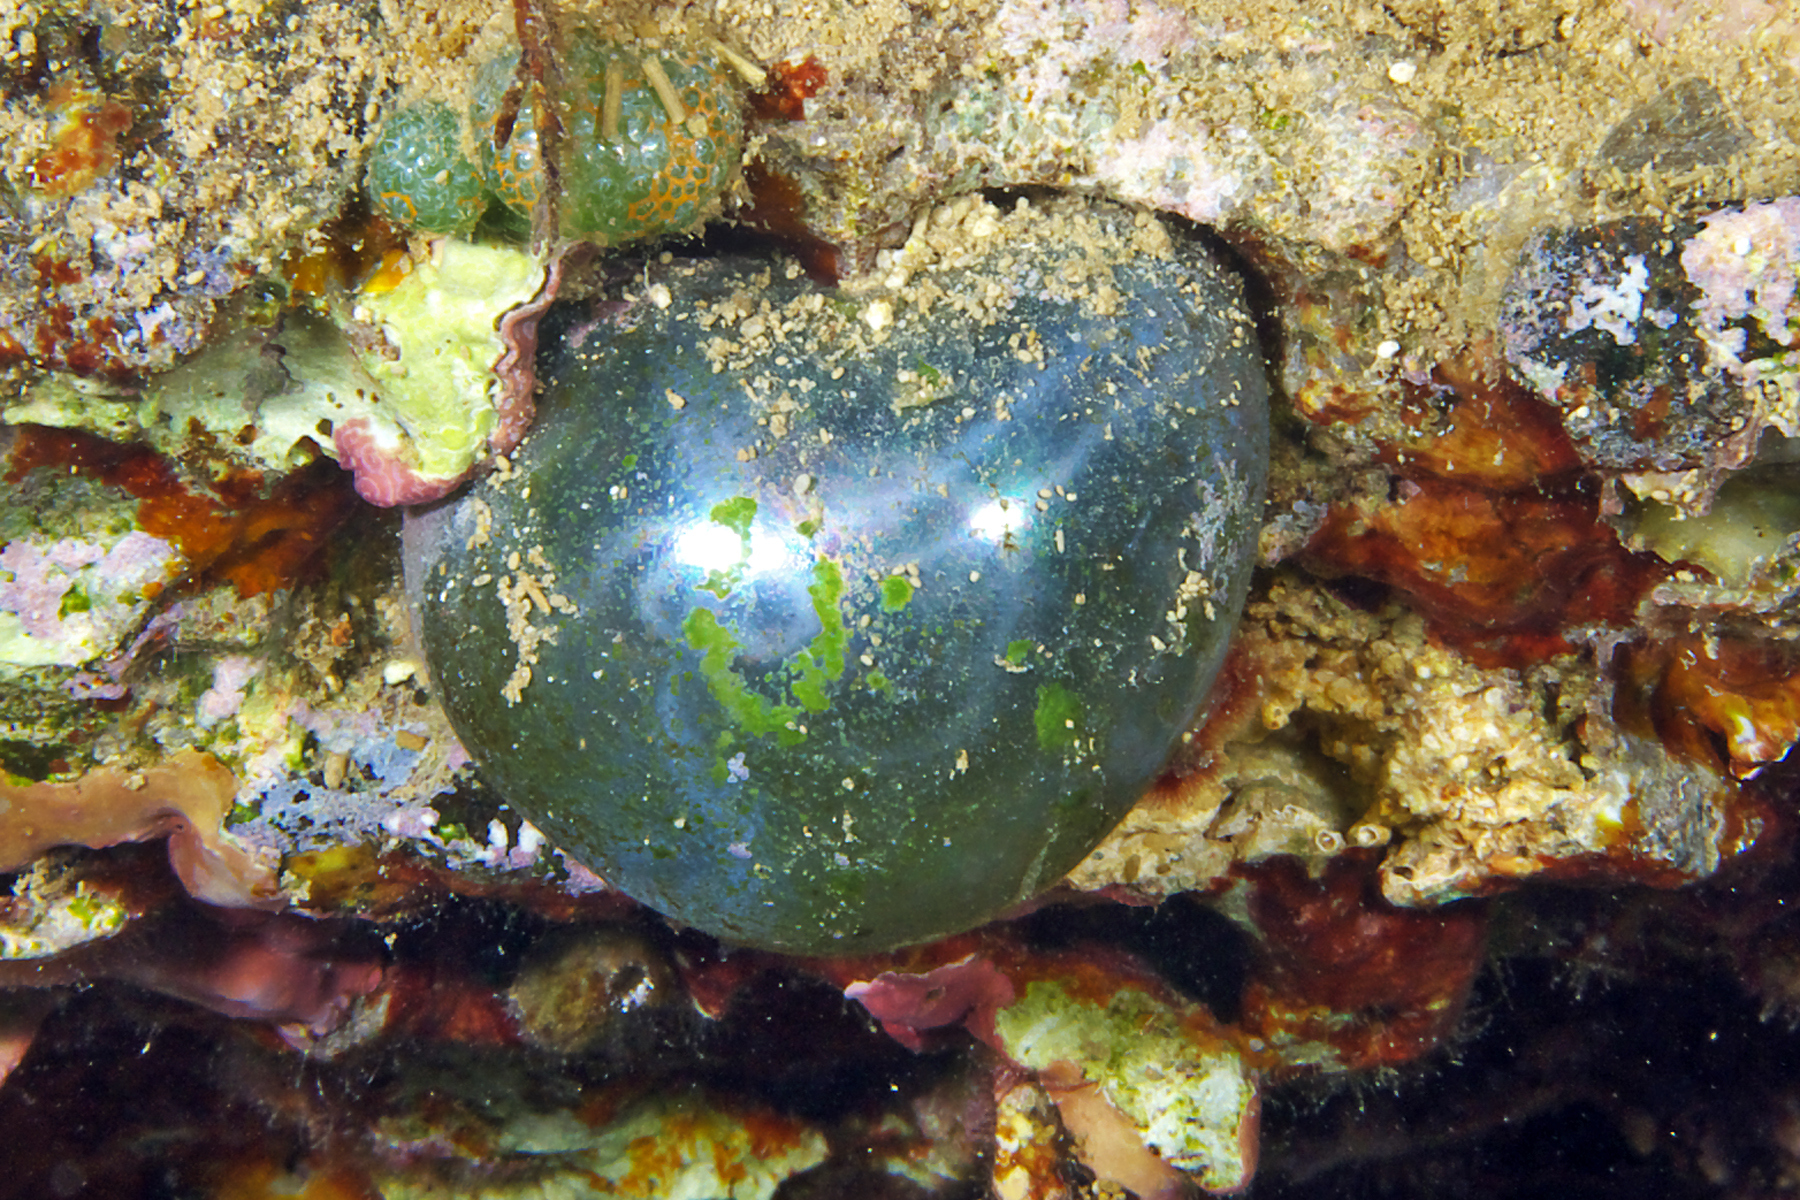
KIHEI, MAUI, HAS BEEN CALLED A "GROUND ZERO" FOR FIBROPAPILLOMATOSIS
Fibropapillomatosis is a disease that is caused by a herpes virus and manifests as tumors in turtles. The virus is injected into the environment, and green sea turtles ingest invasive ocean algae, fed by excess nitrogen found in injected wastewater in Kihei, causing the growth of the tumors, a leading cause of death of the endangered species.
-
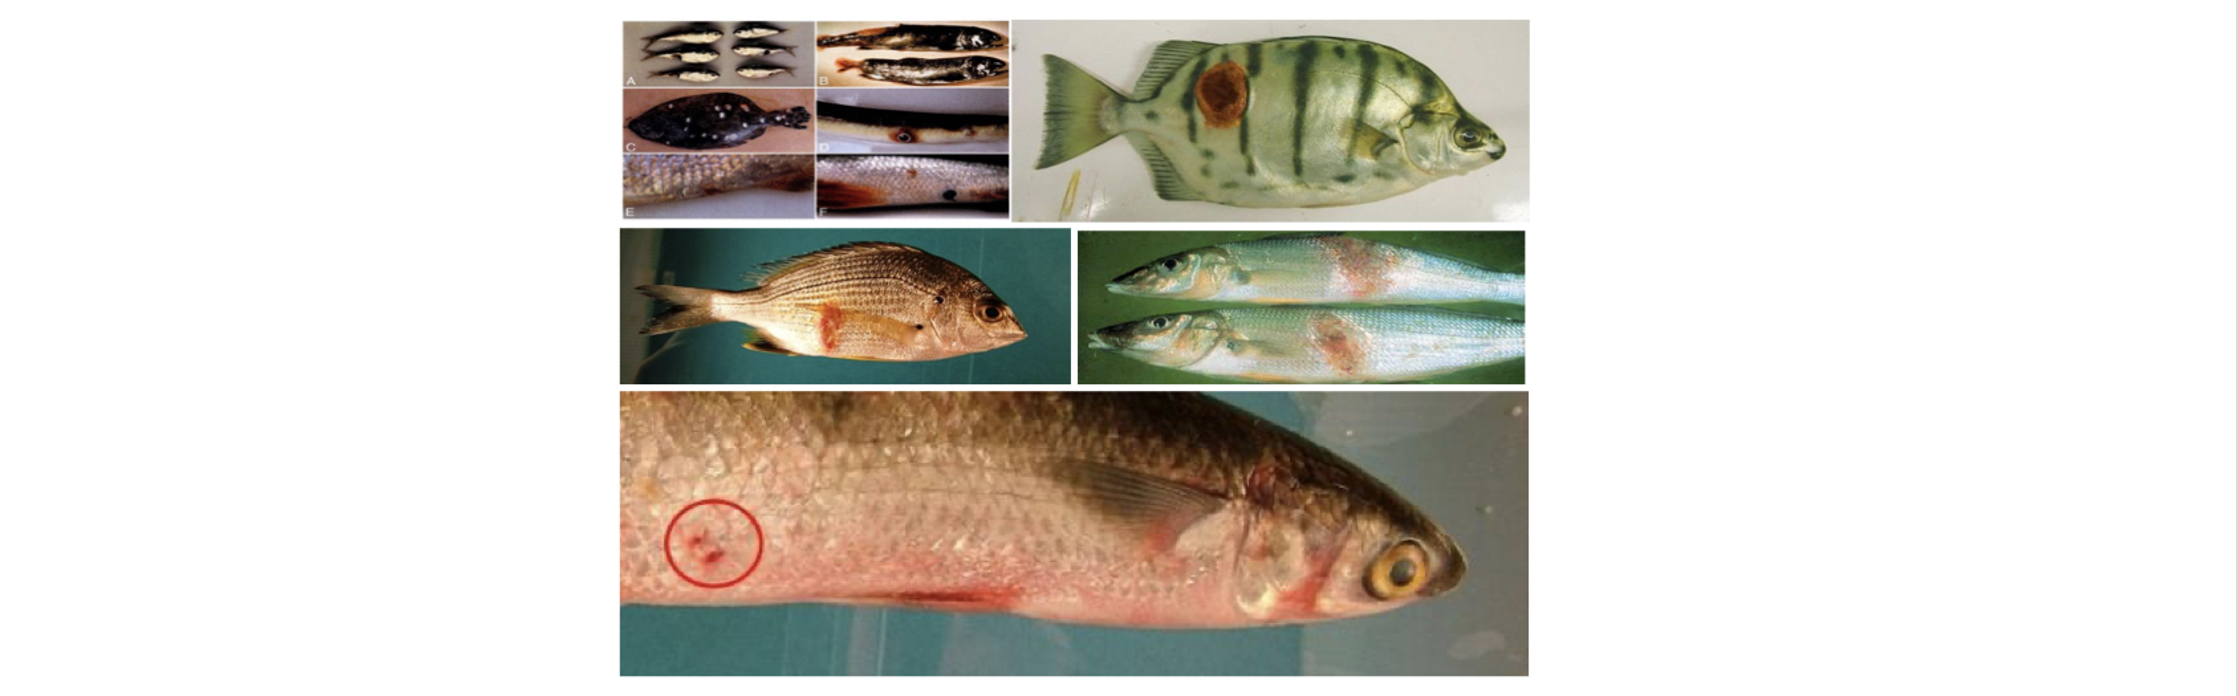
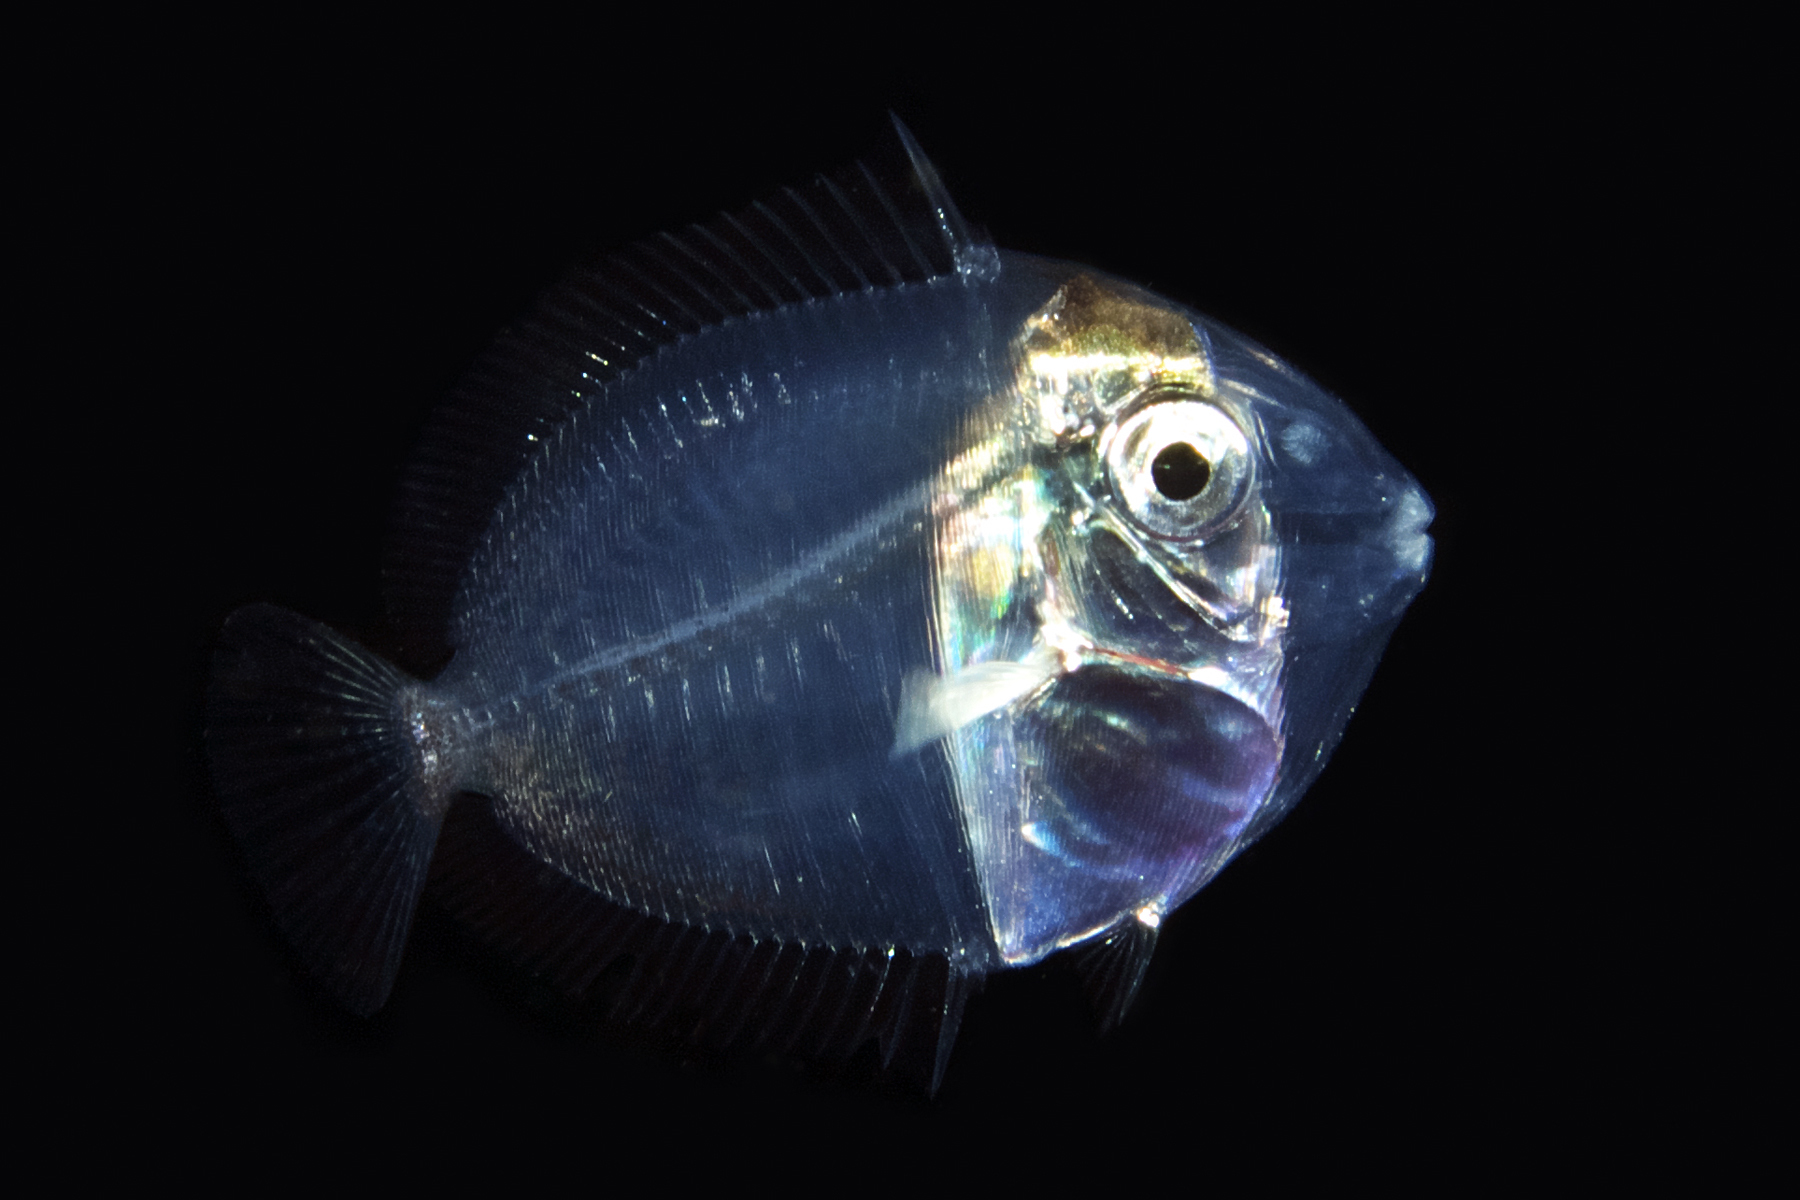
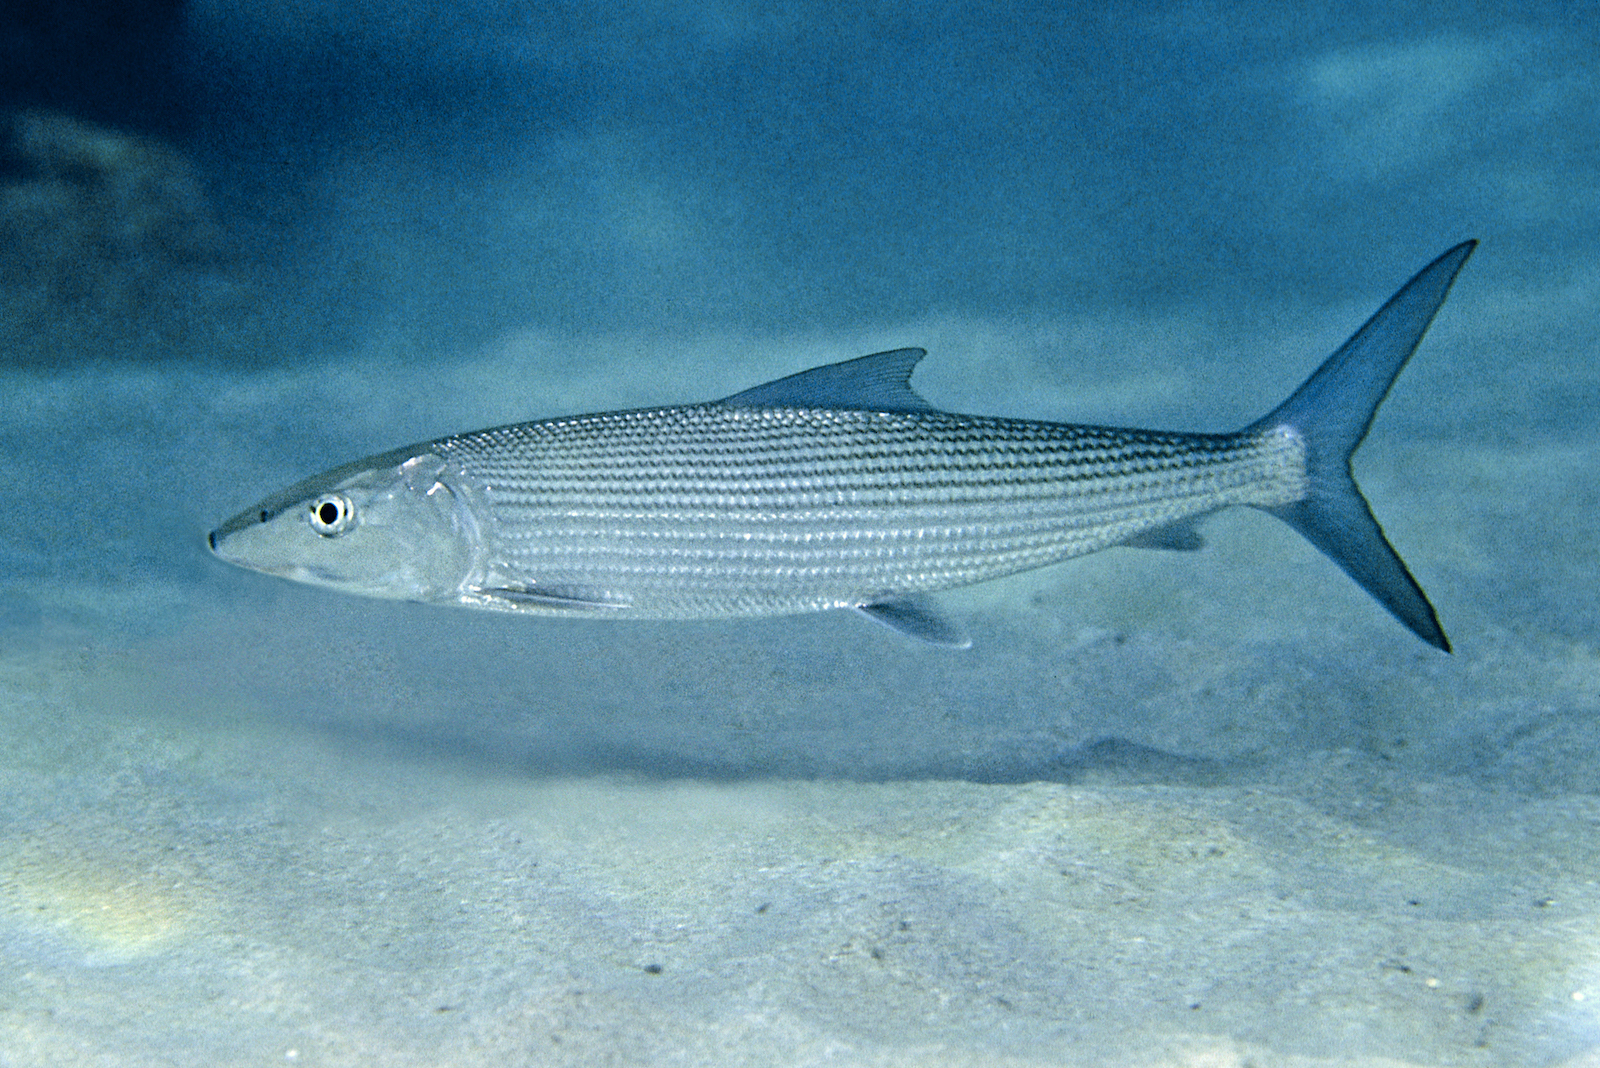
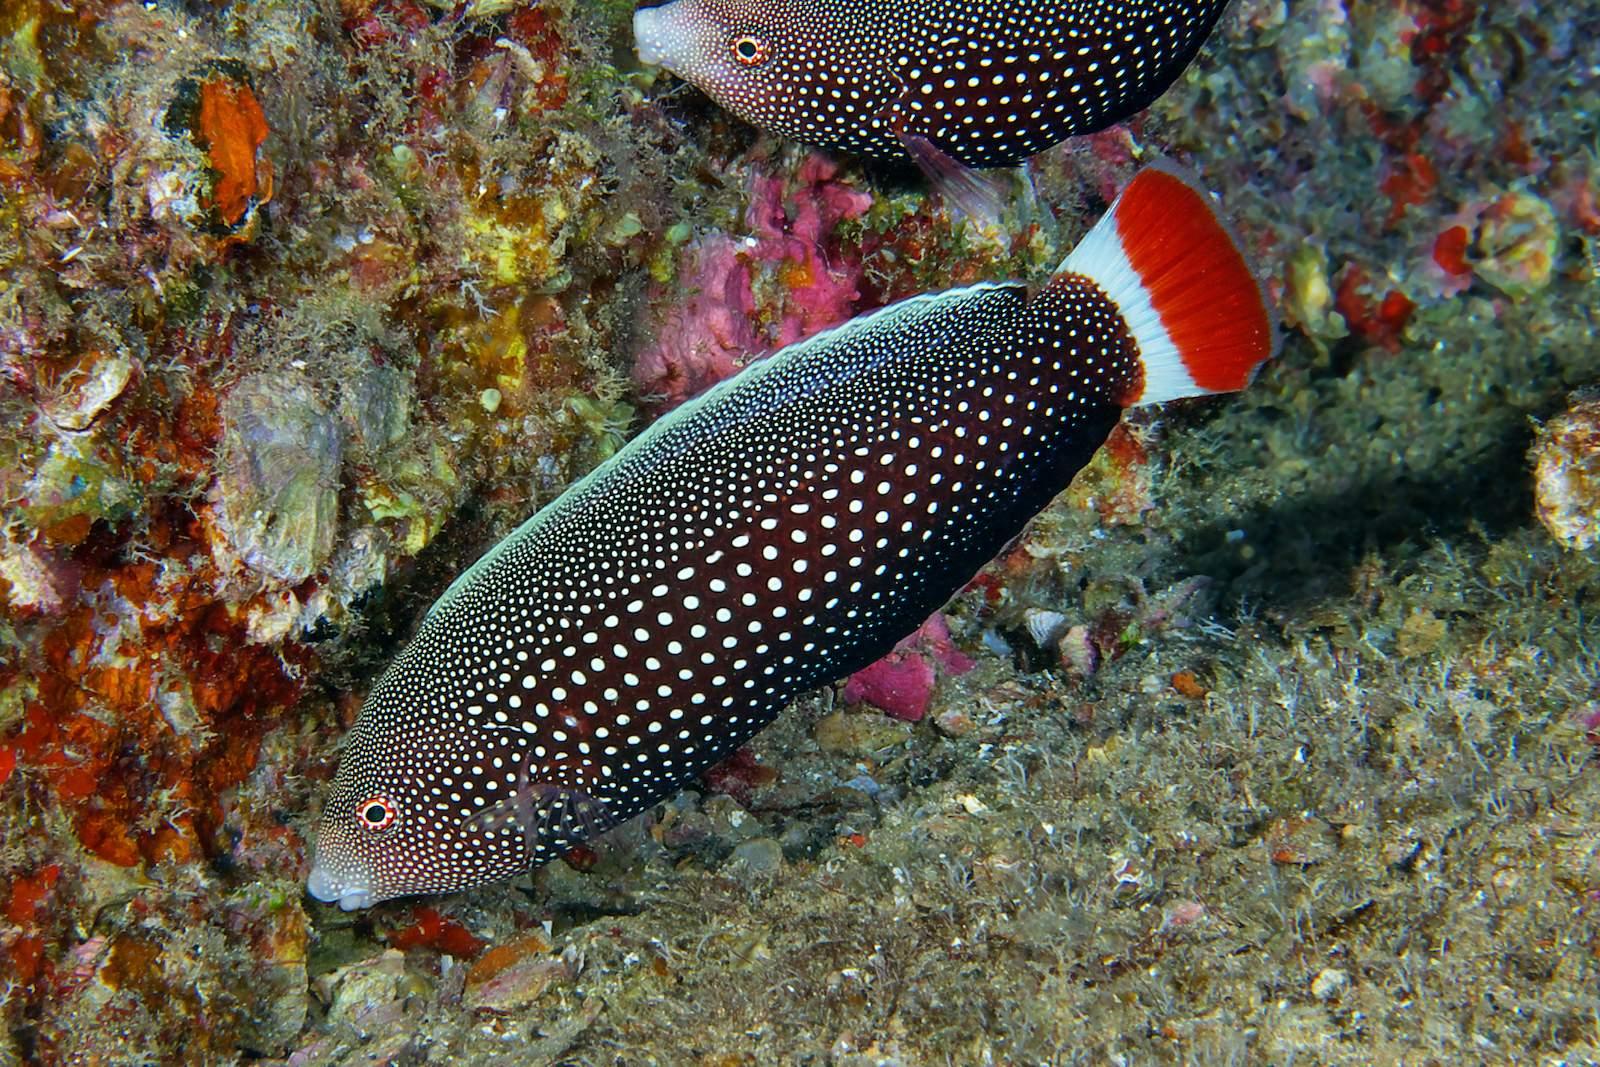
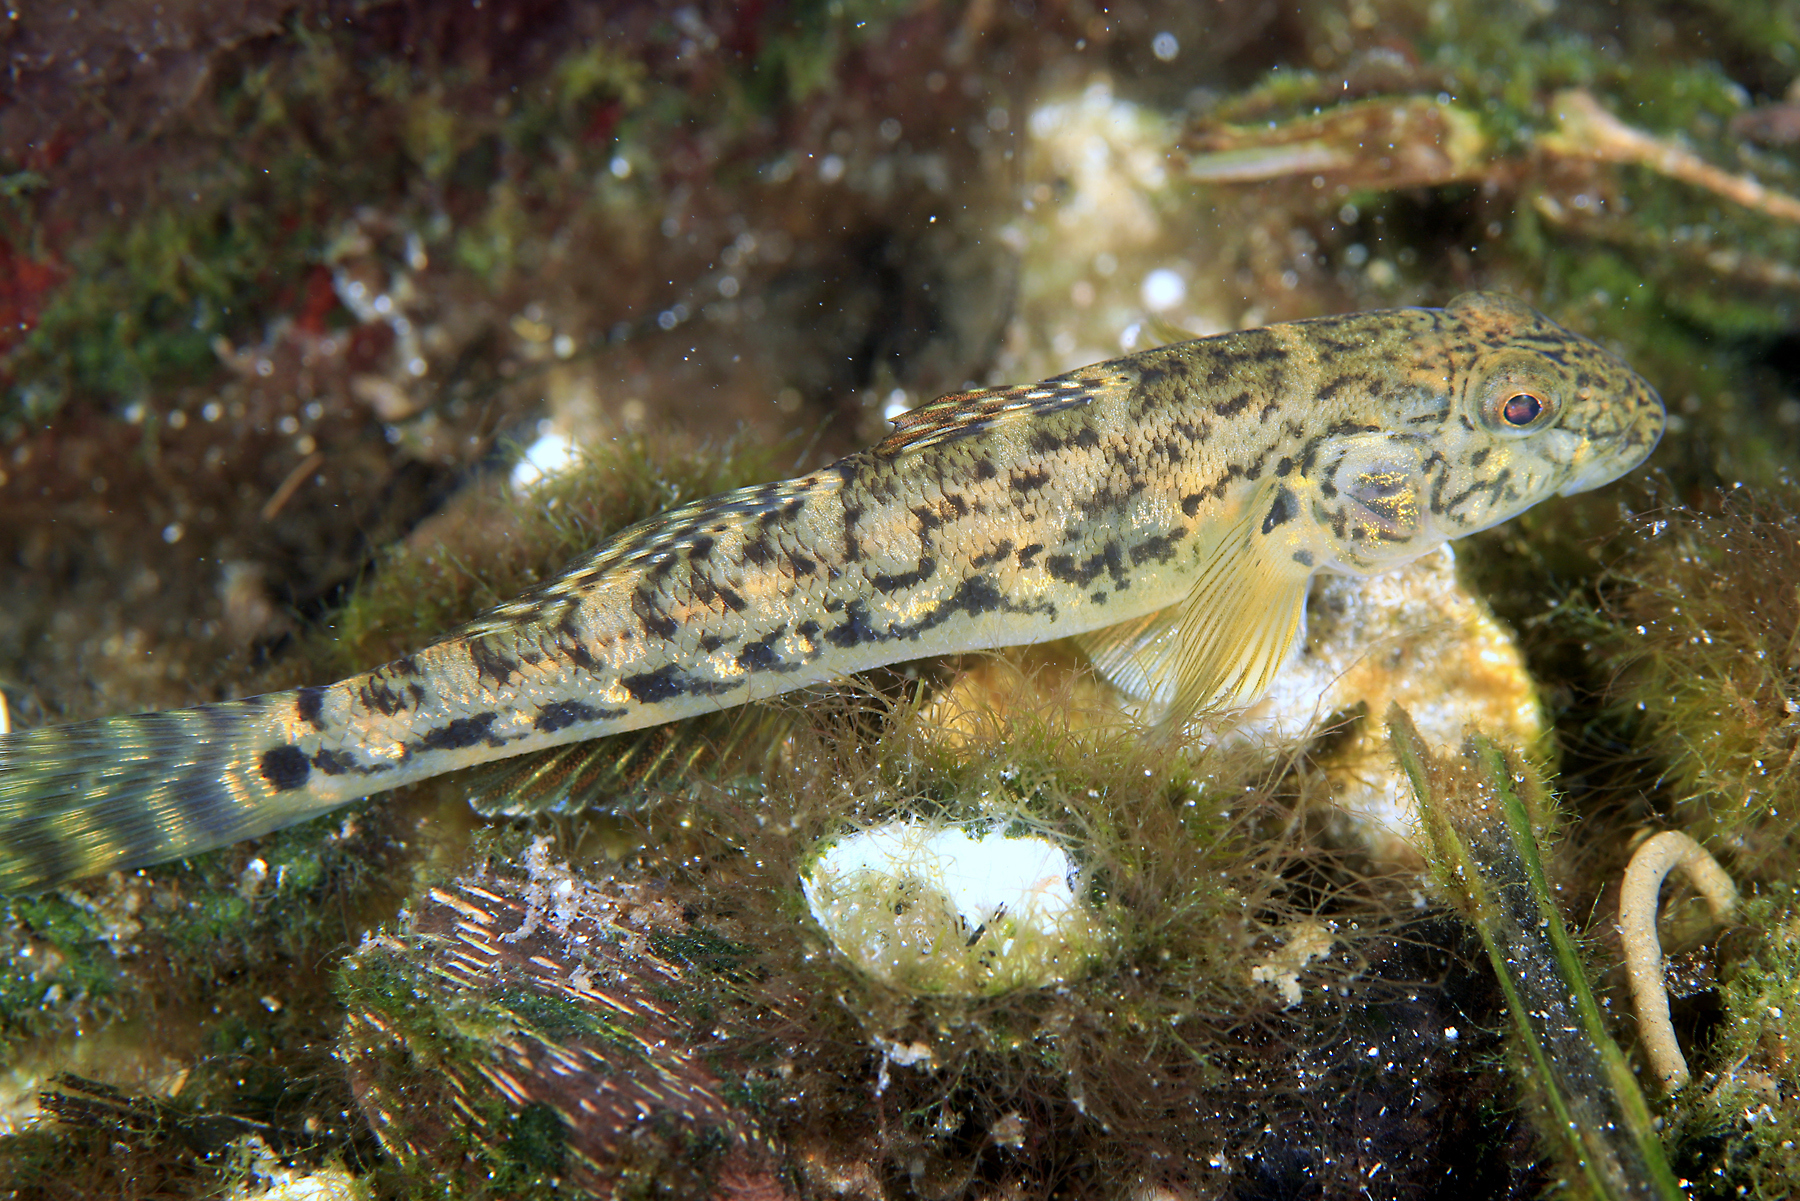
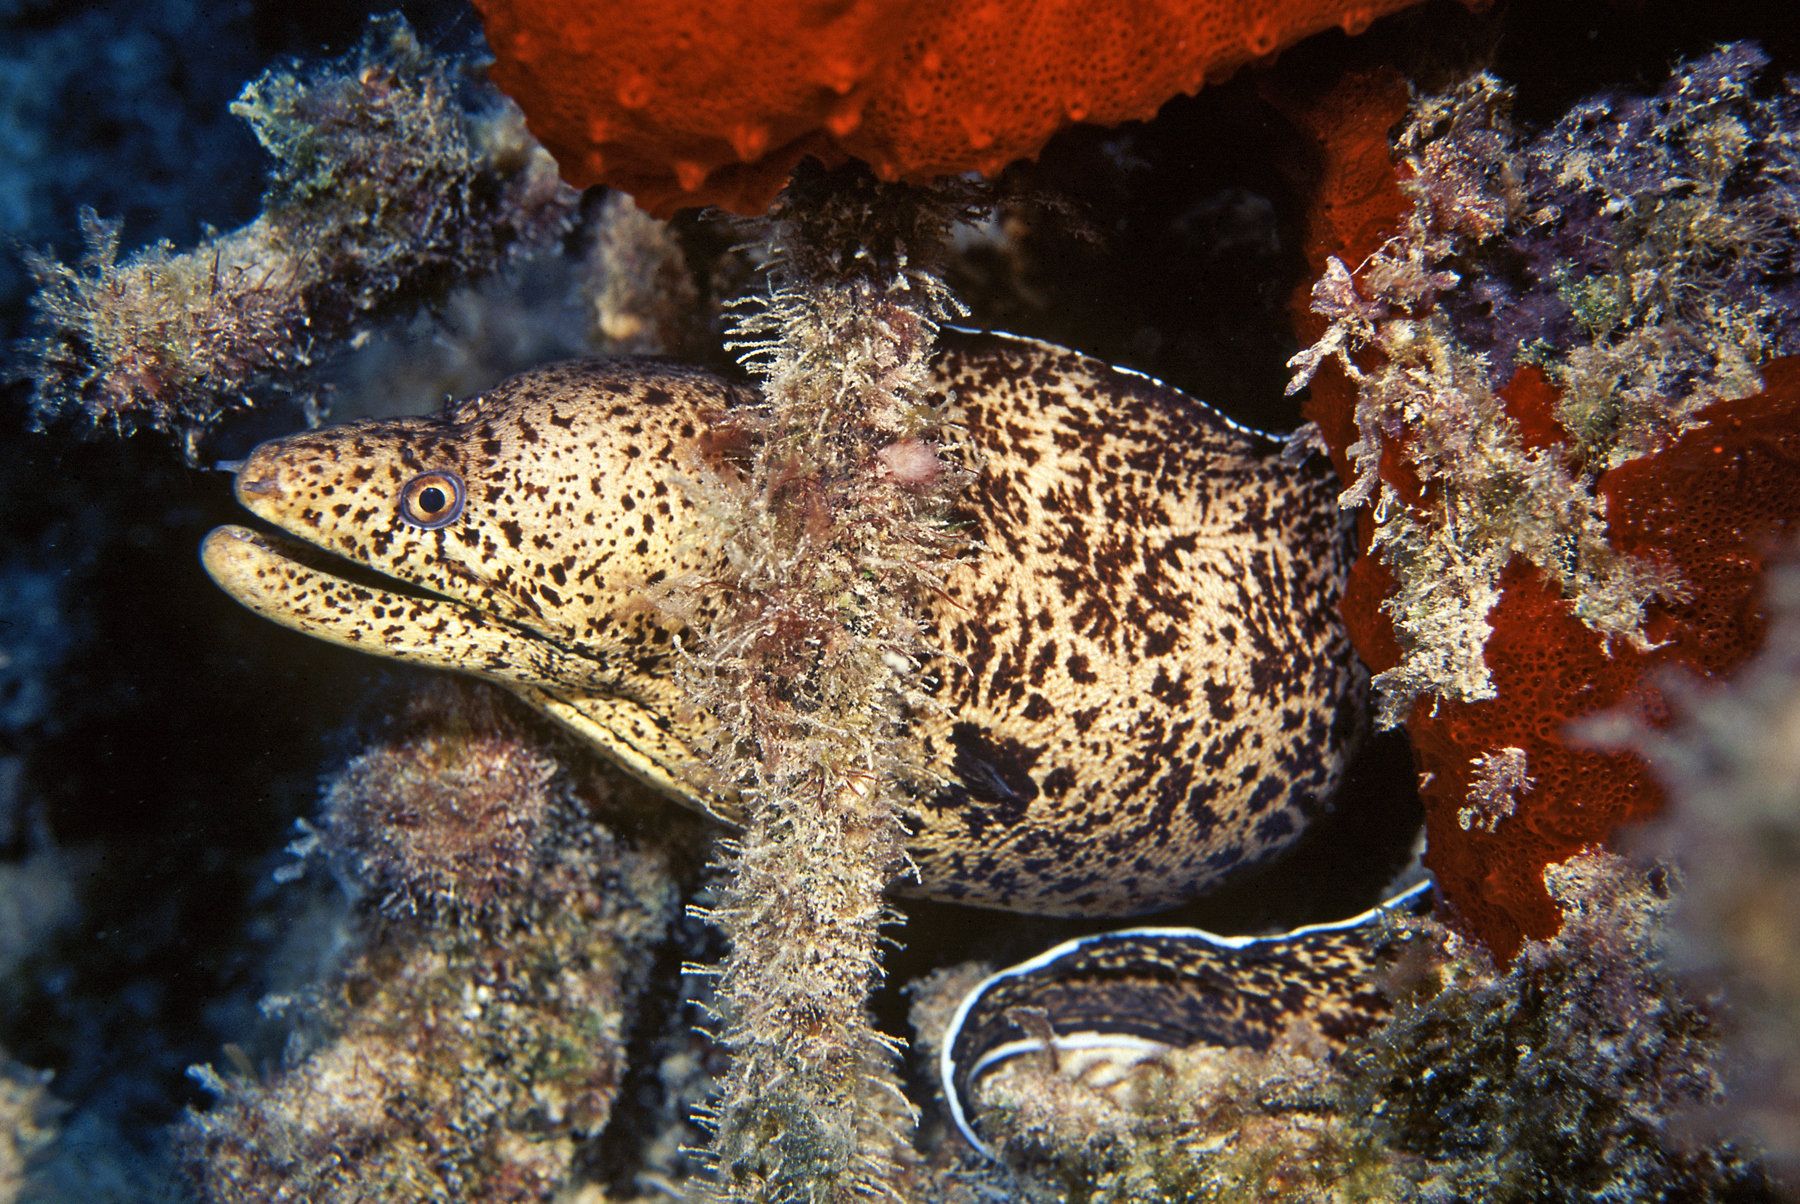
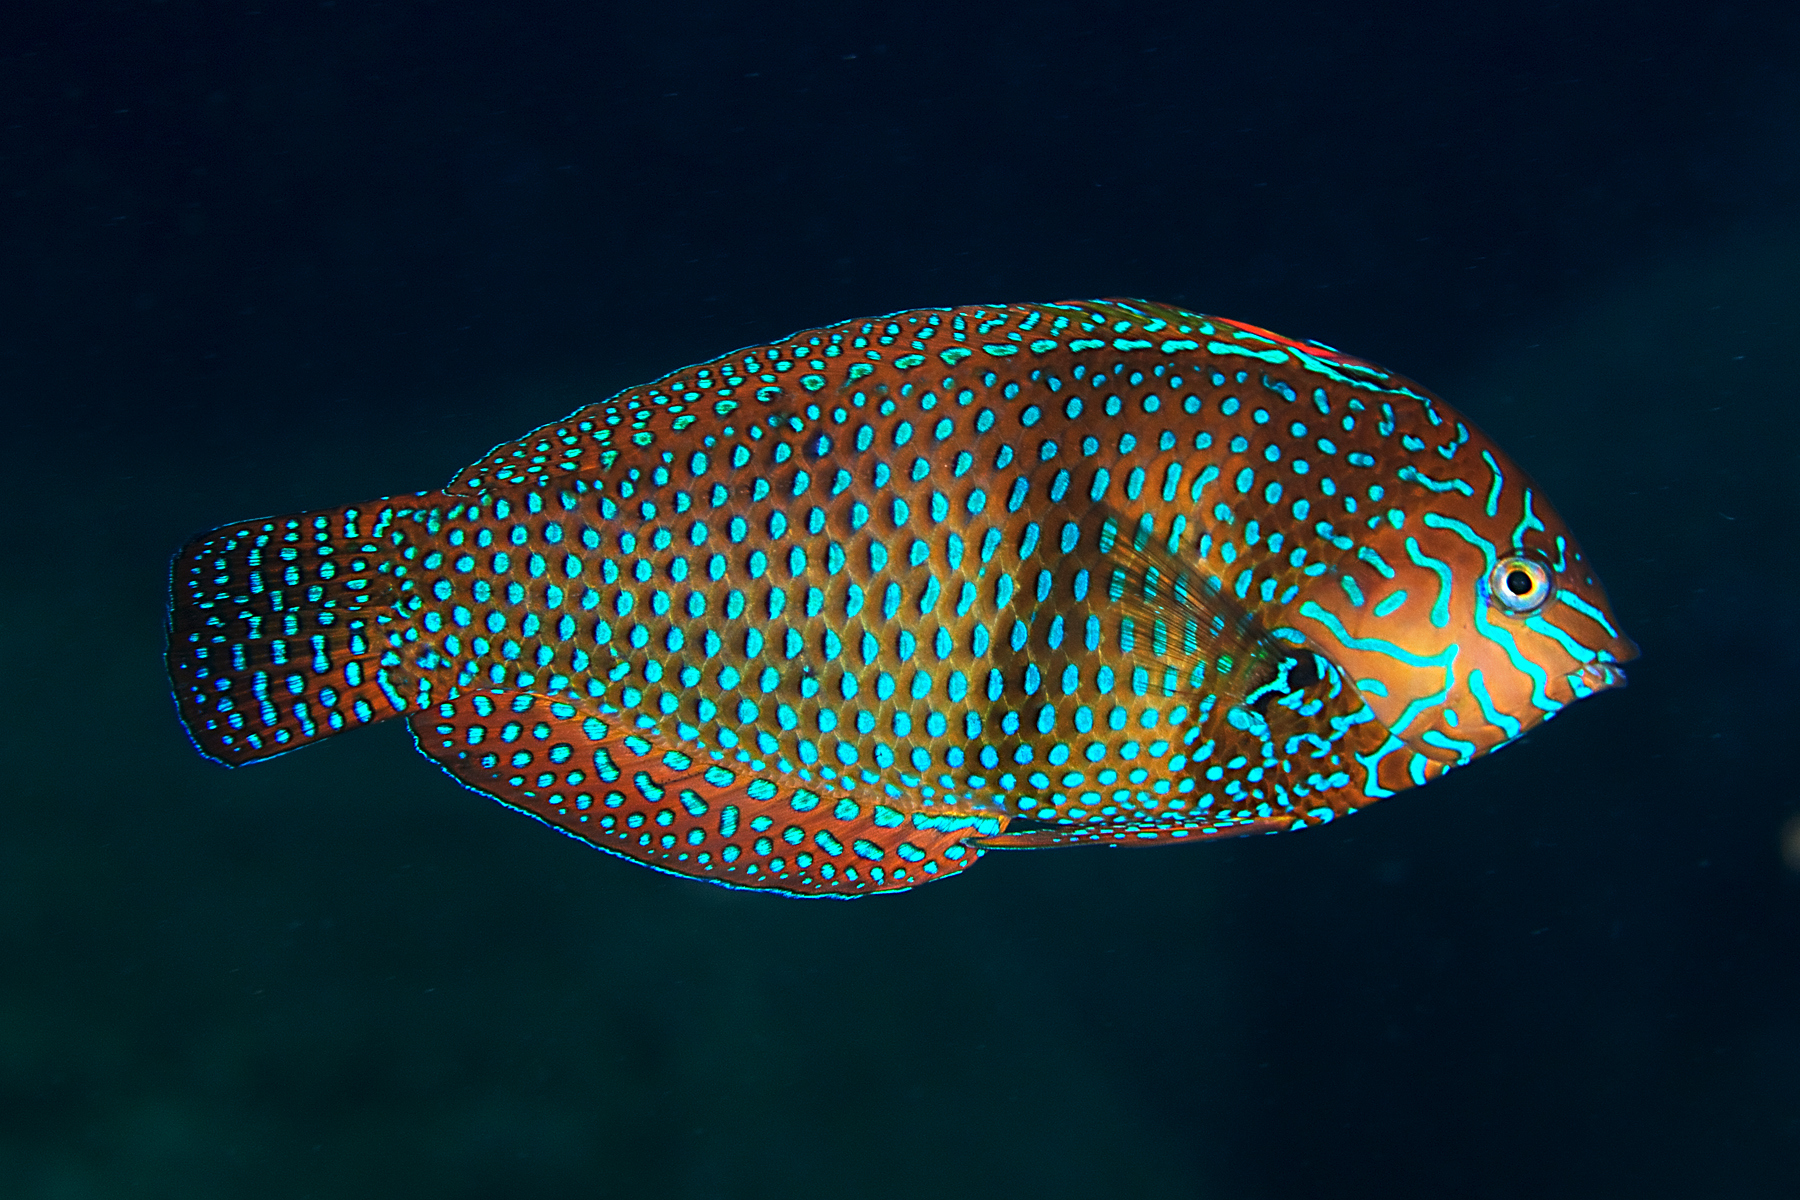
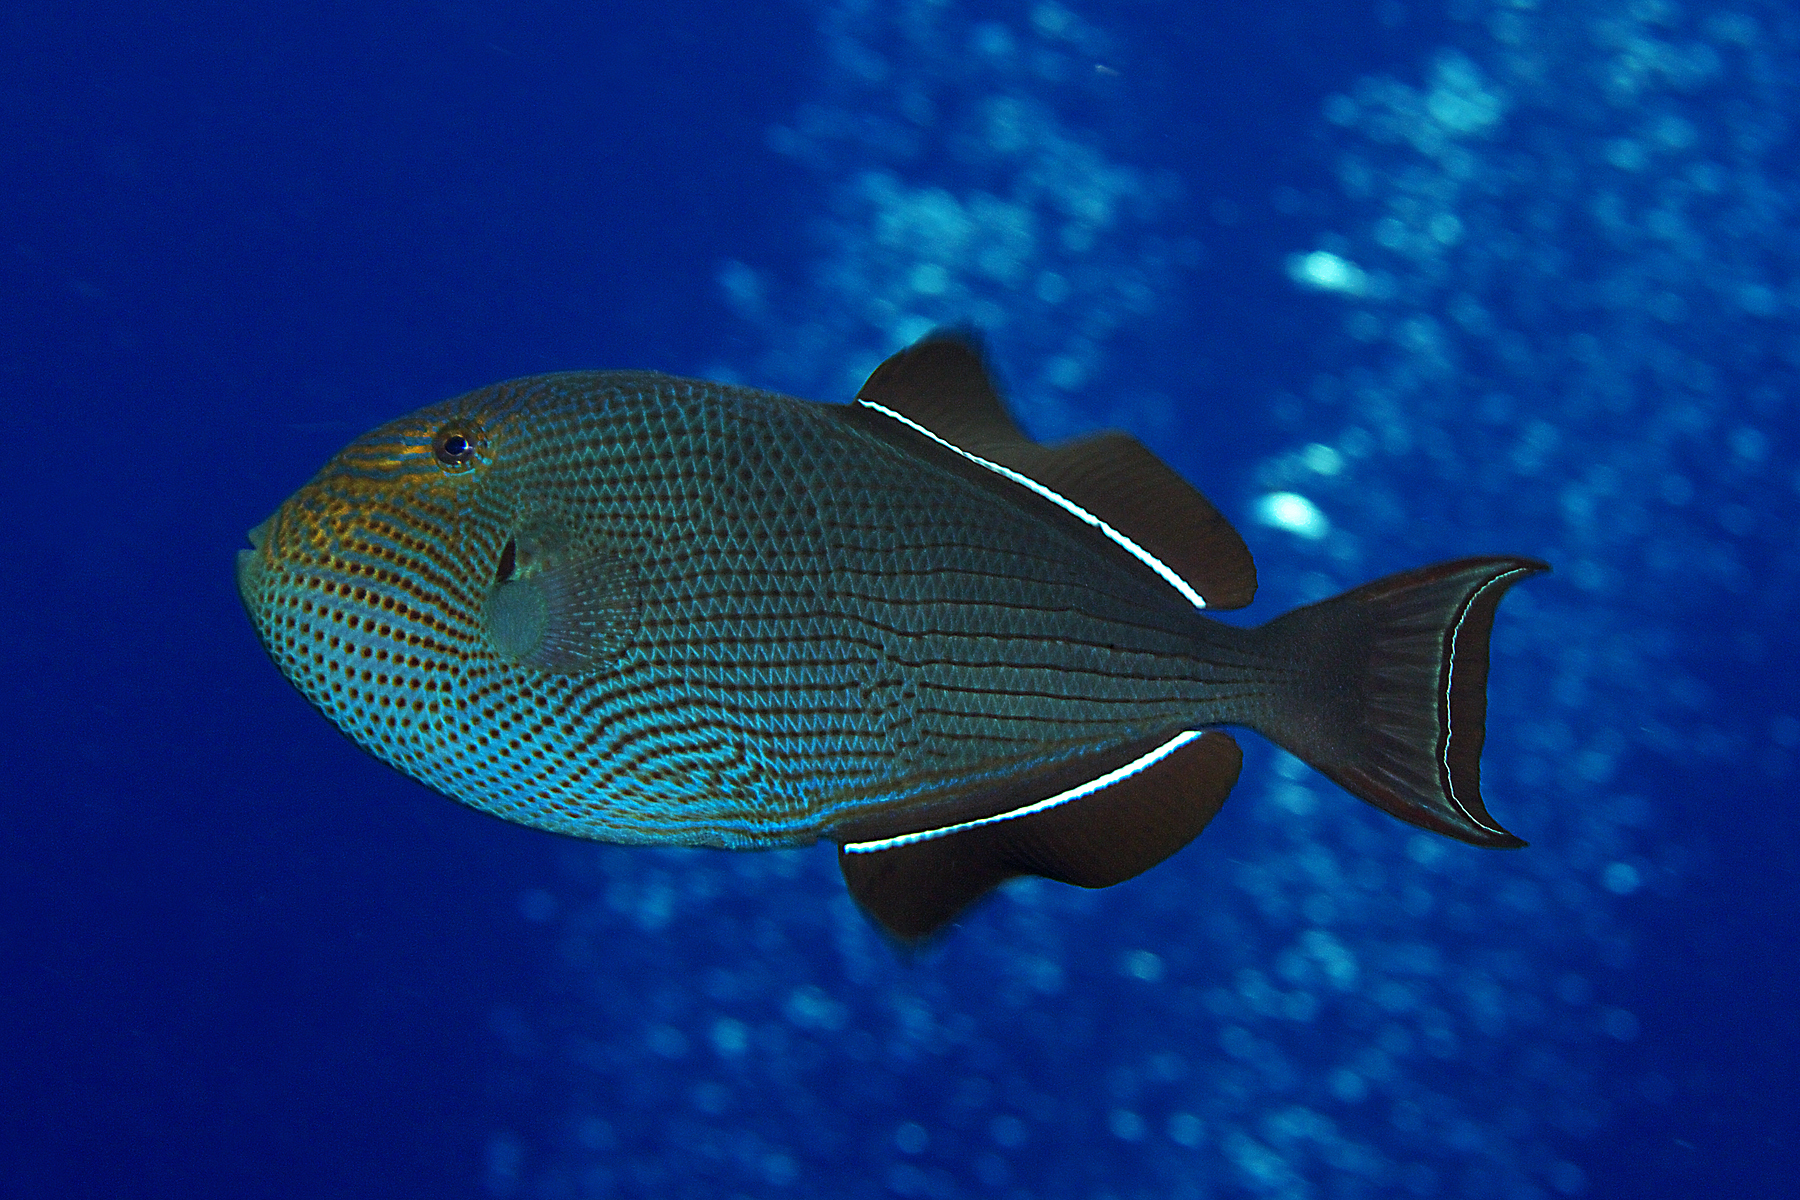
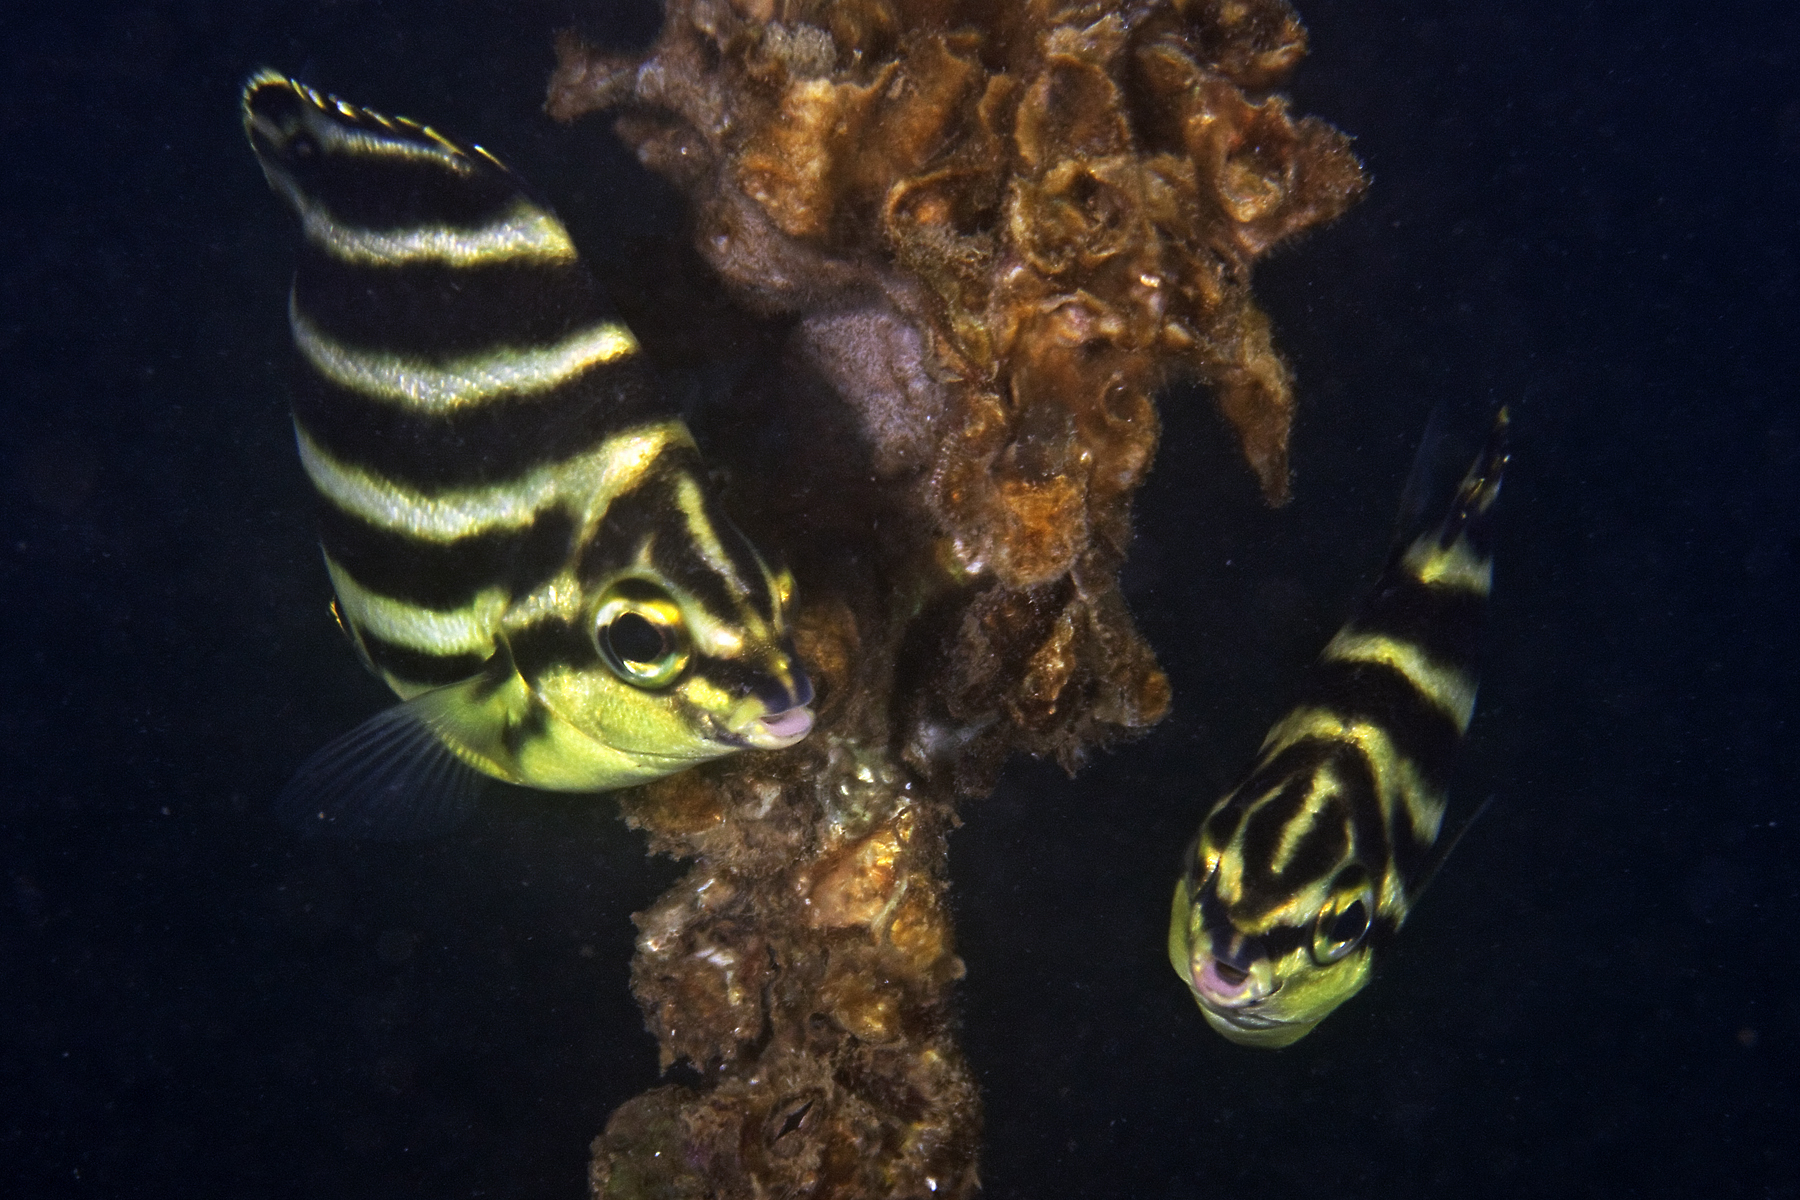
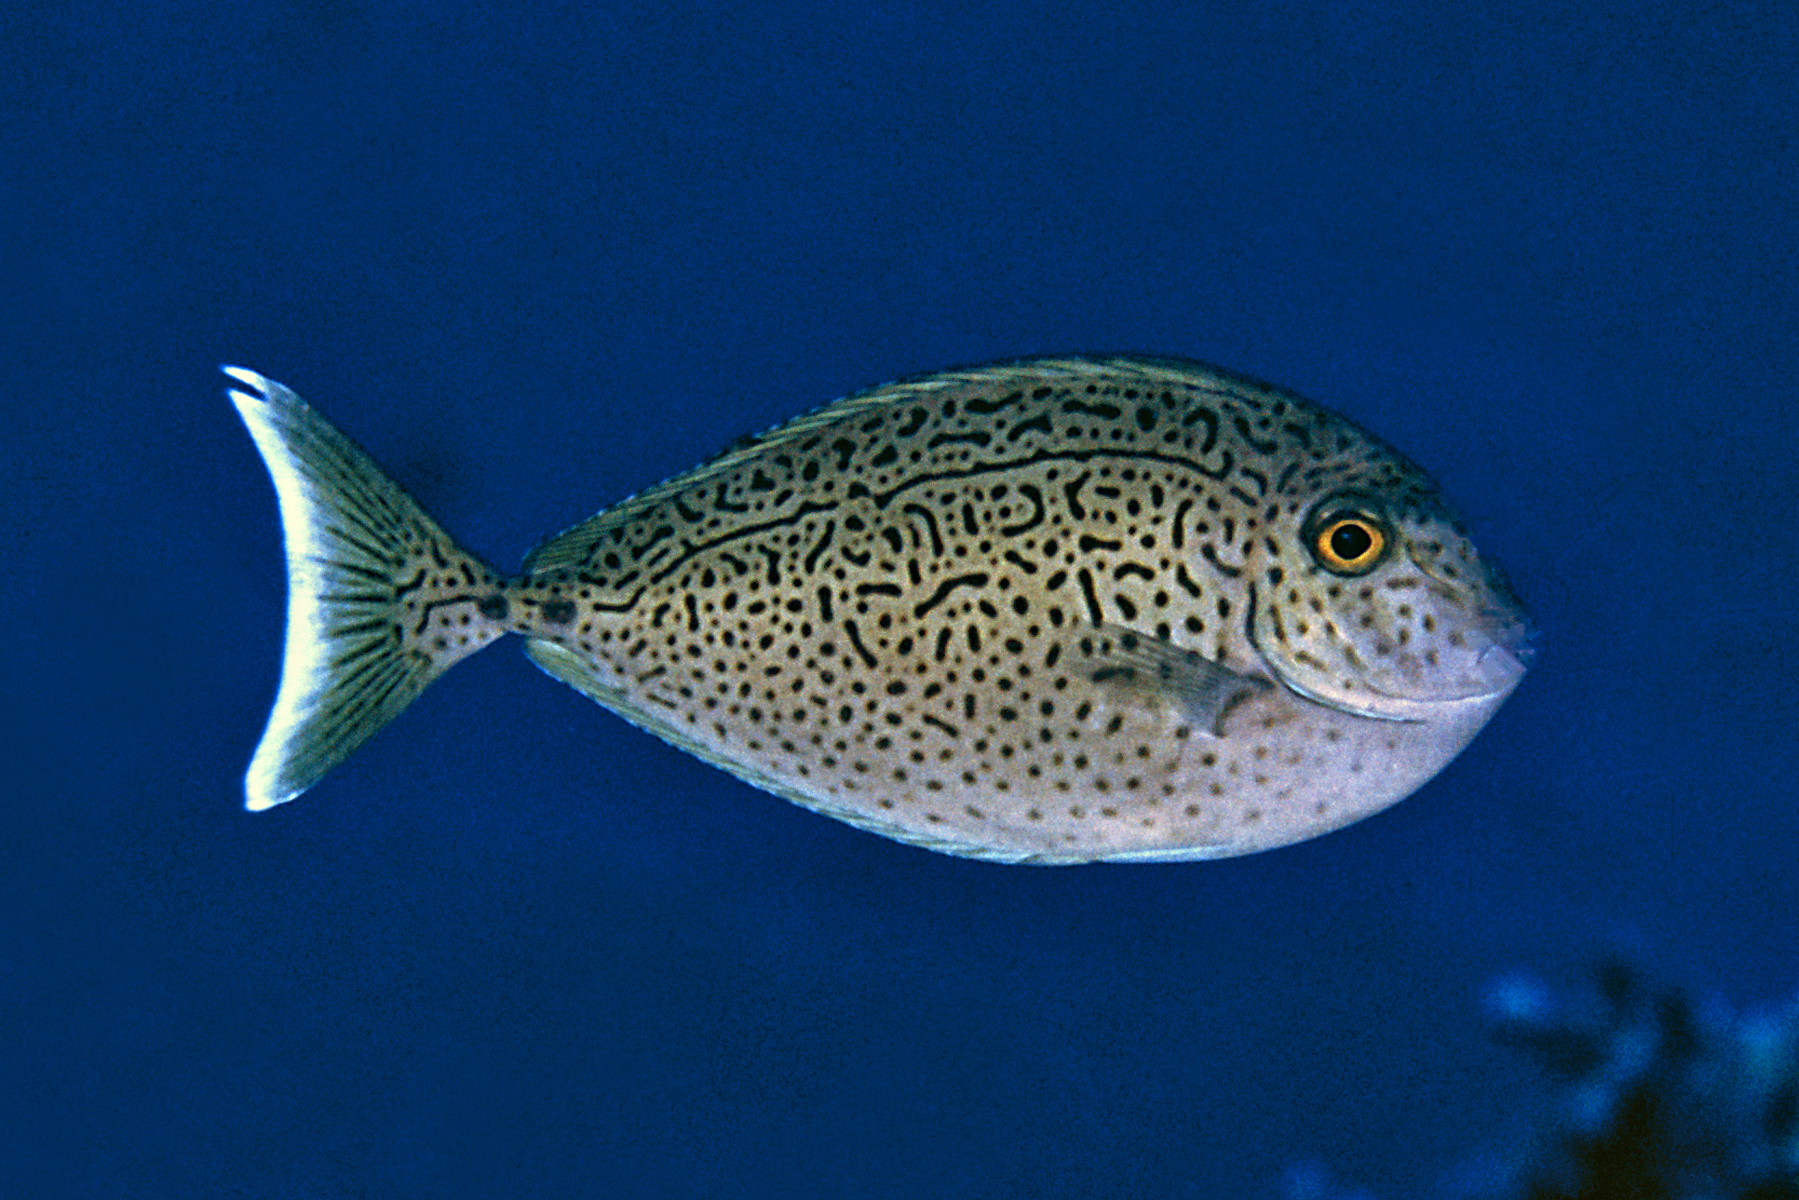
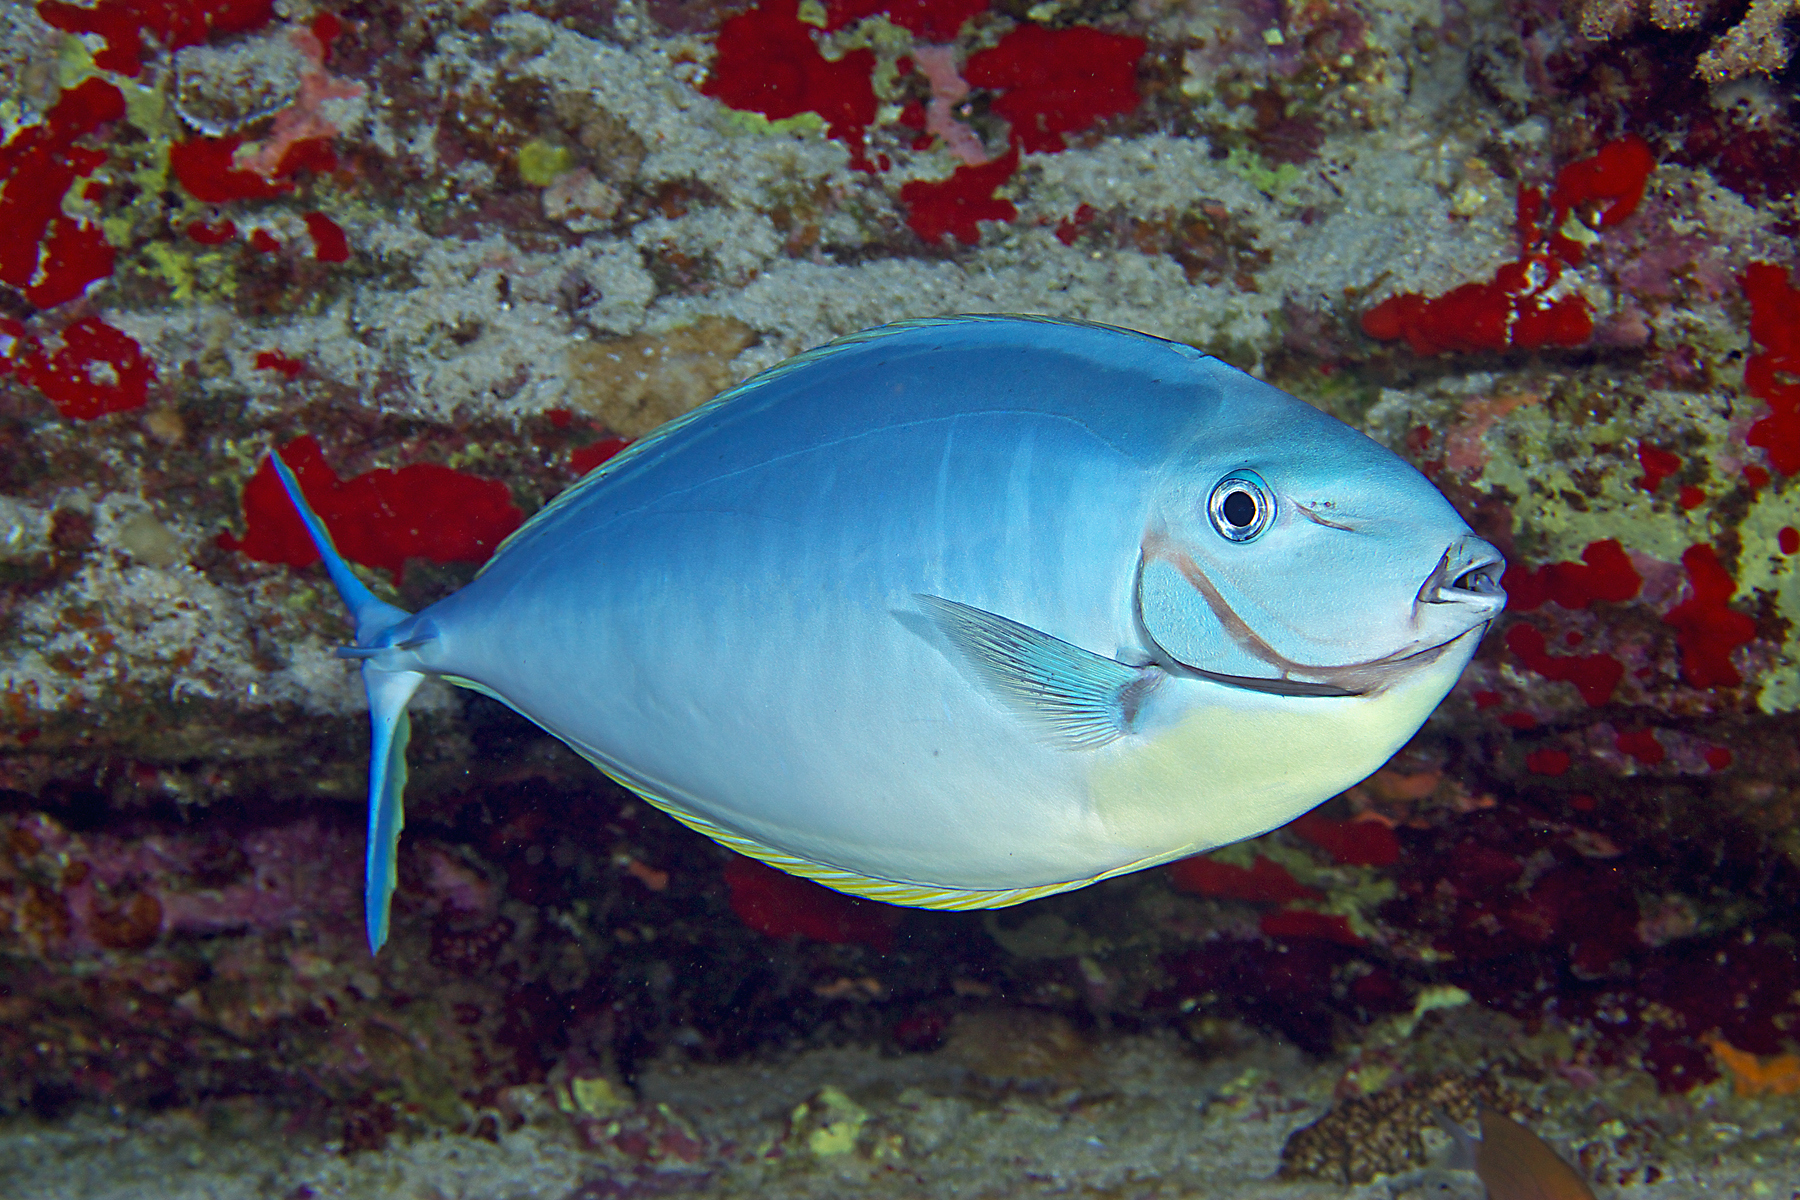
INFECTIOUS FISH ULCERS ARE A GLOBAL PHENOMENOM THAT CAN BE TRACED TO POLLUTION SOURCES LIKE INFECTED WASTEWATER
Learn more by clicking on the resources below:
-
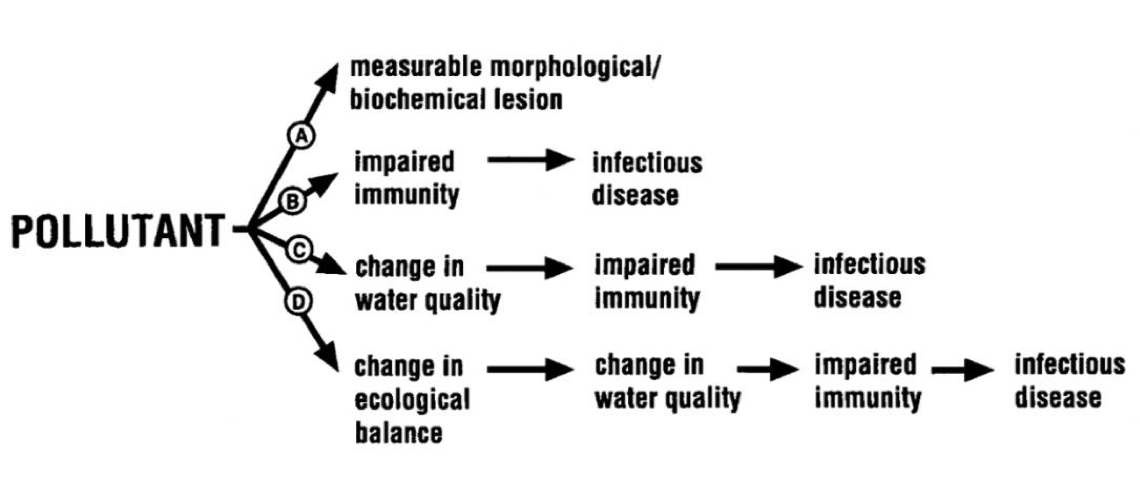
POLLUTION LOADING LEADS TO INFECTIOUS FISH ULCERS BY WAY OF SEVERAL VECTORS
-
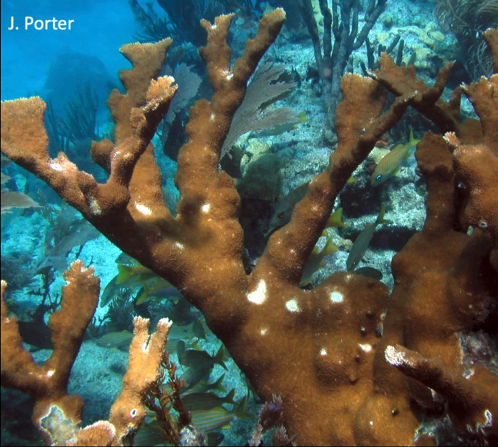
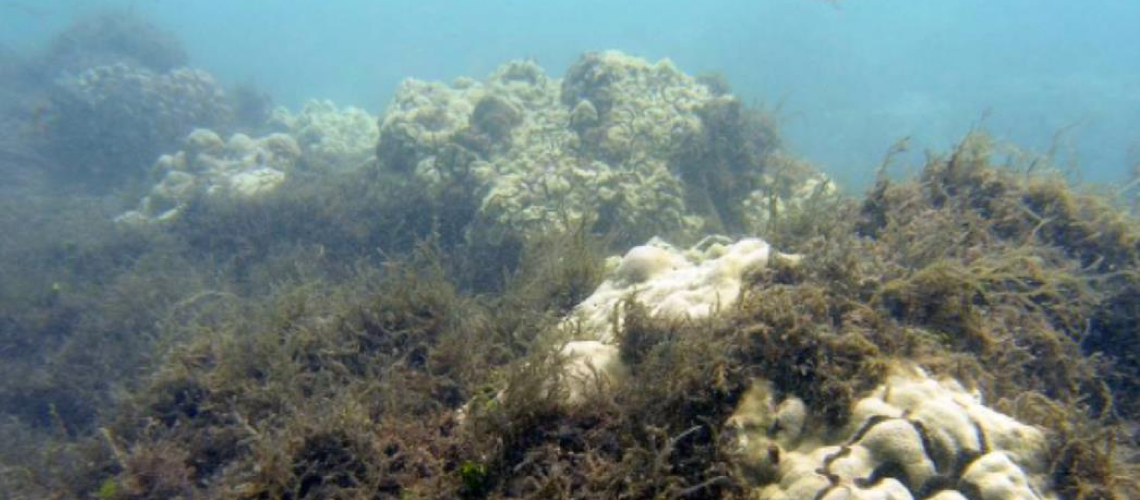
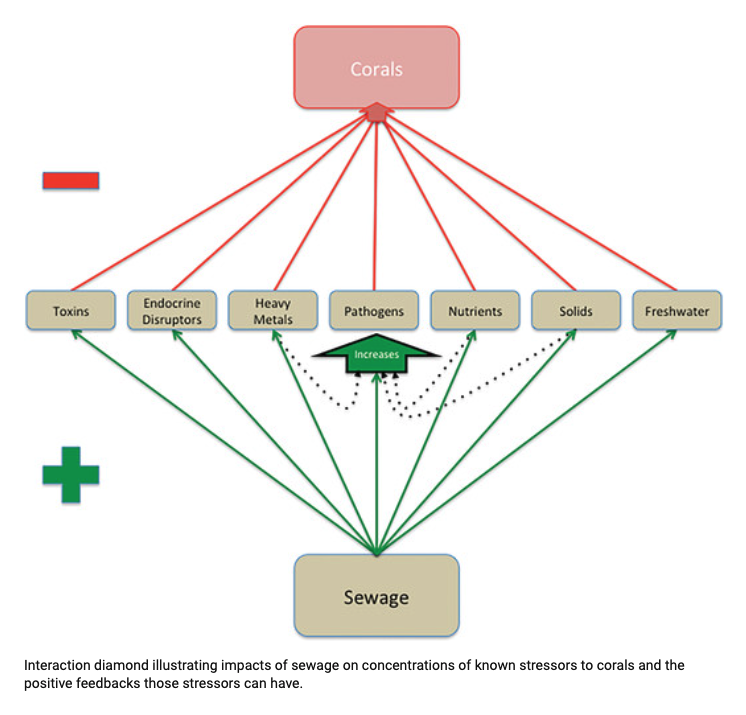
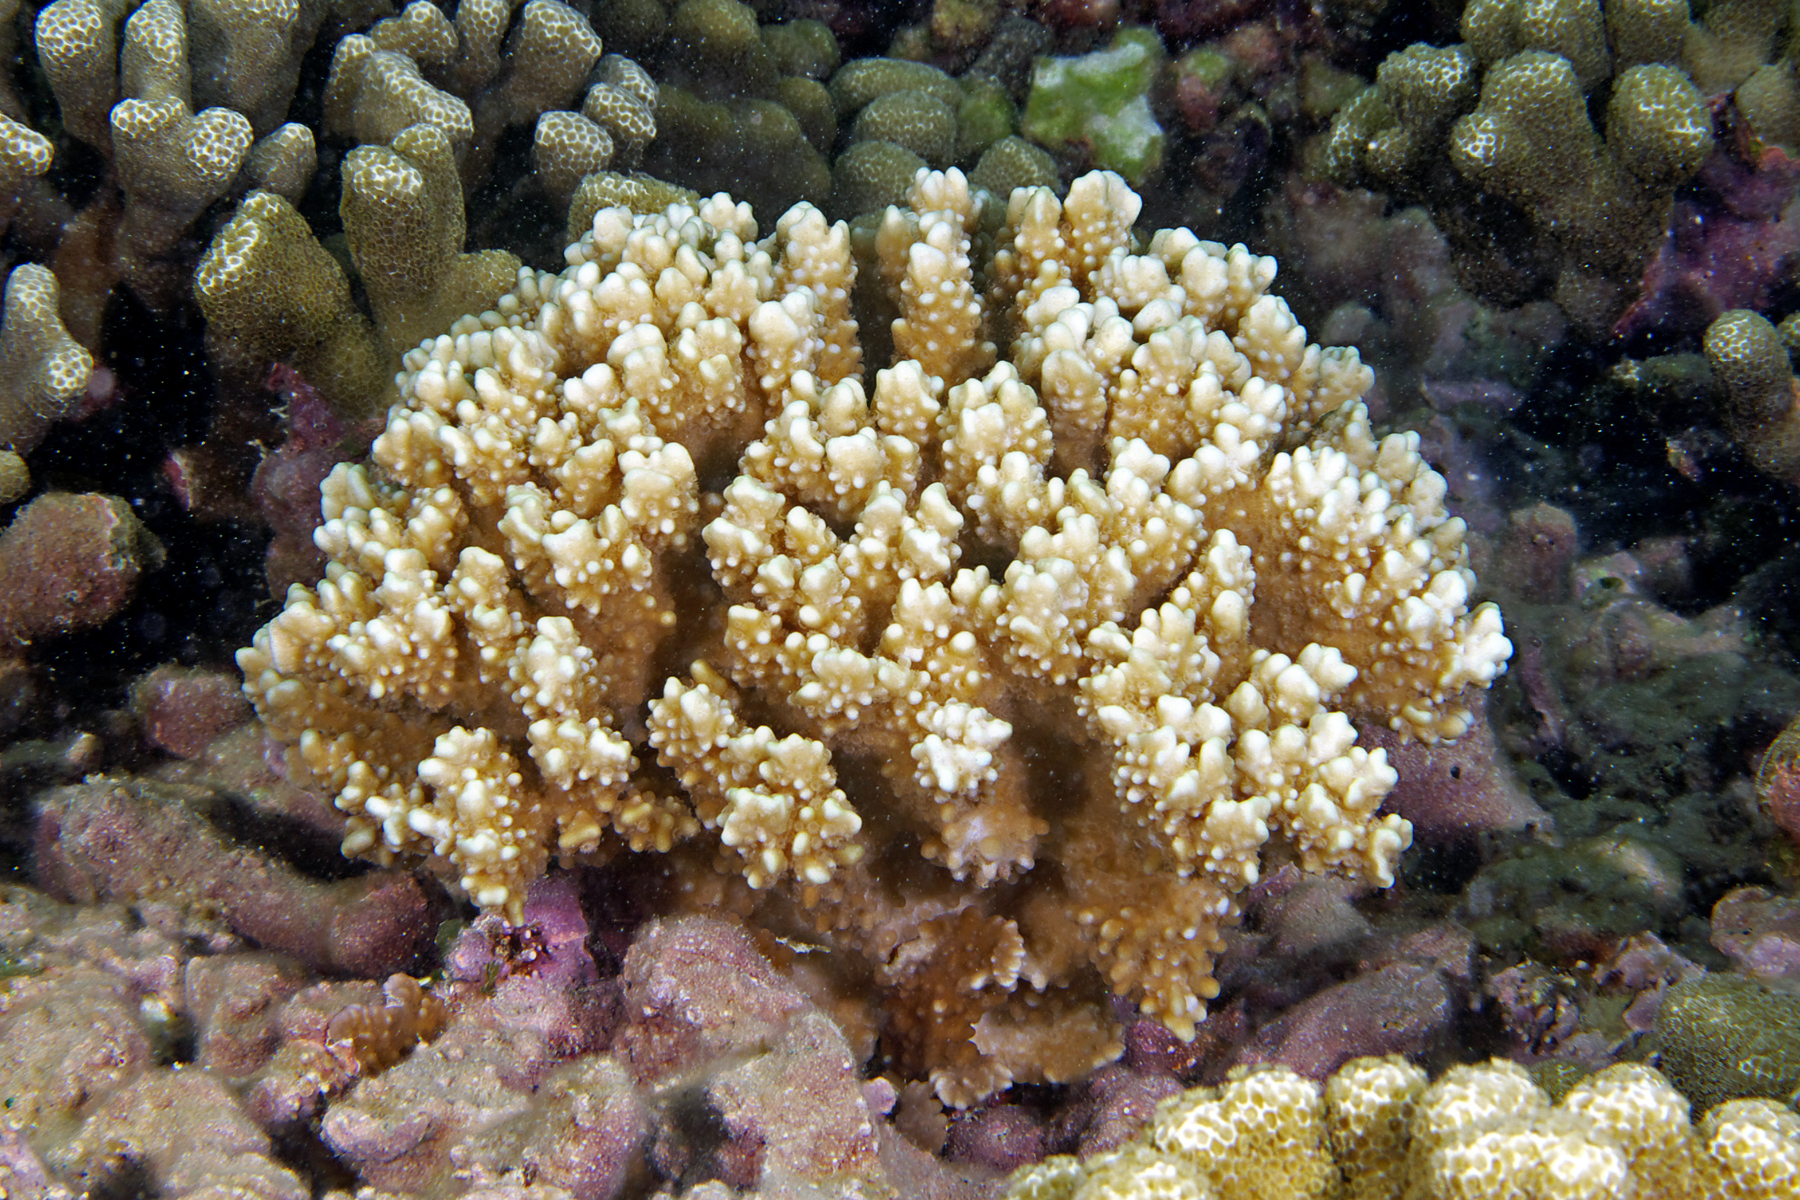
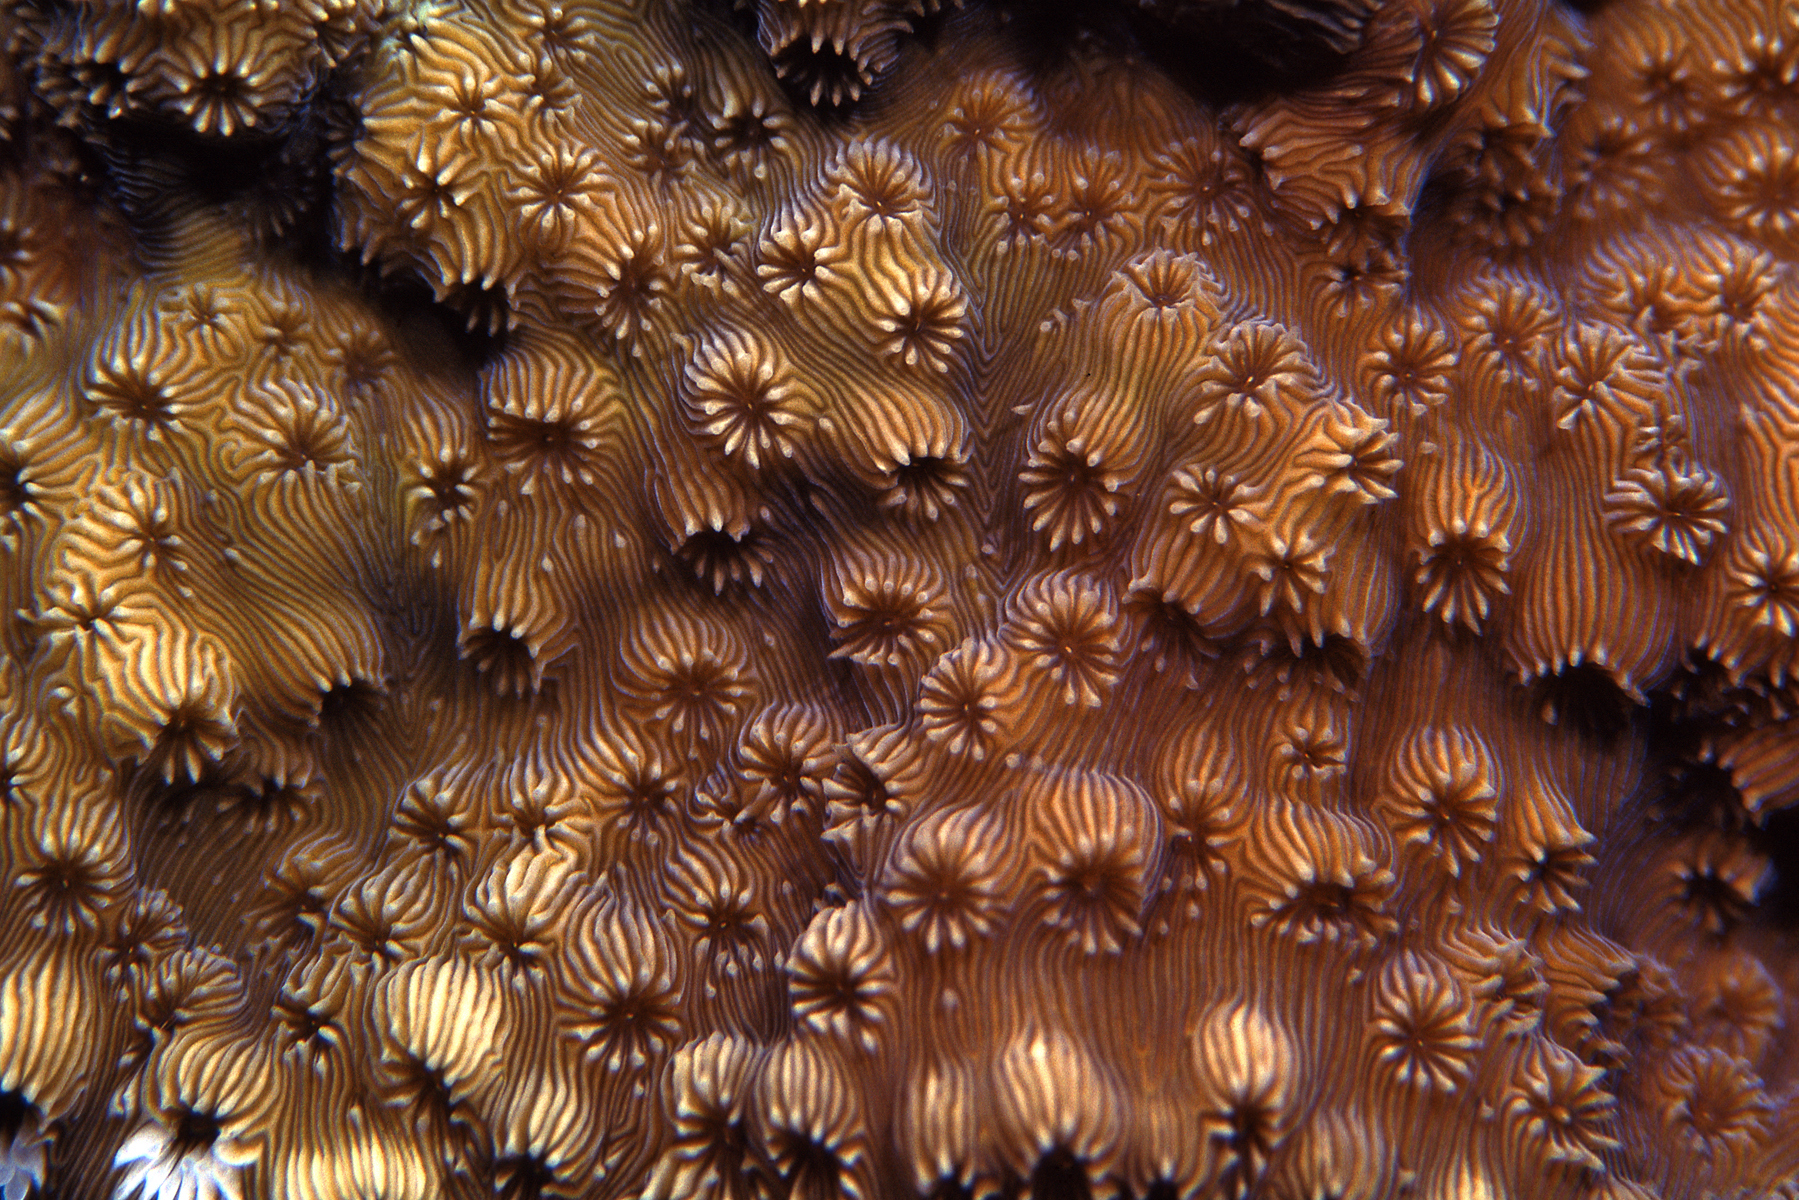
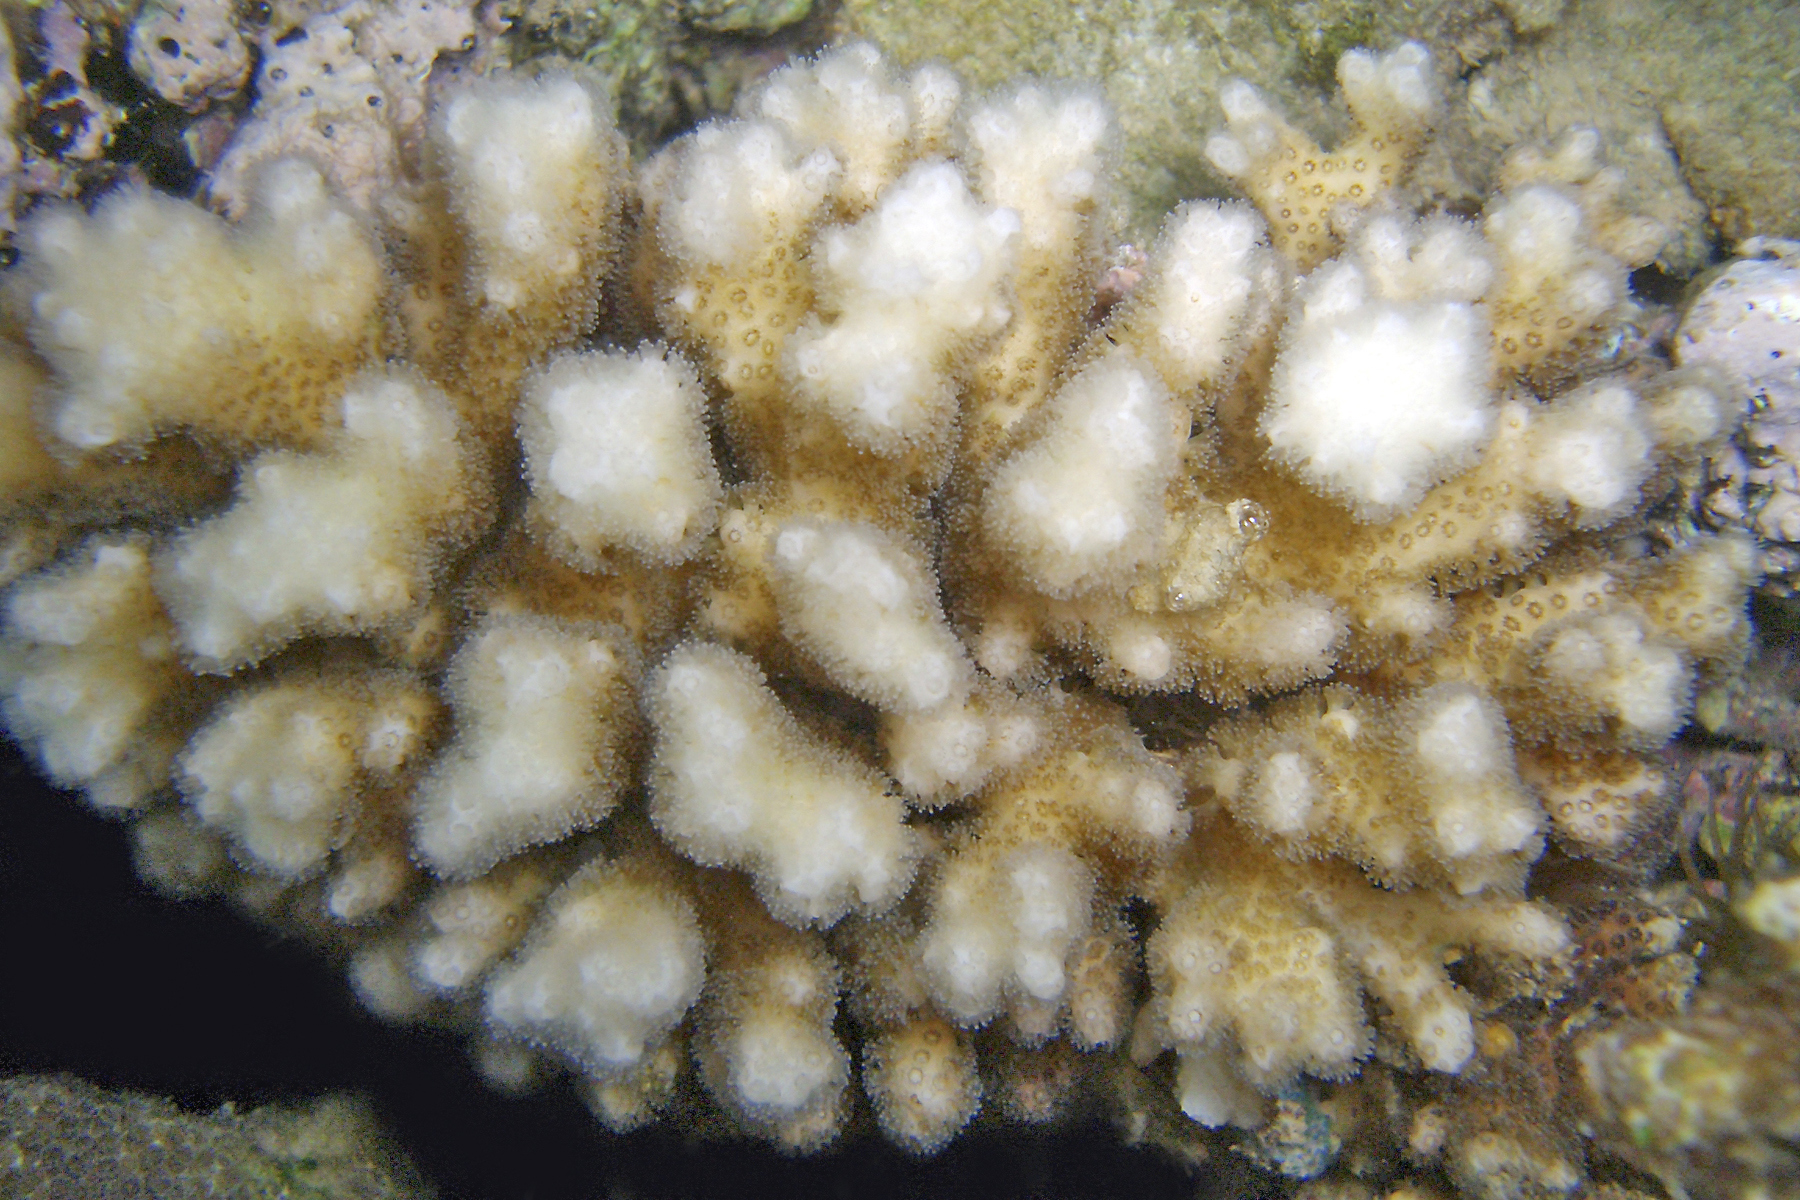
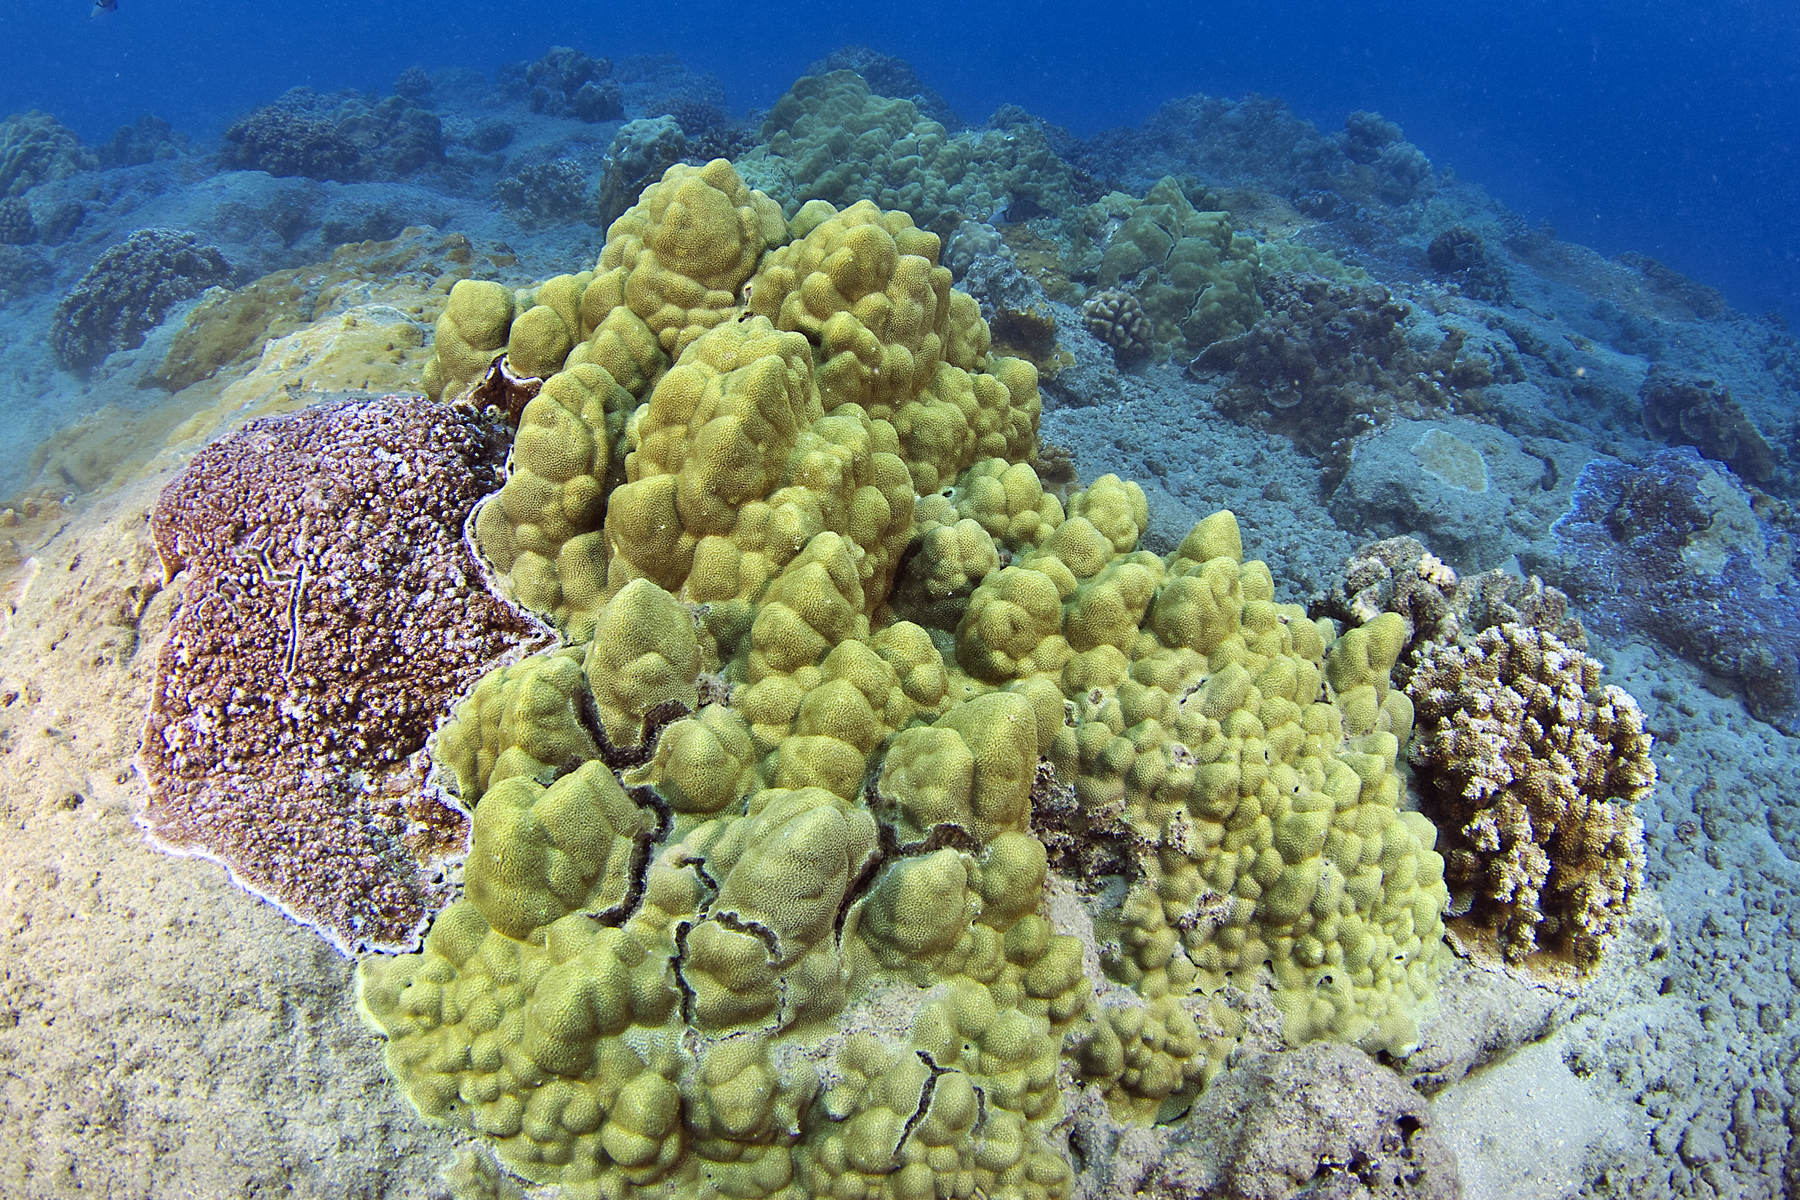
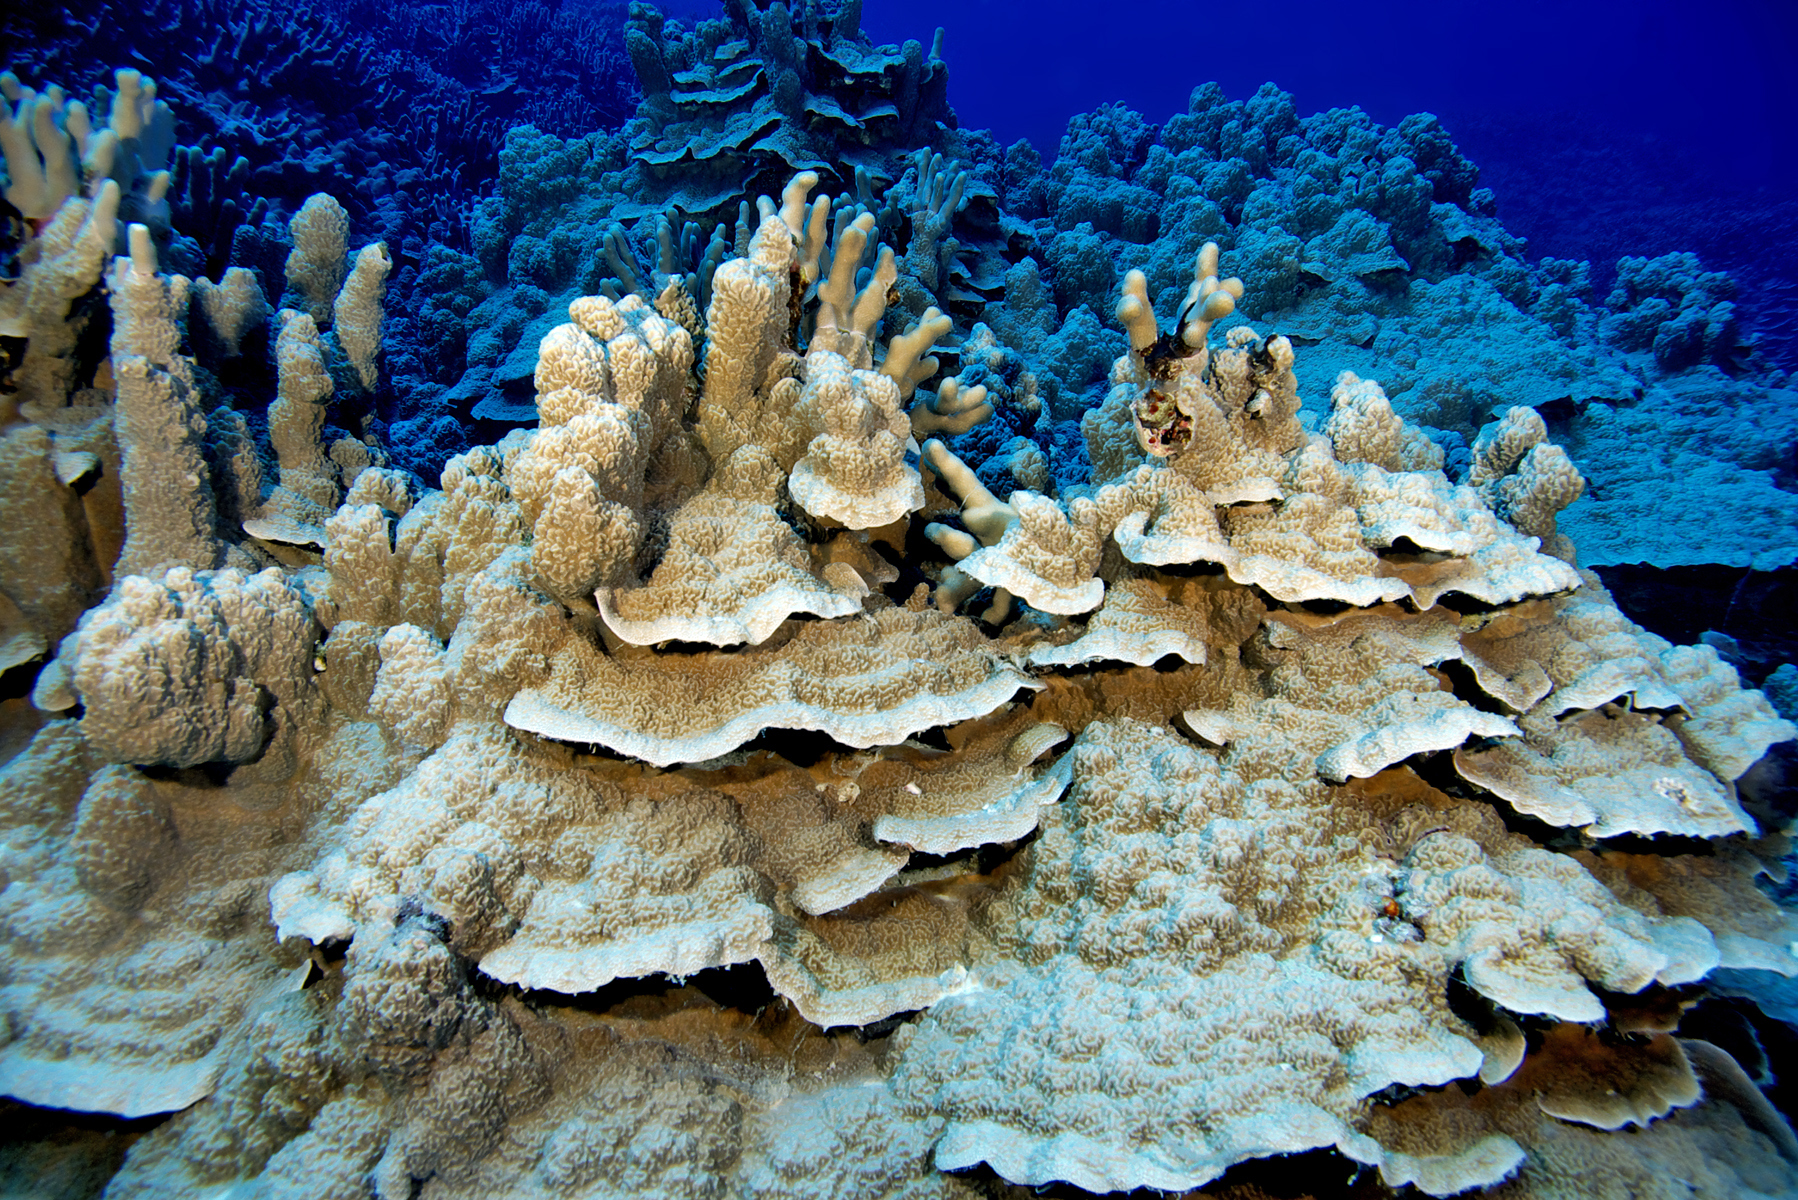
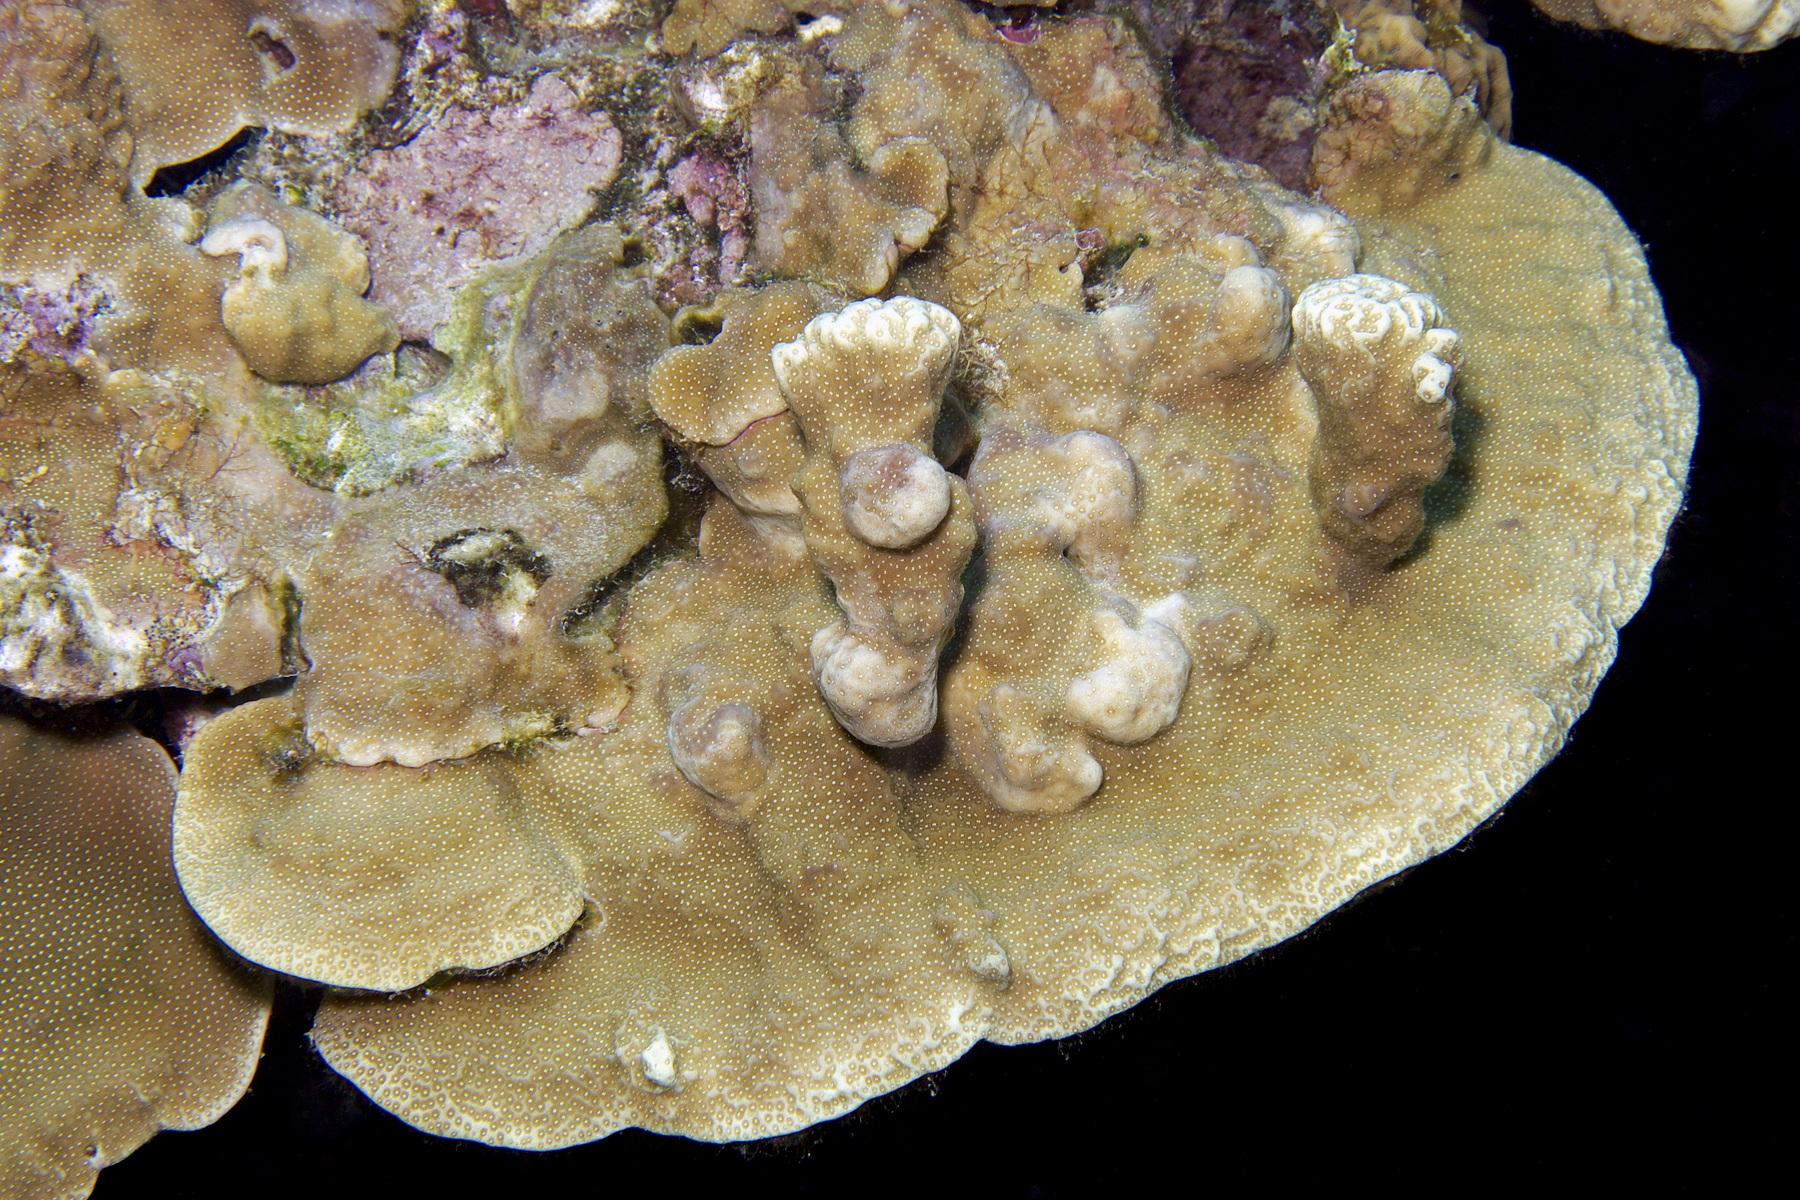
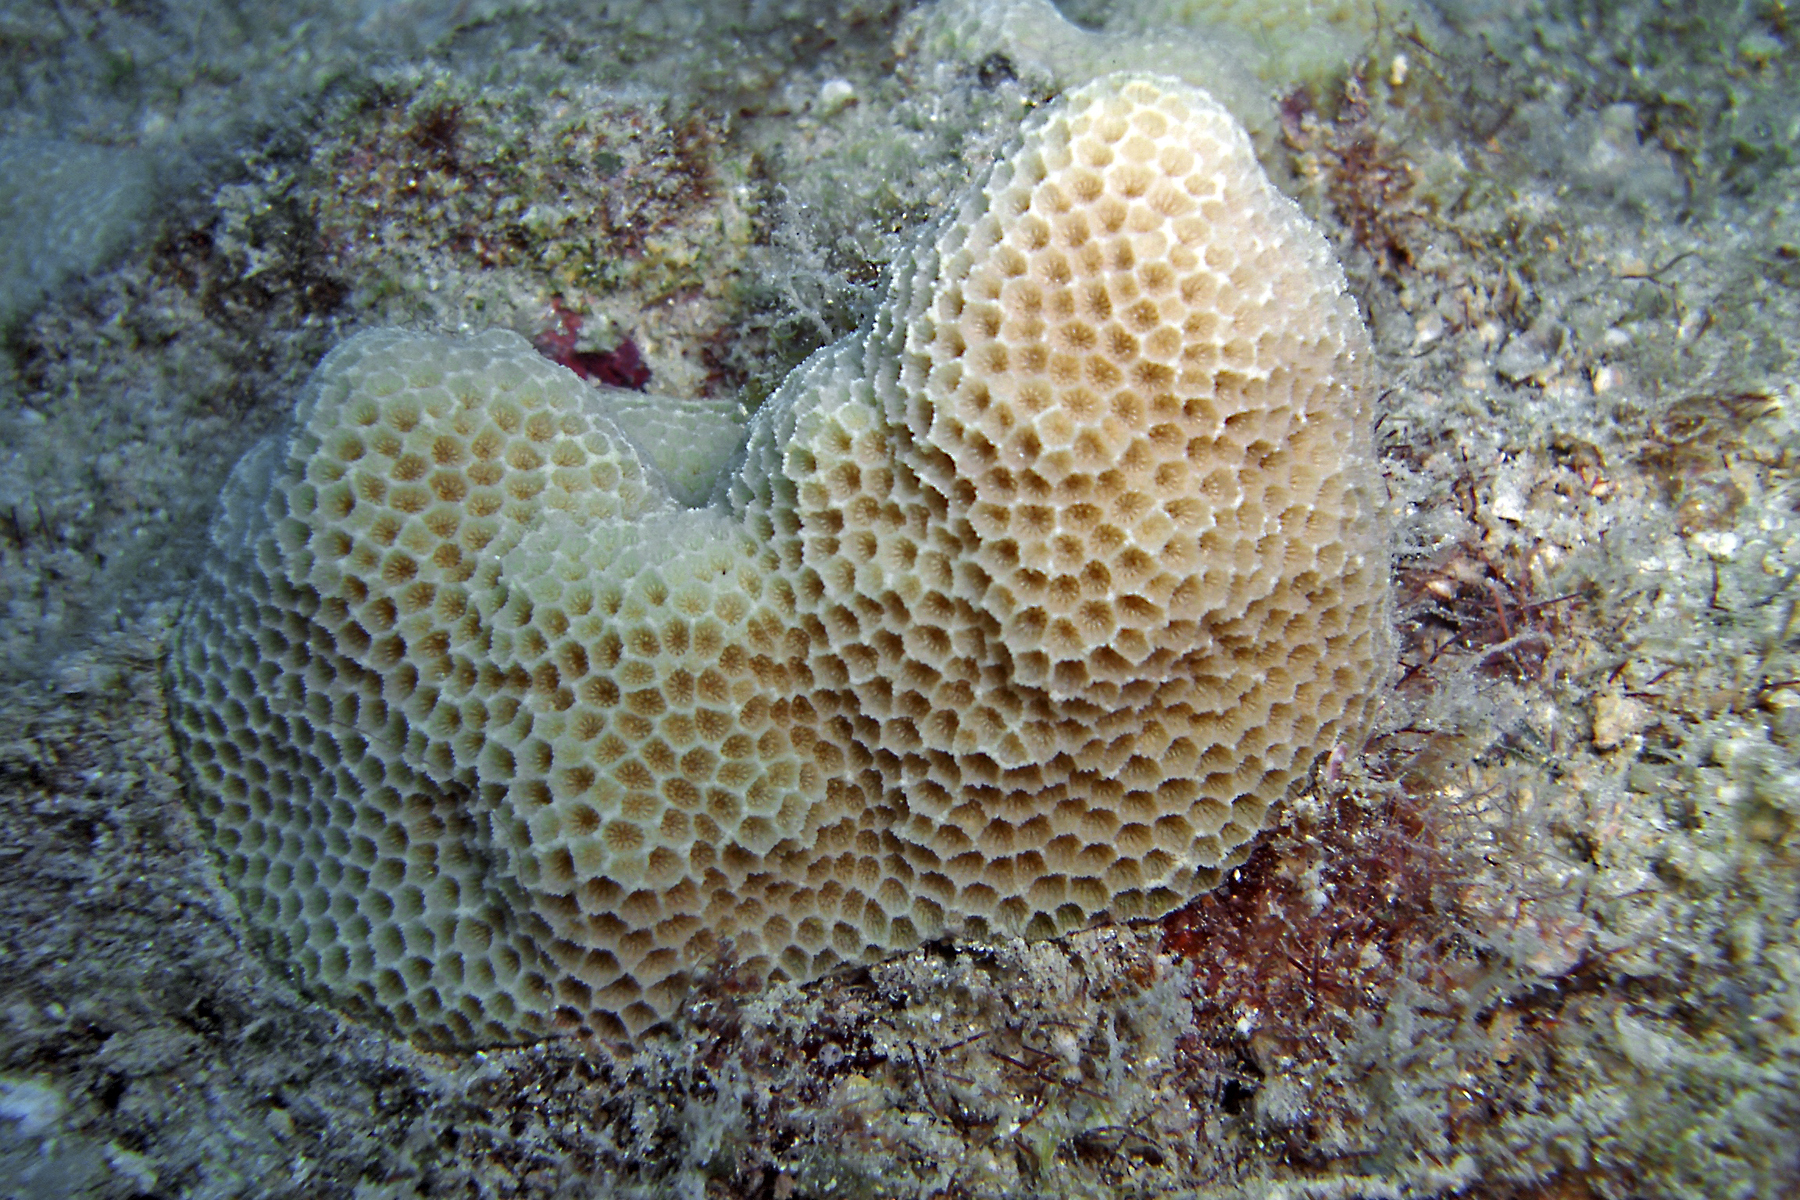
THE CORAL ITSELF IS AFFECTED BY LAND-BASED POLLUTION
Human sewage identified as likely source of white pox disease of the threatened Caribbean elkhorn coral, Acropora palmata
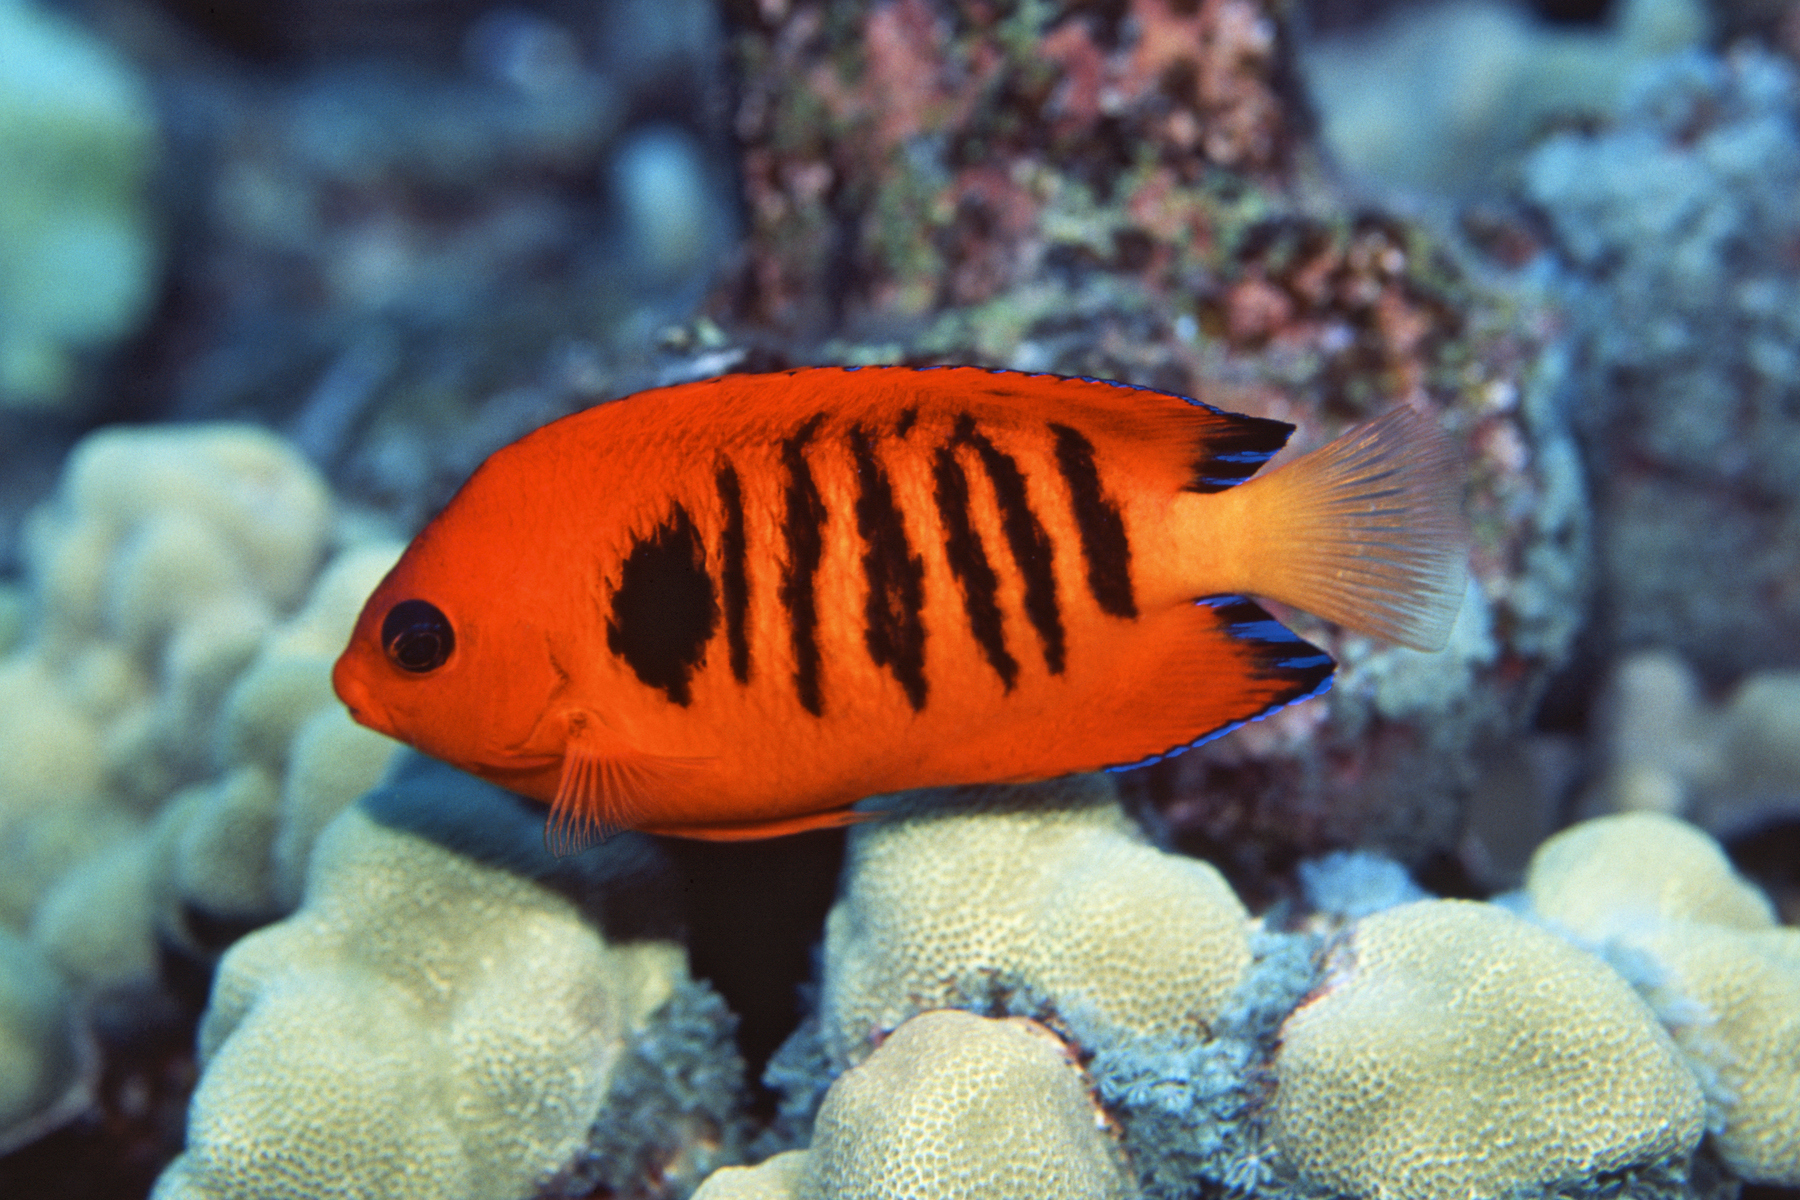
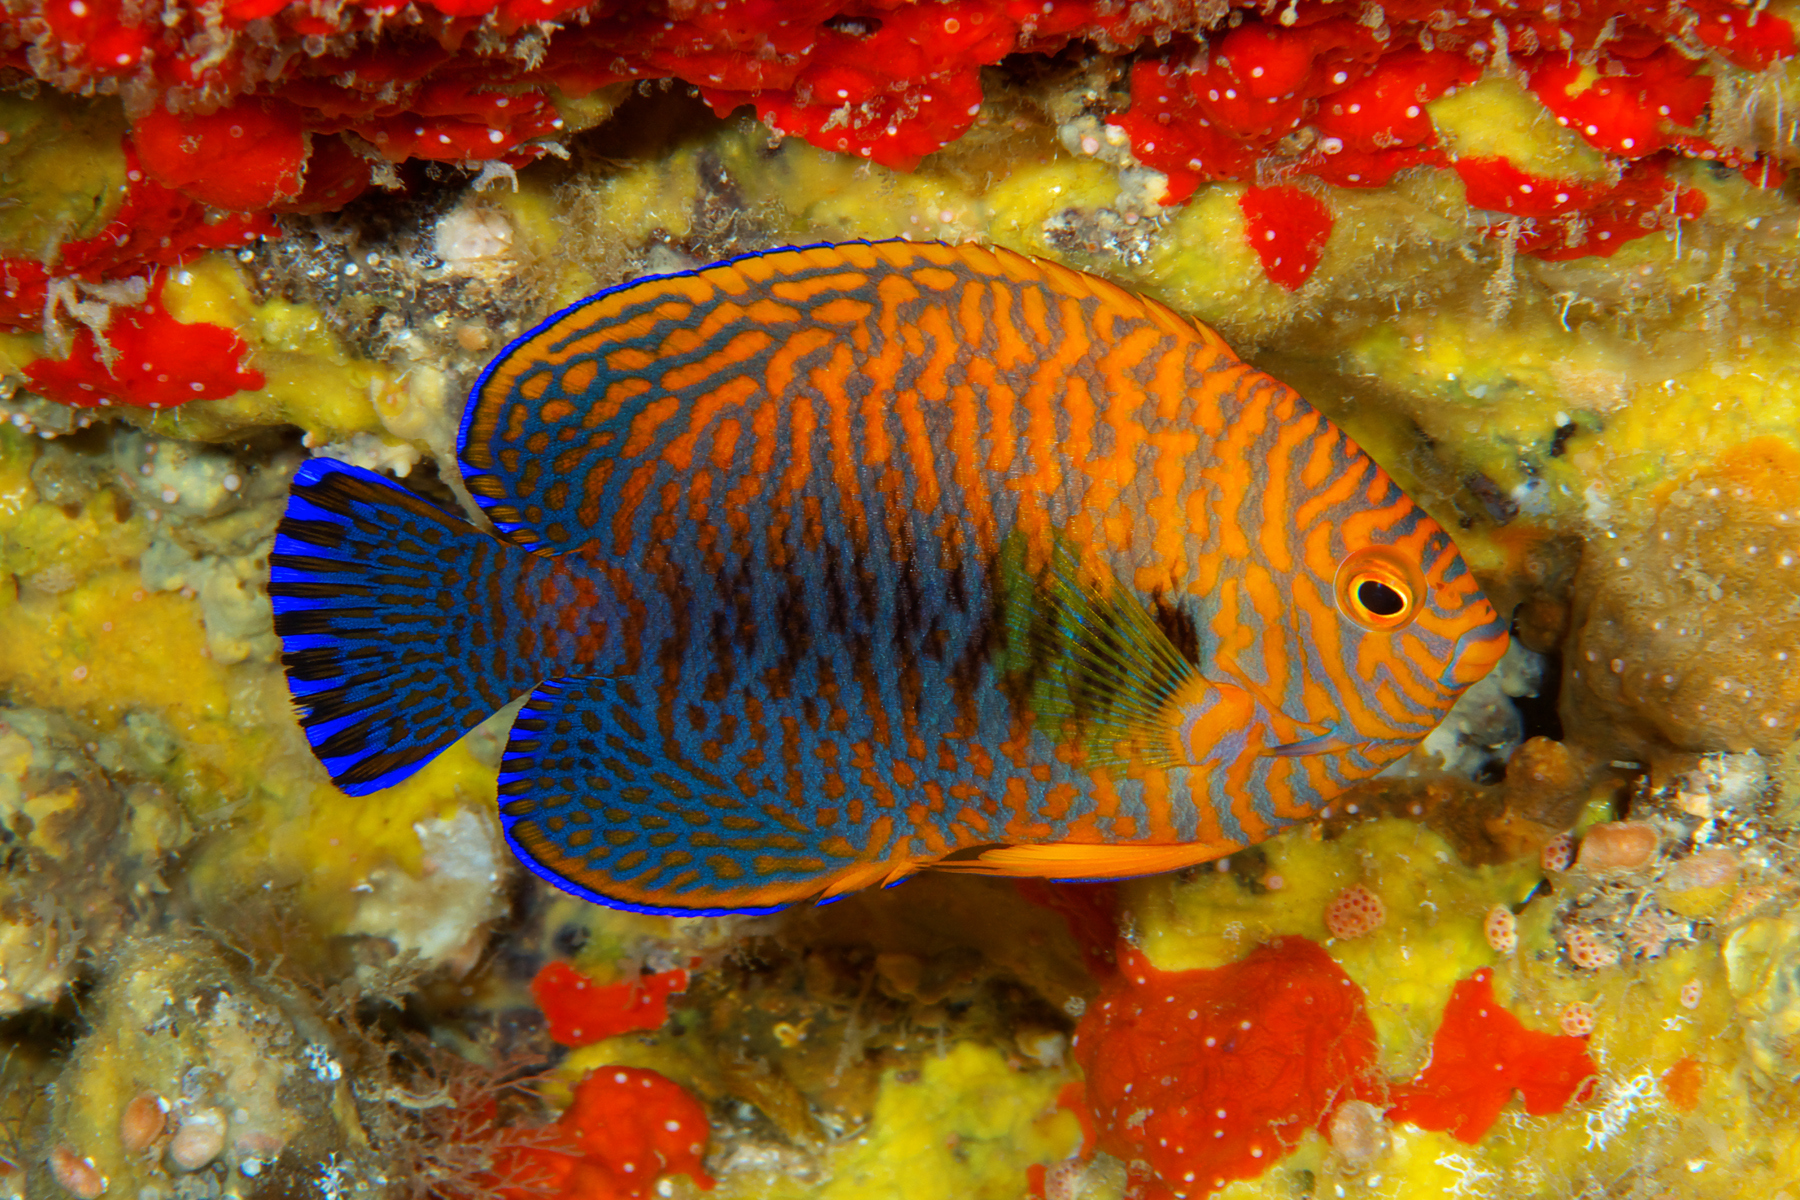
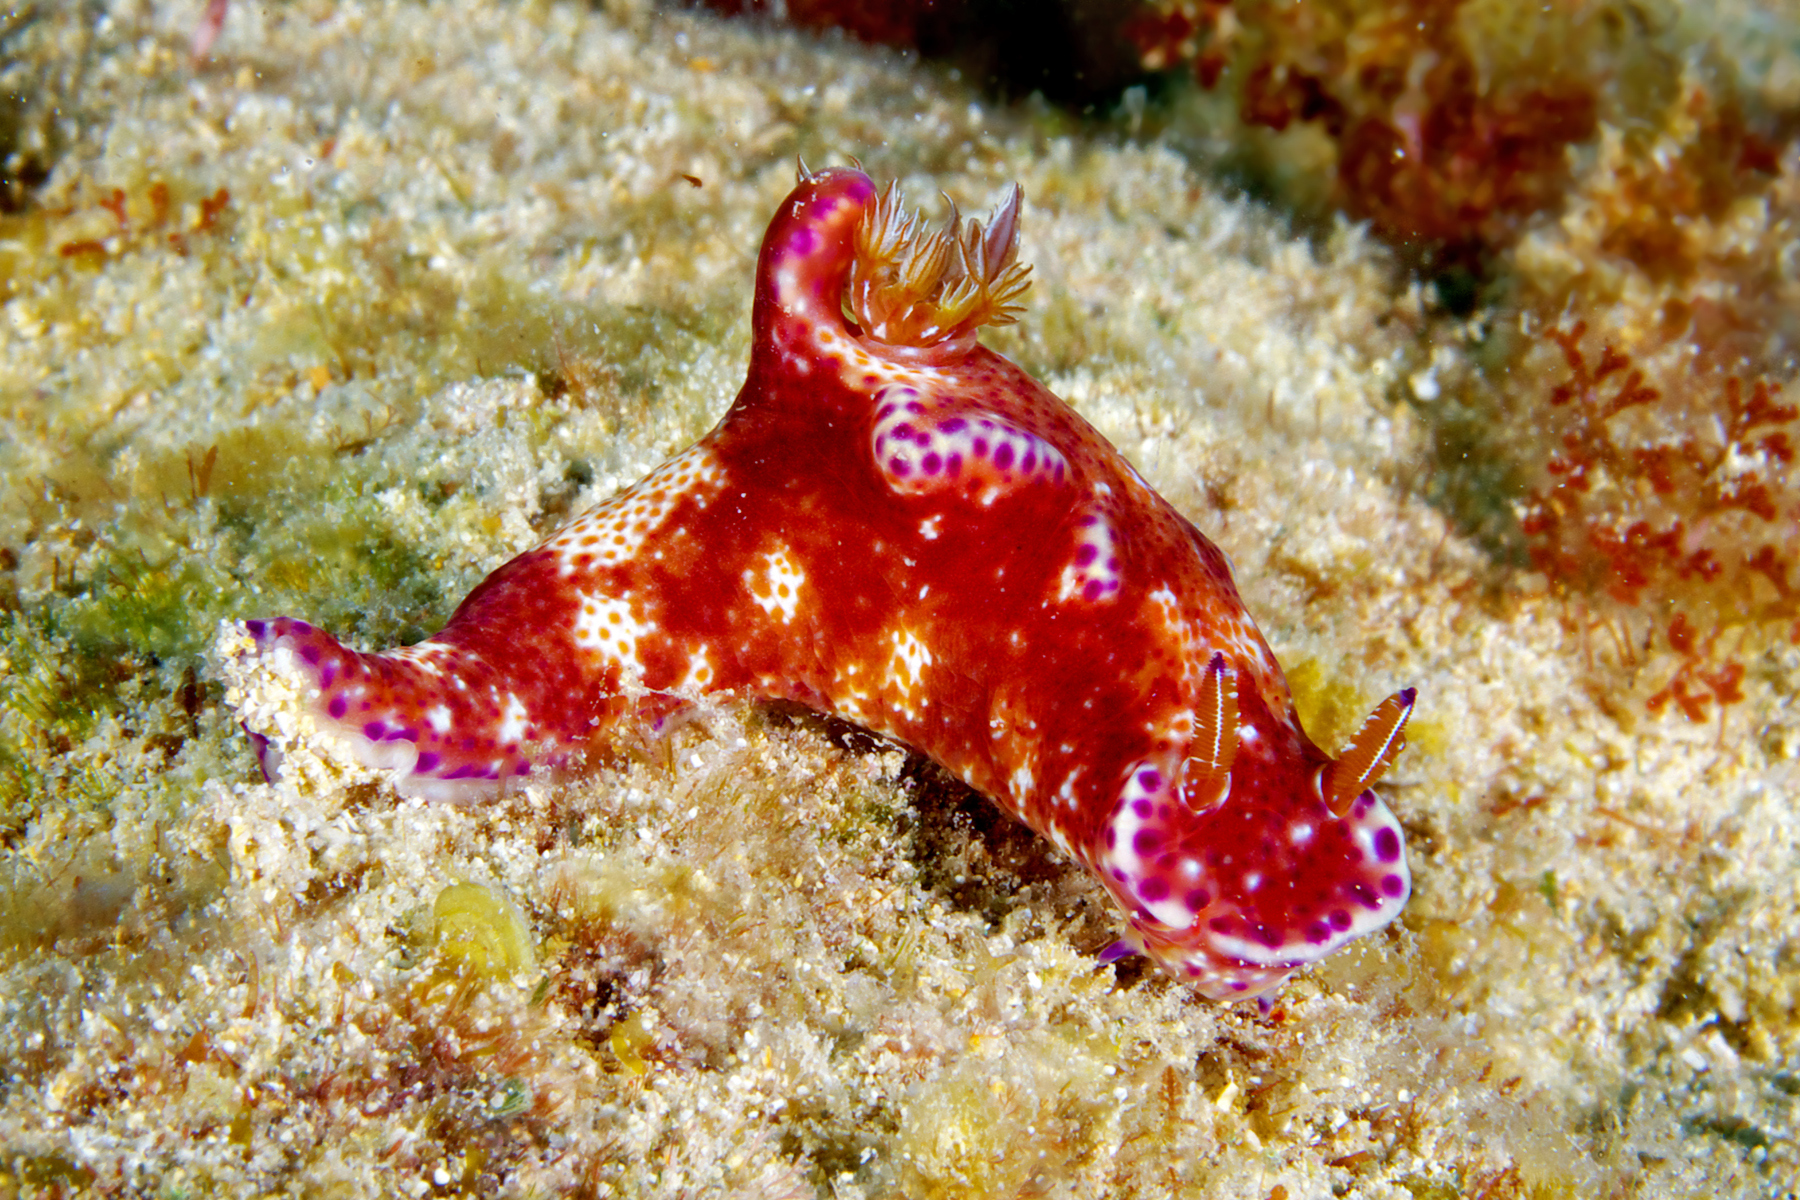
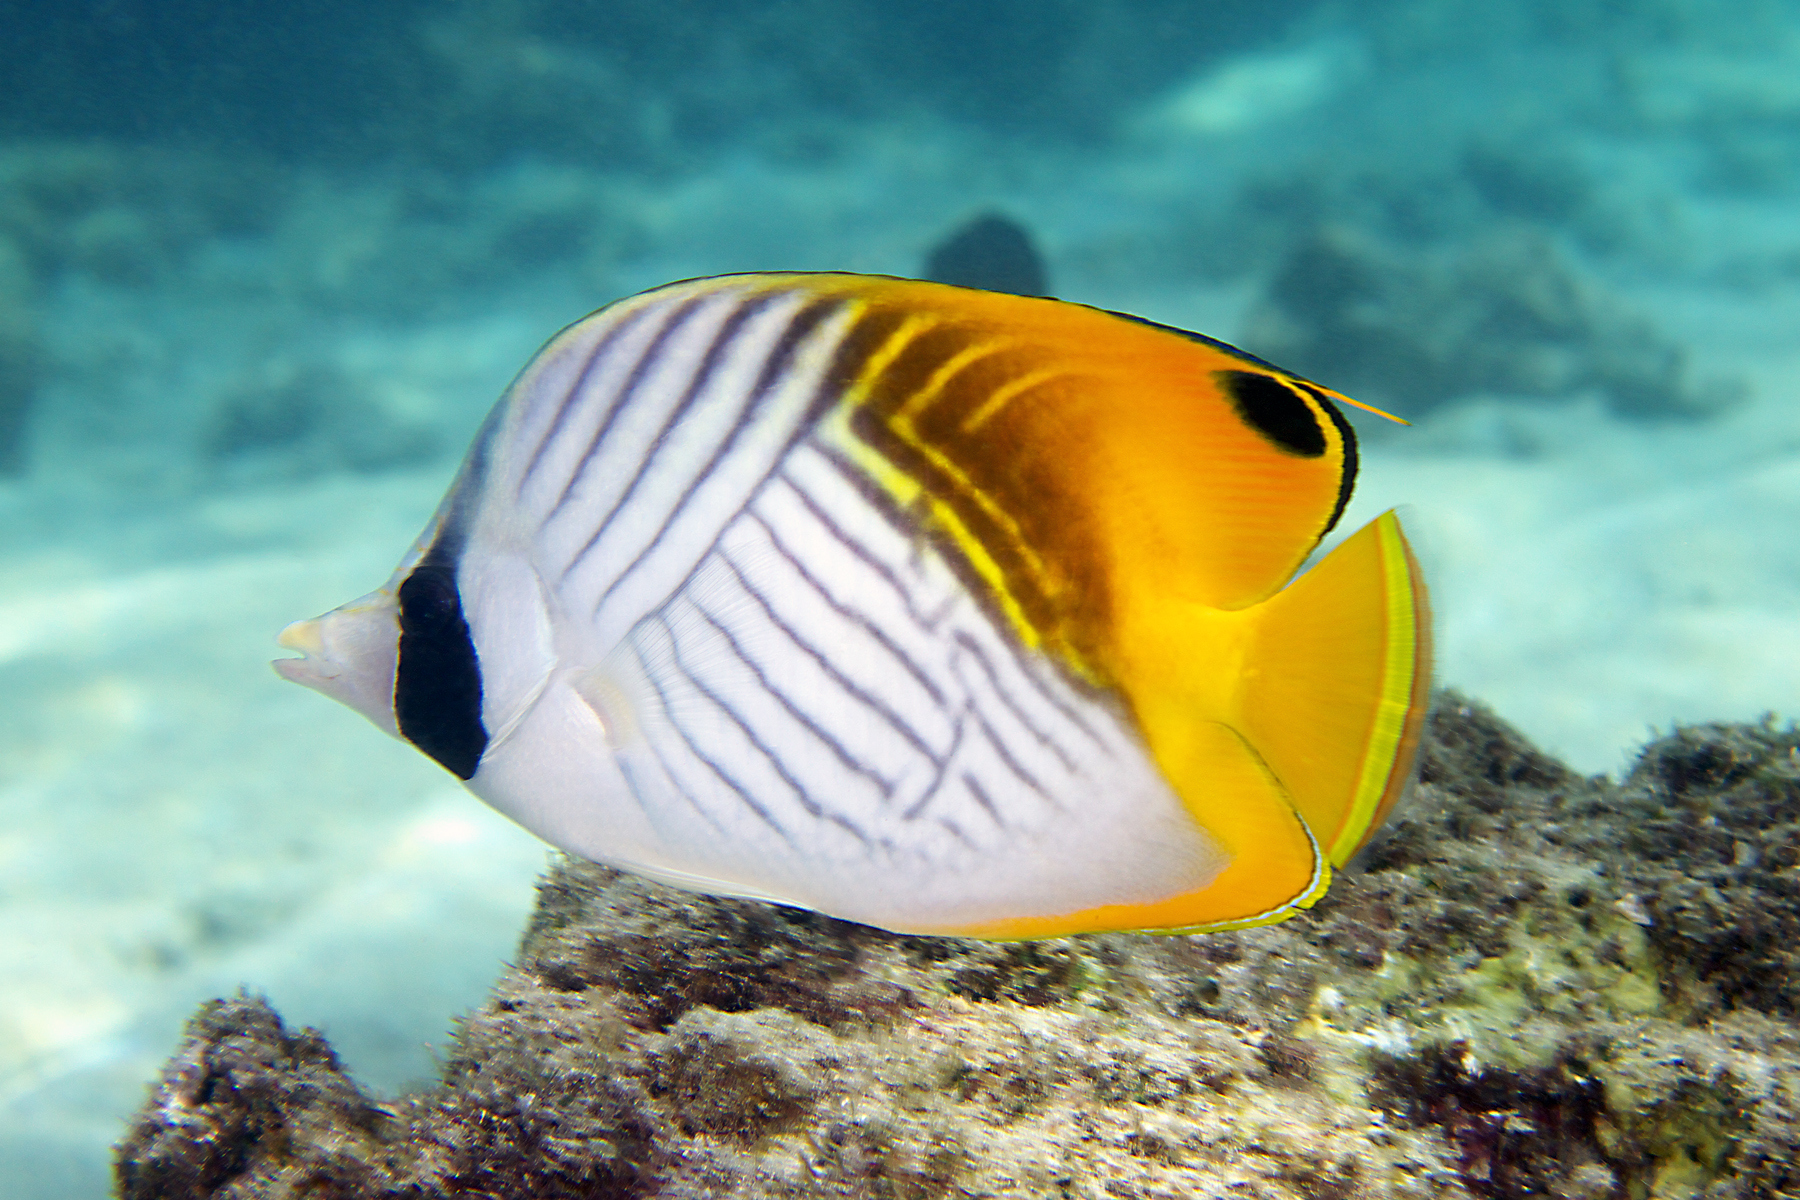
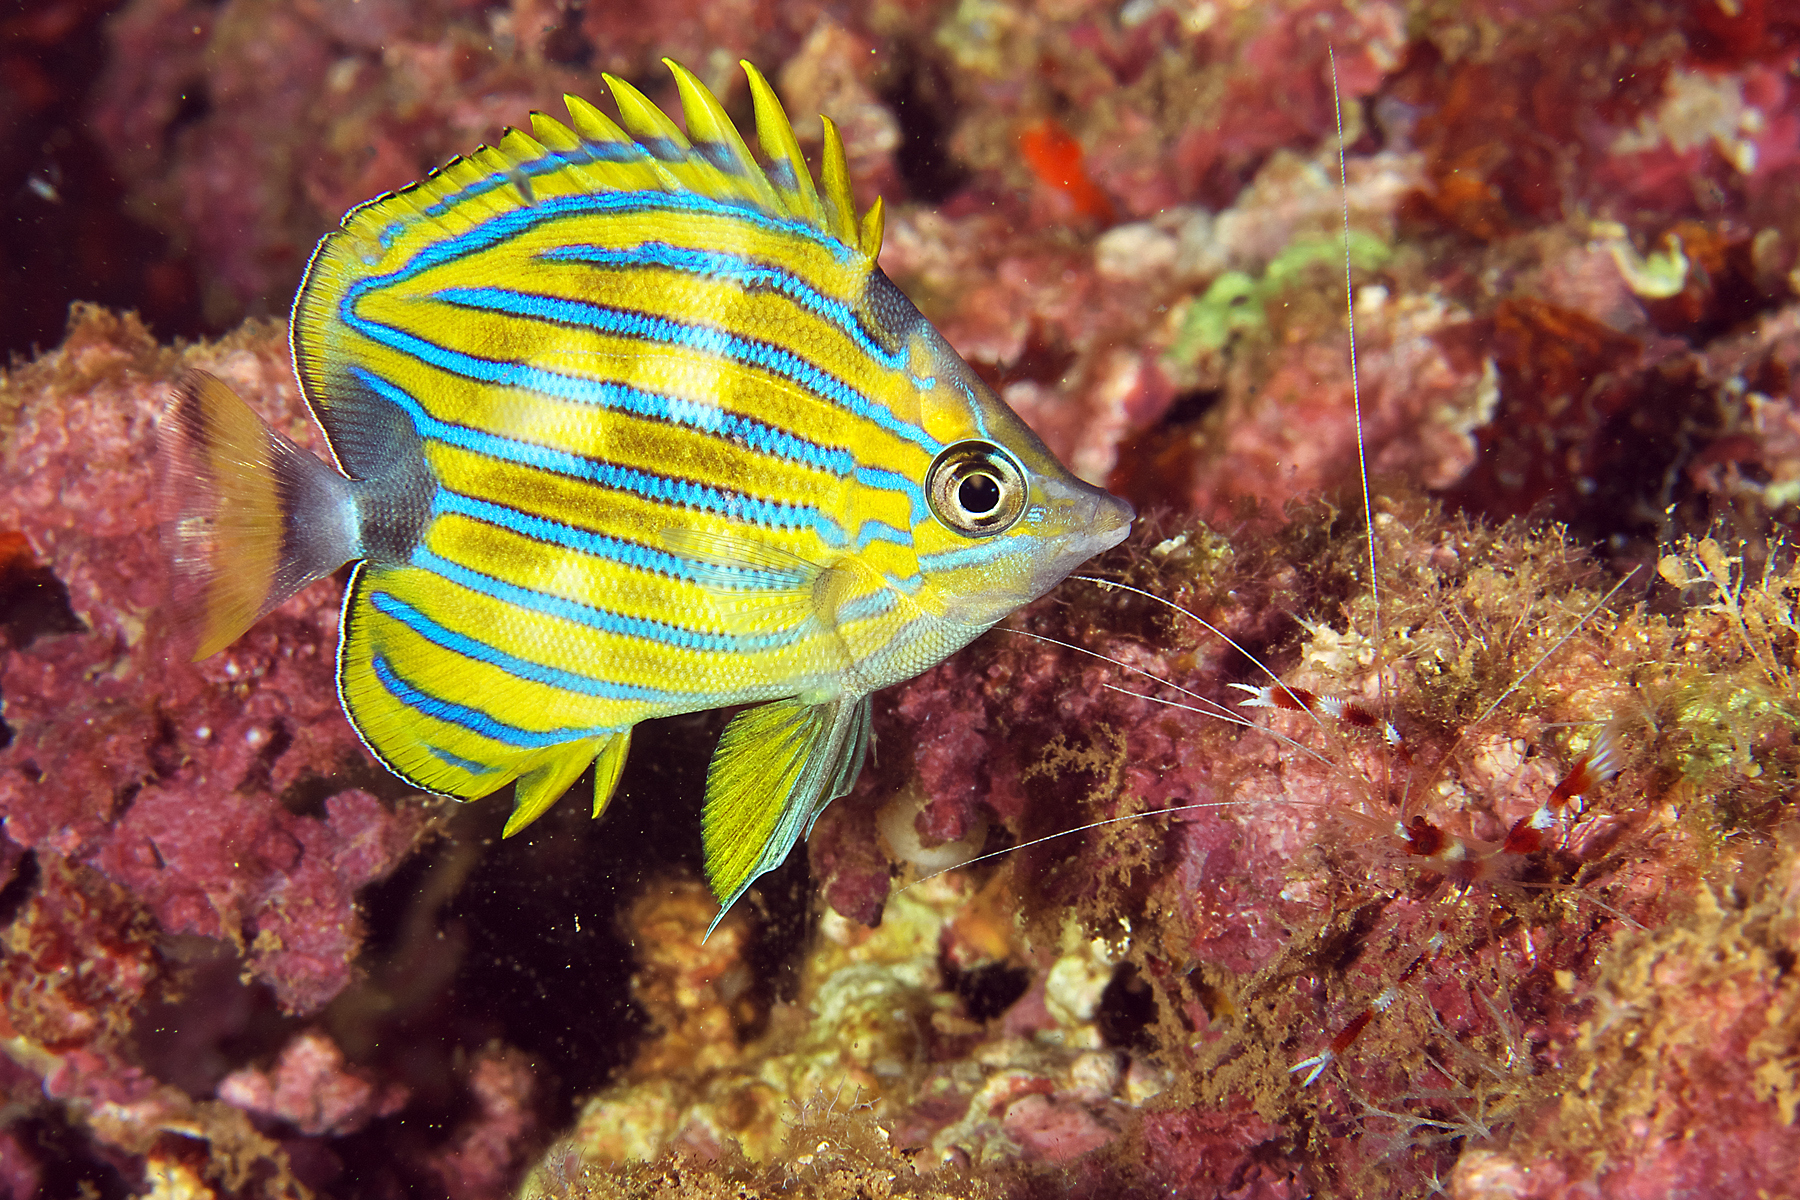
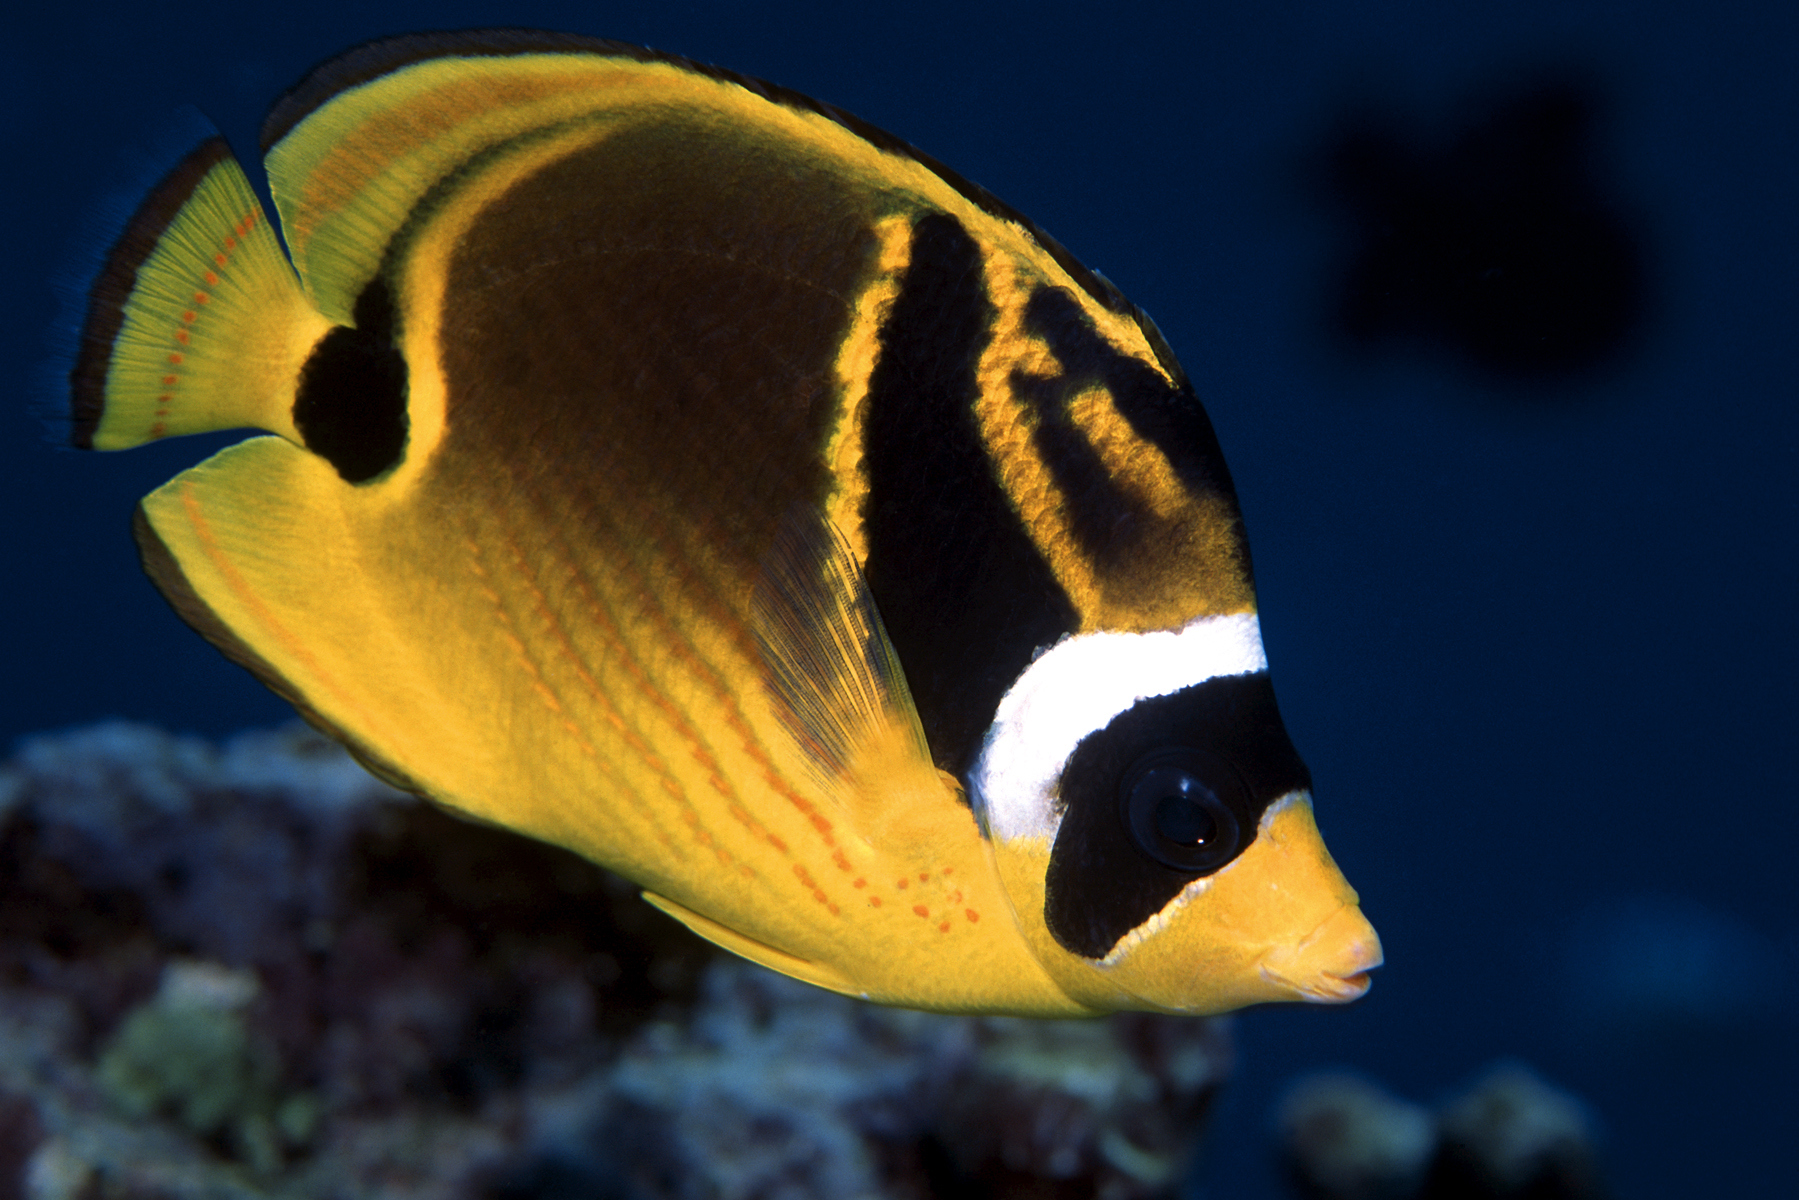
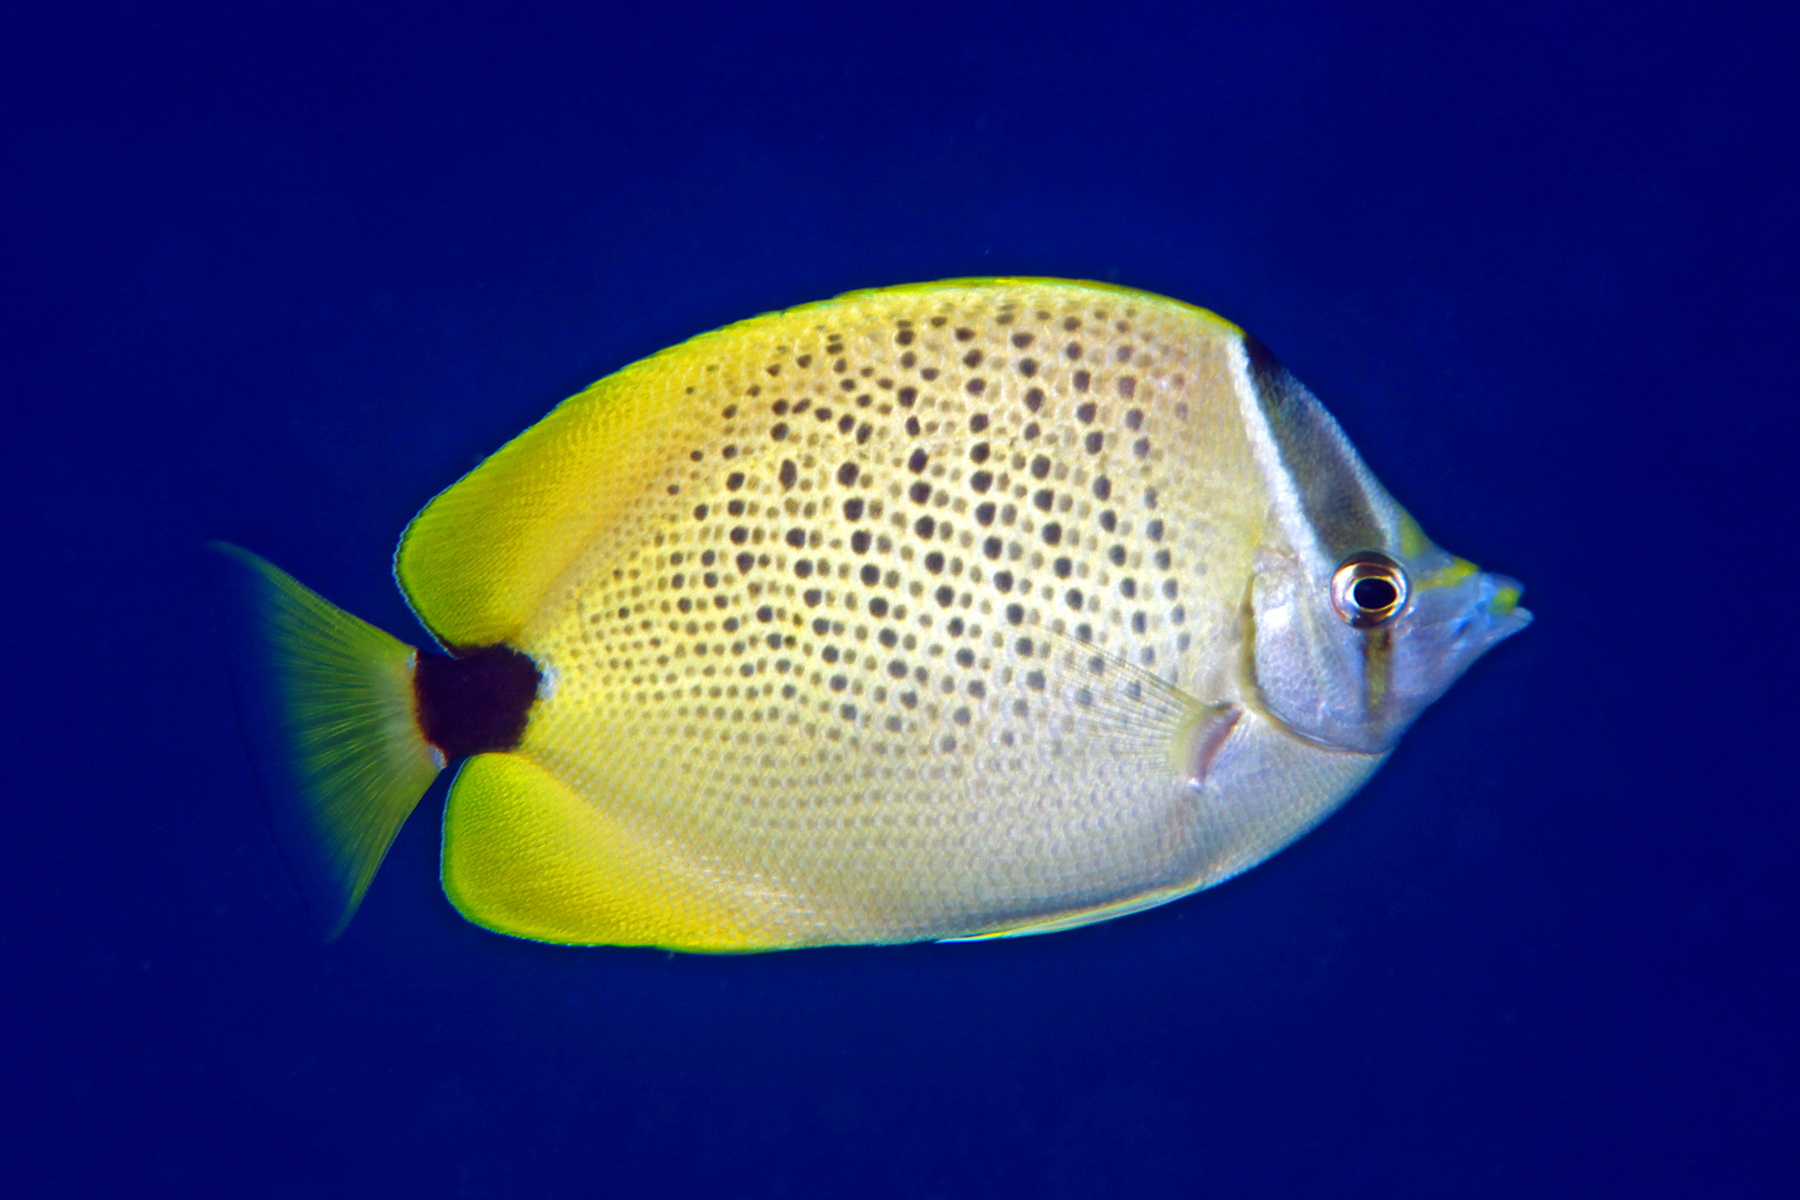
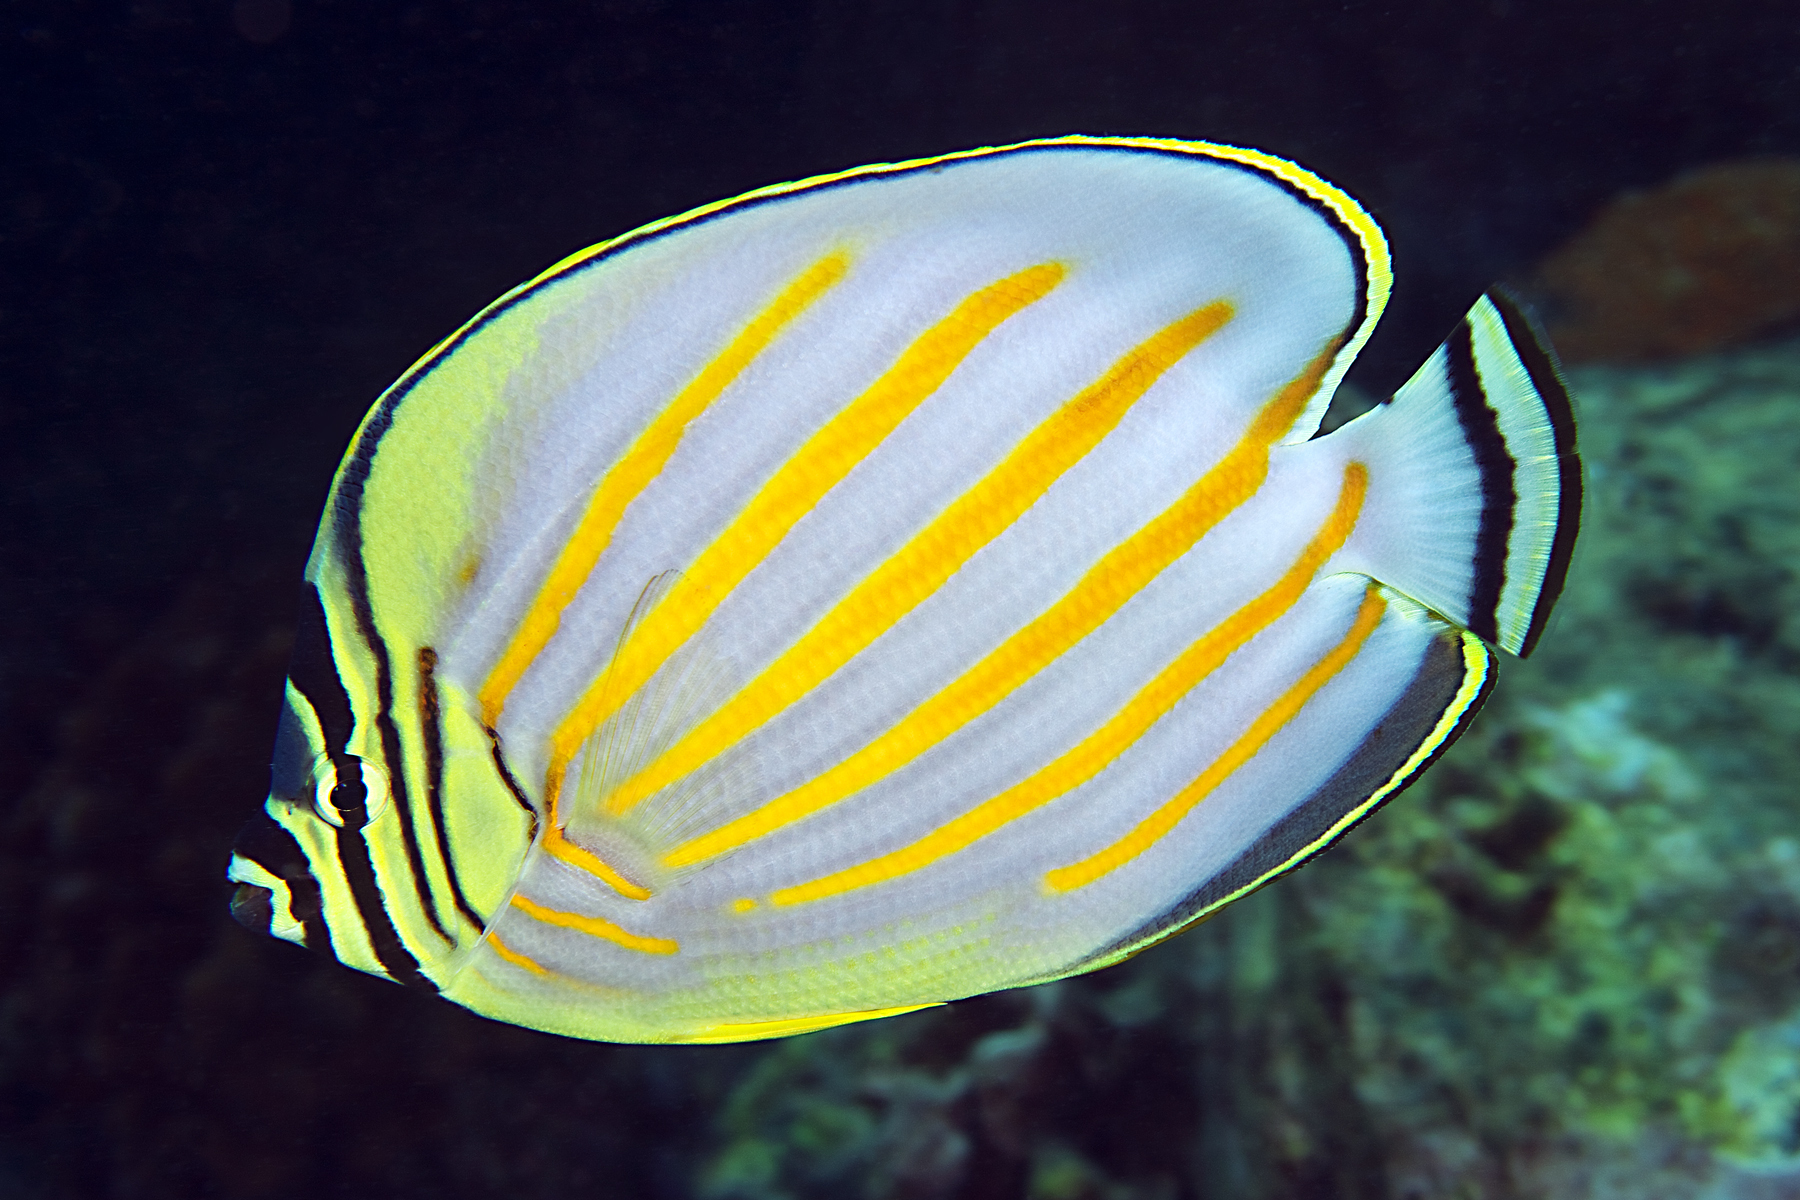
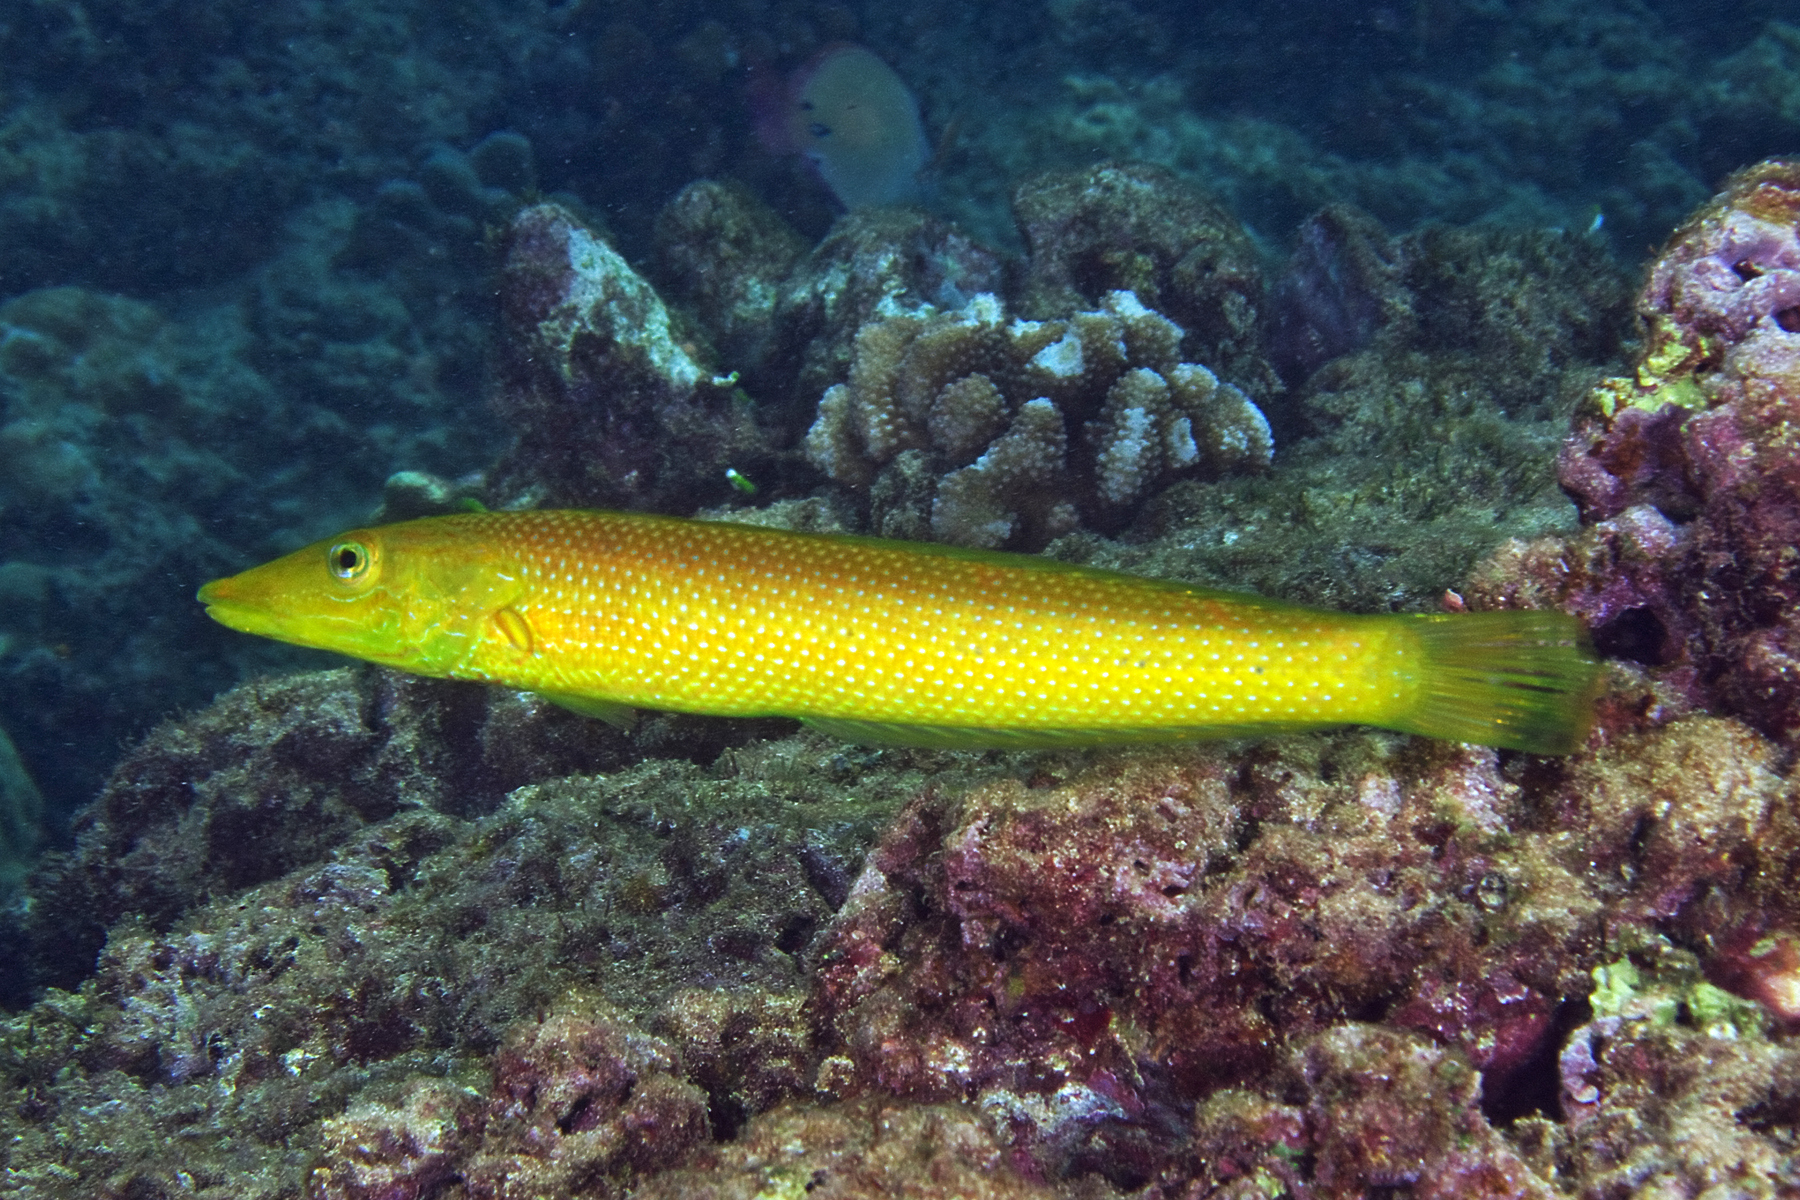
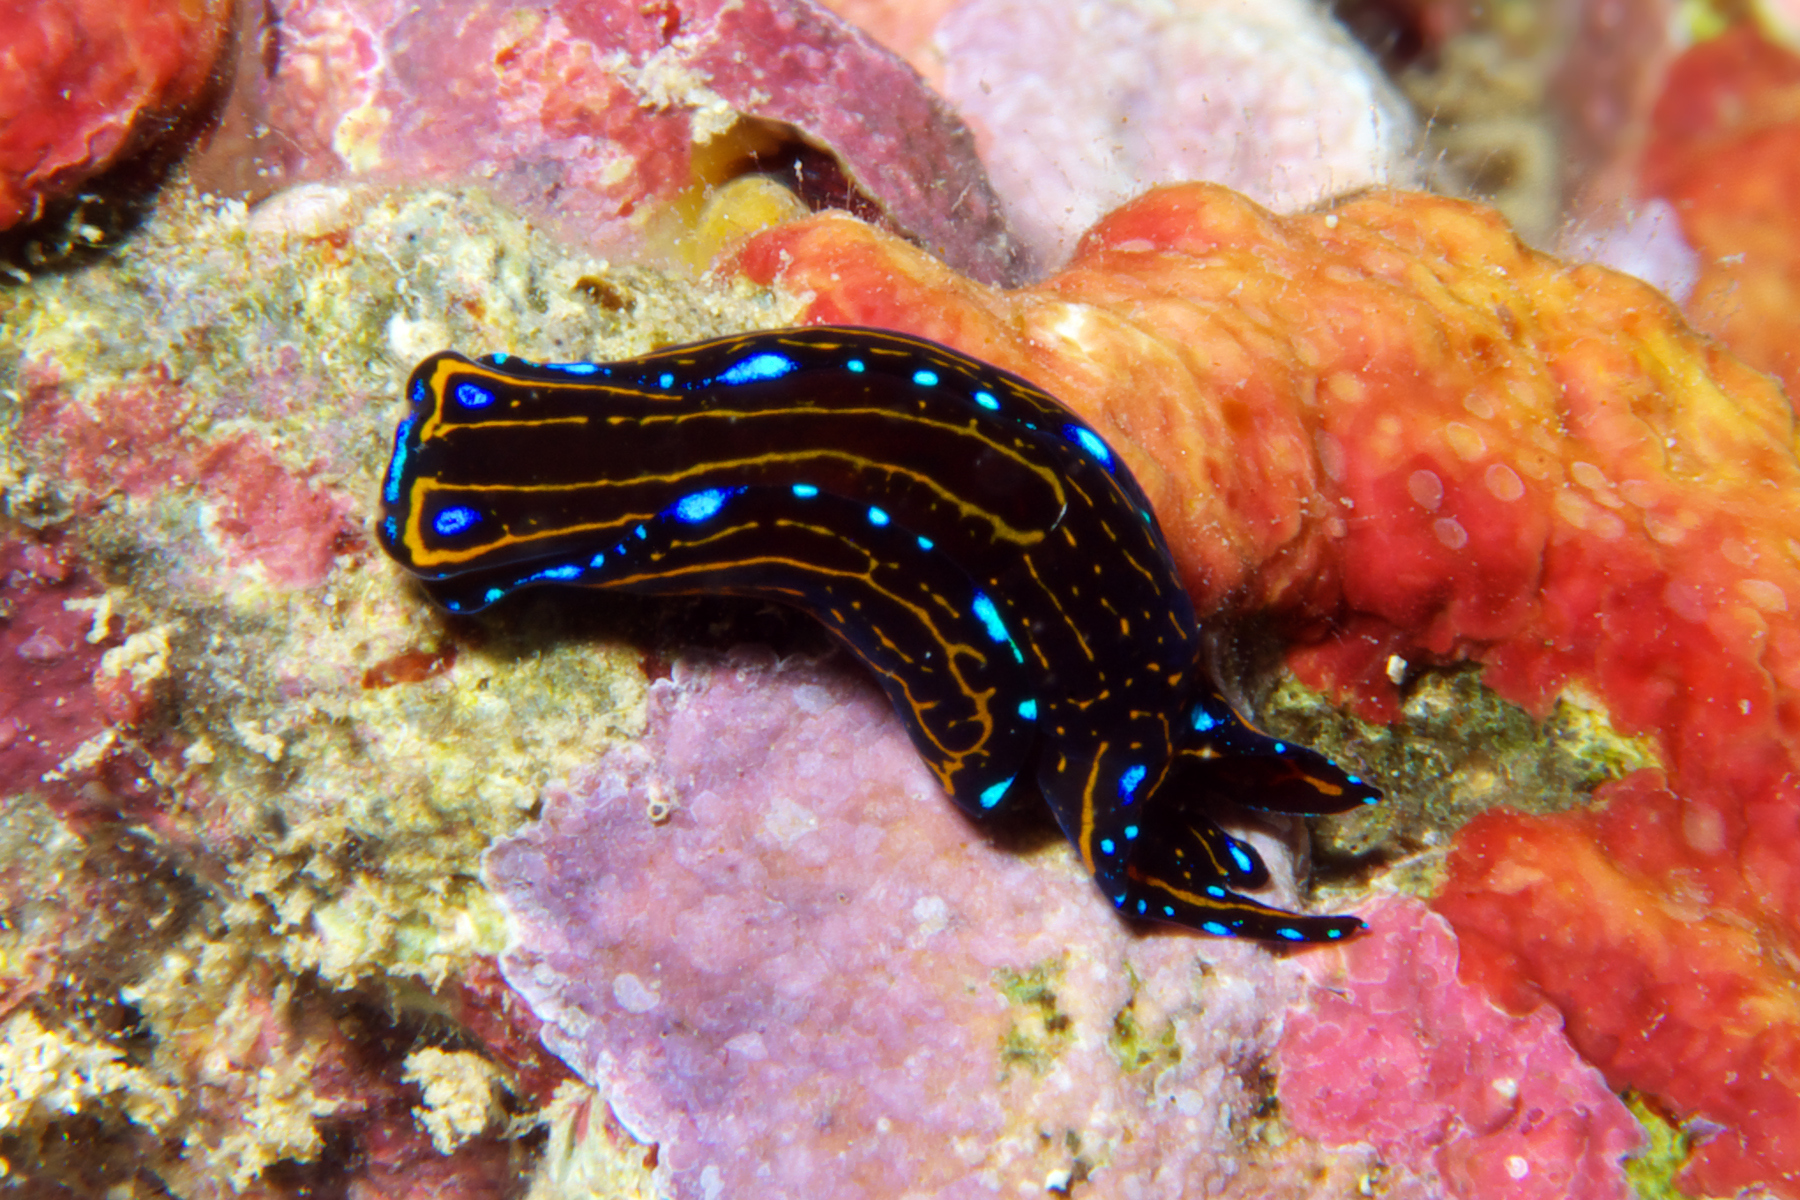
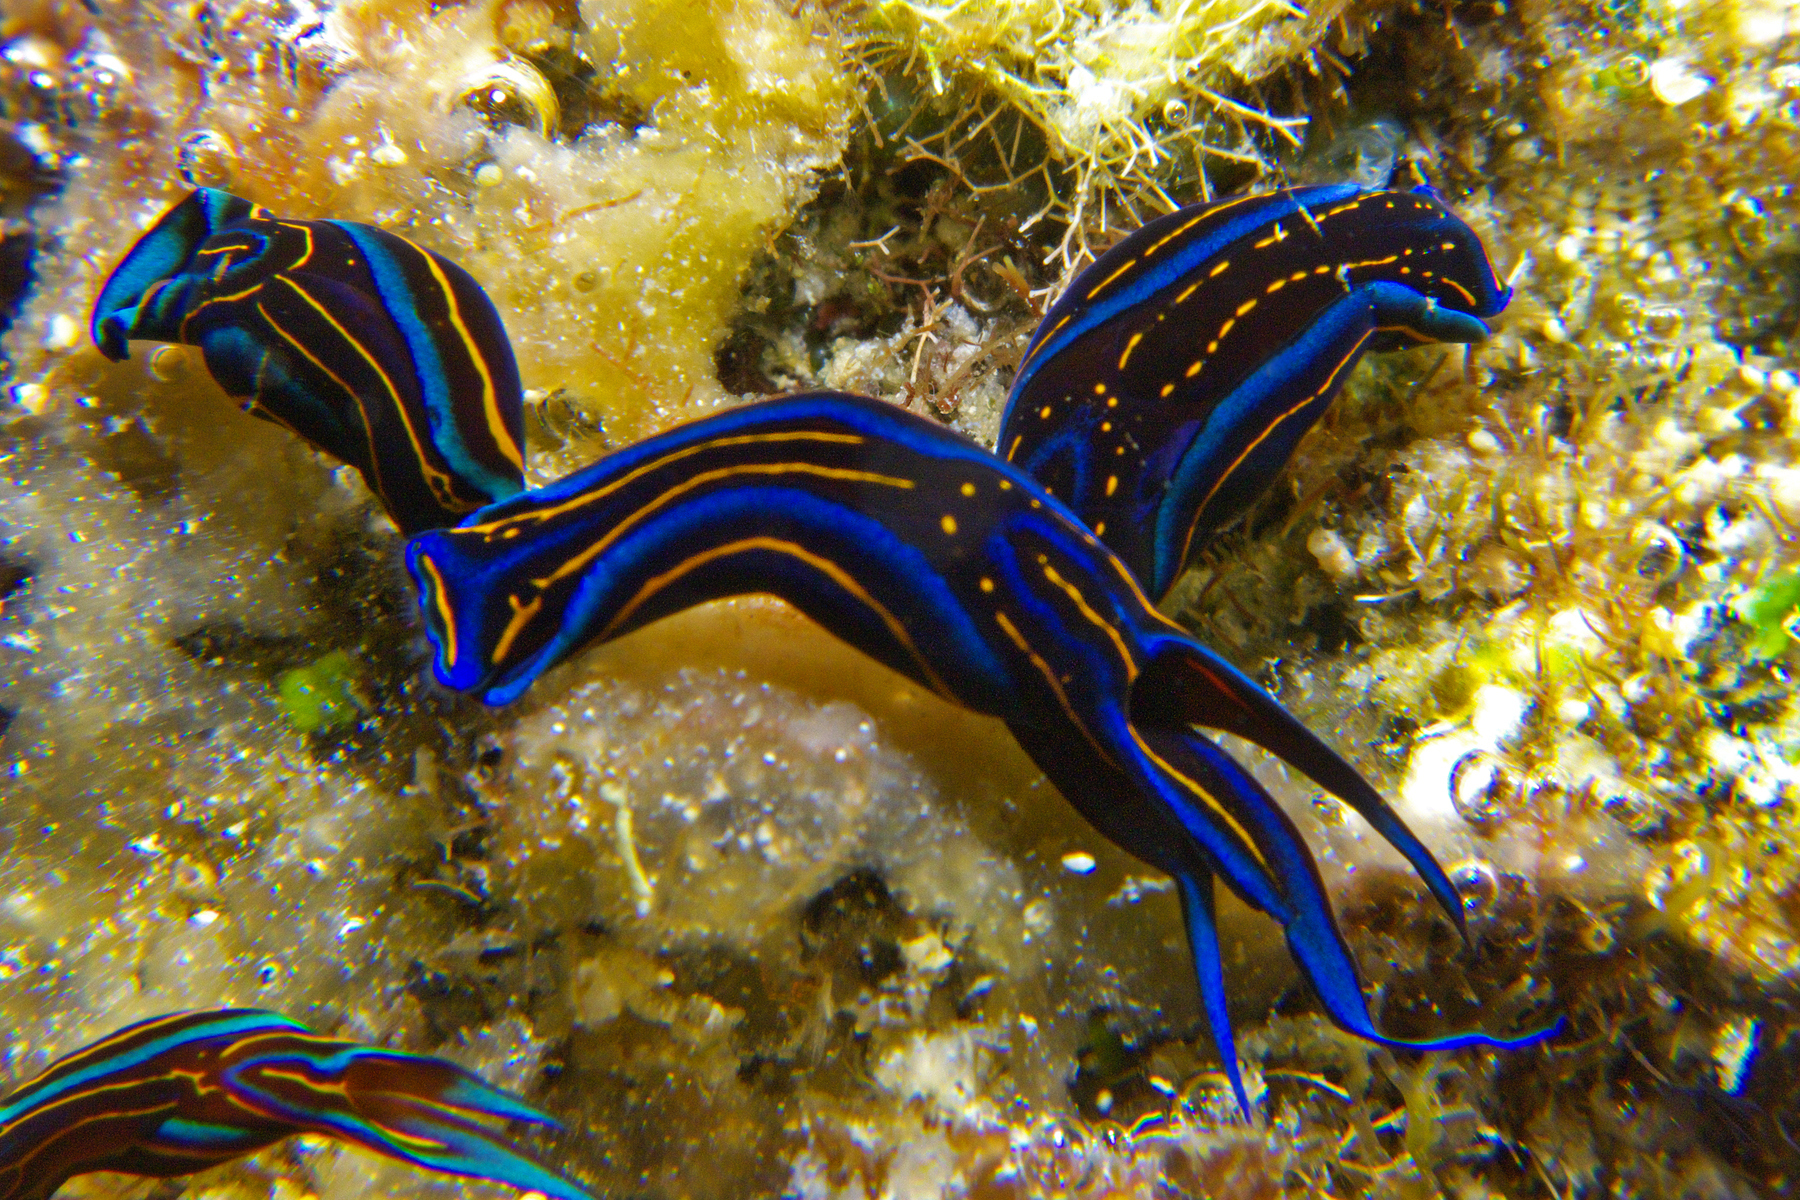
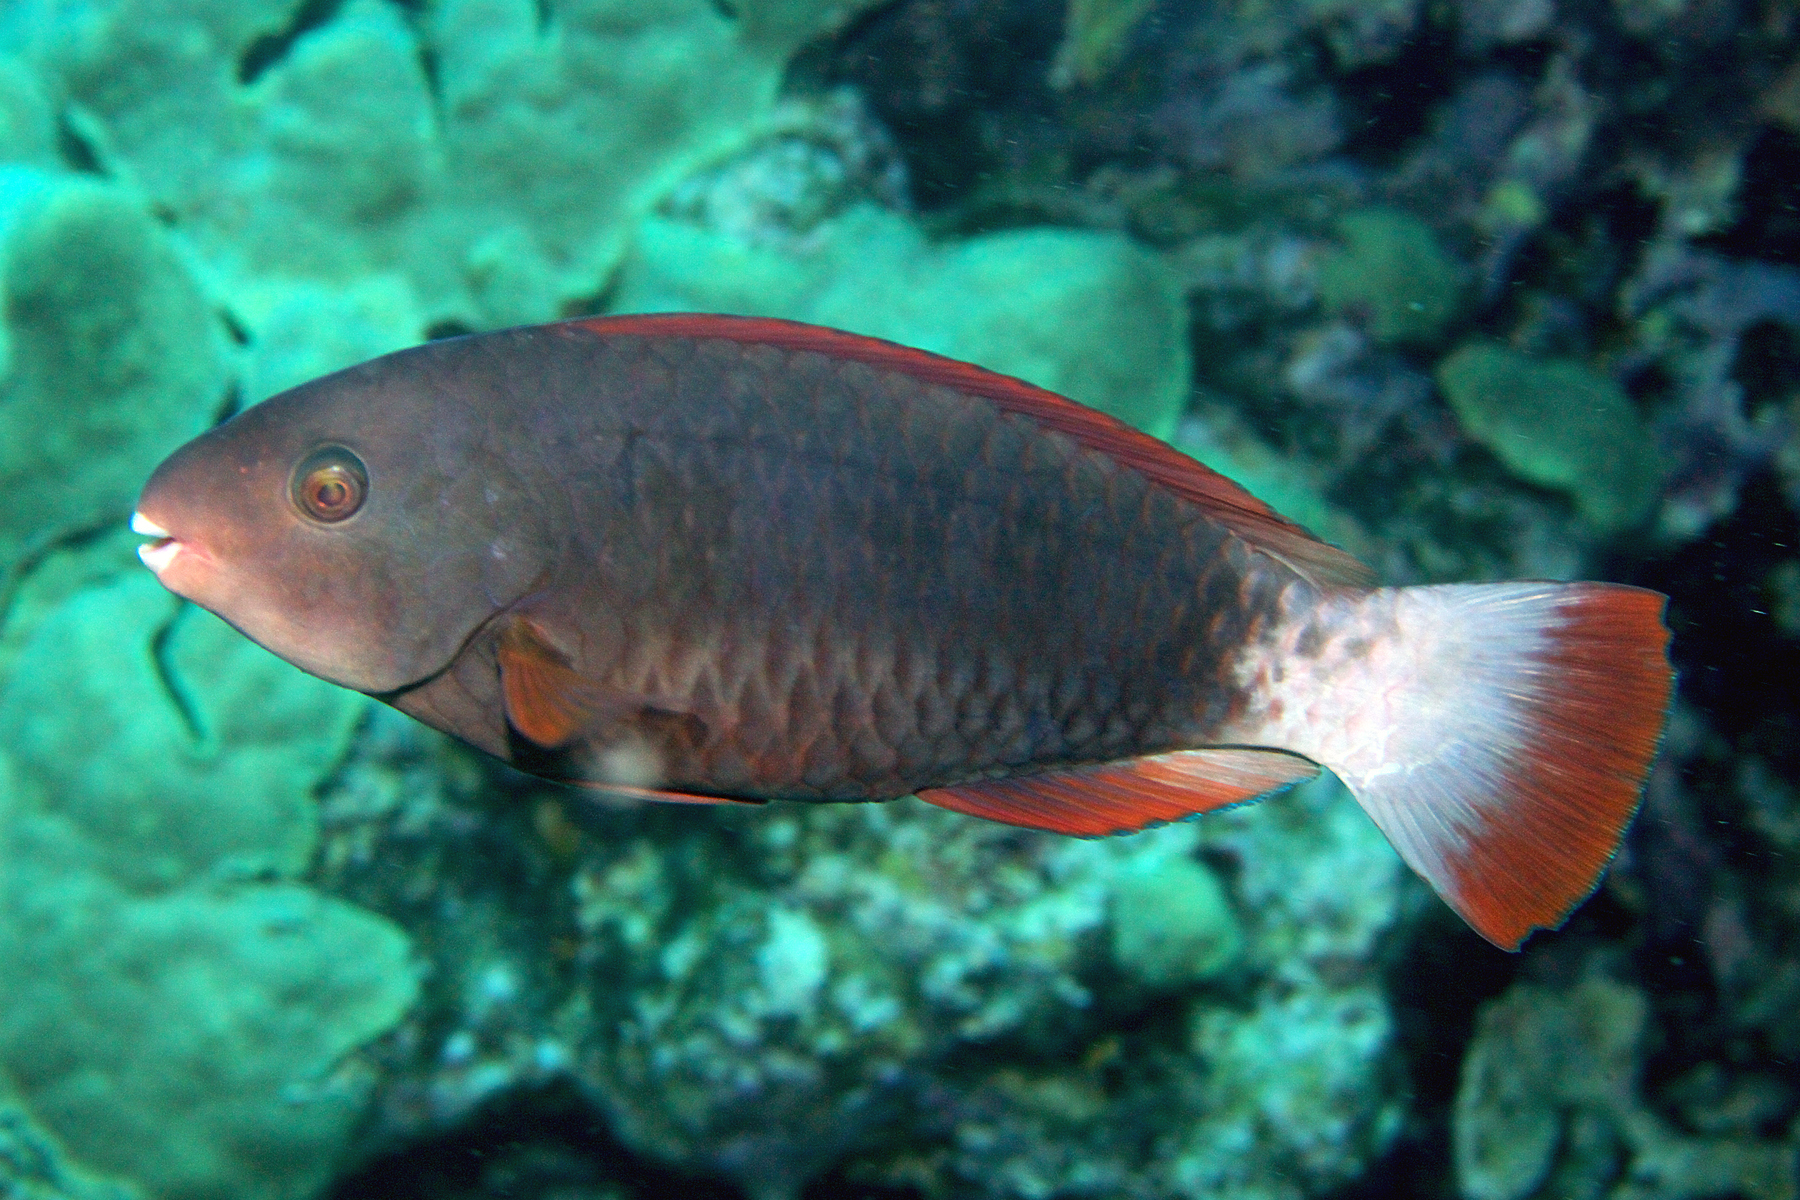
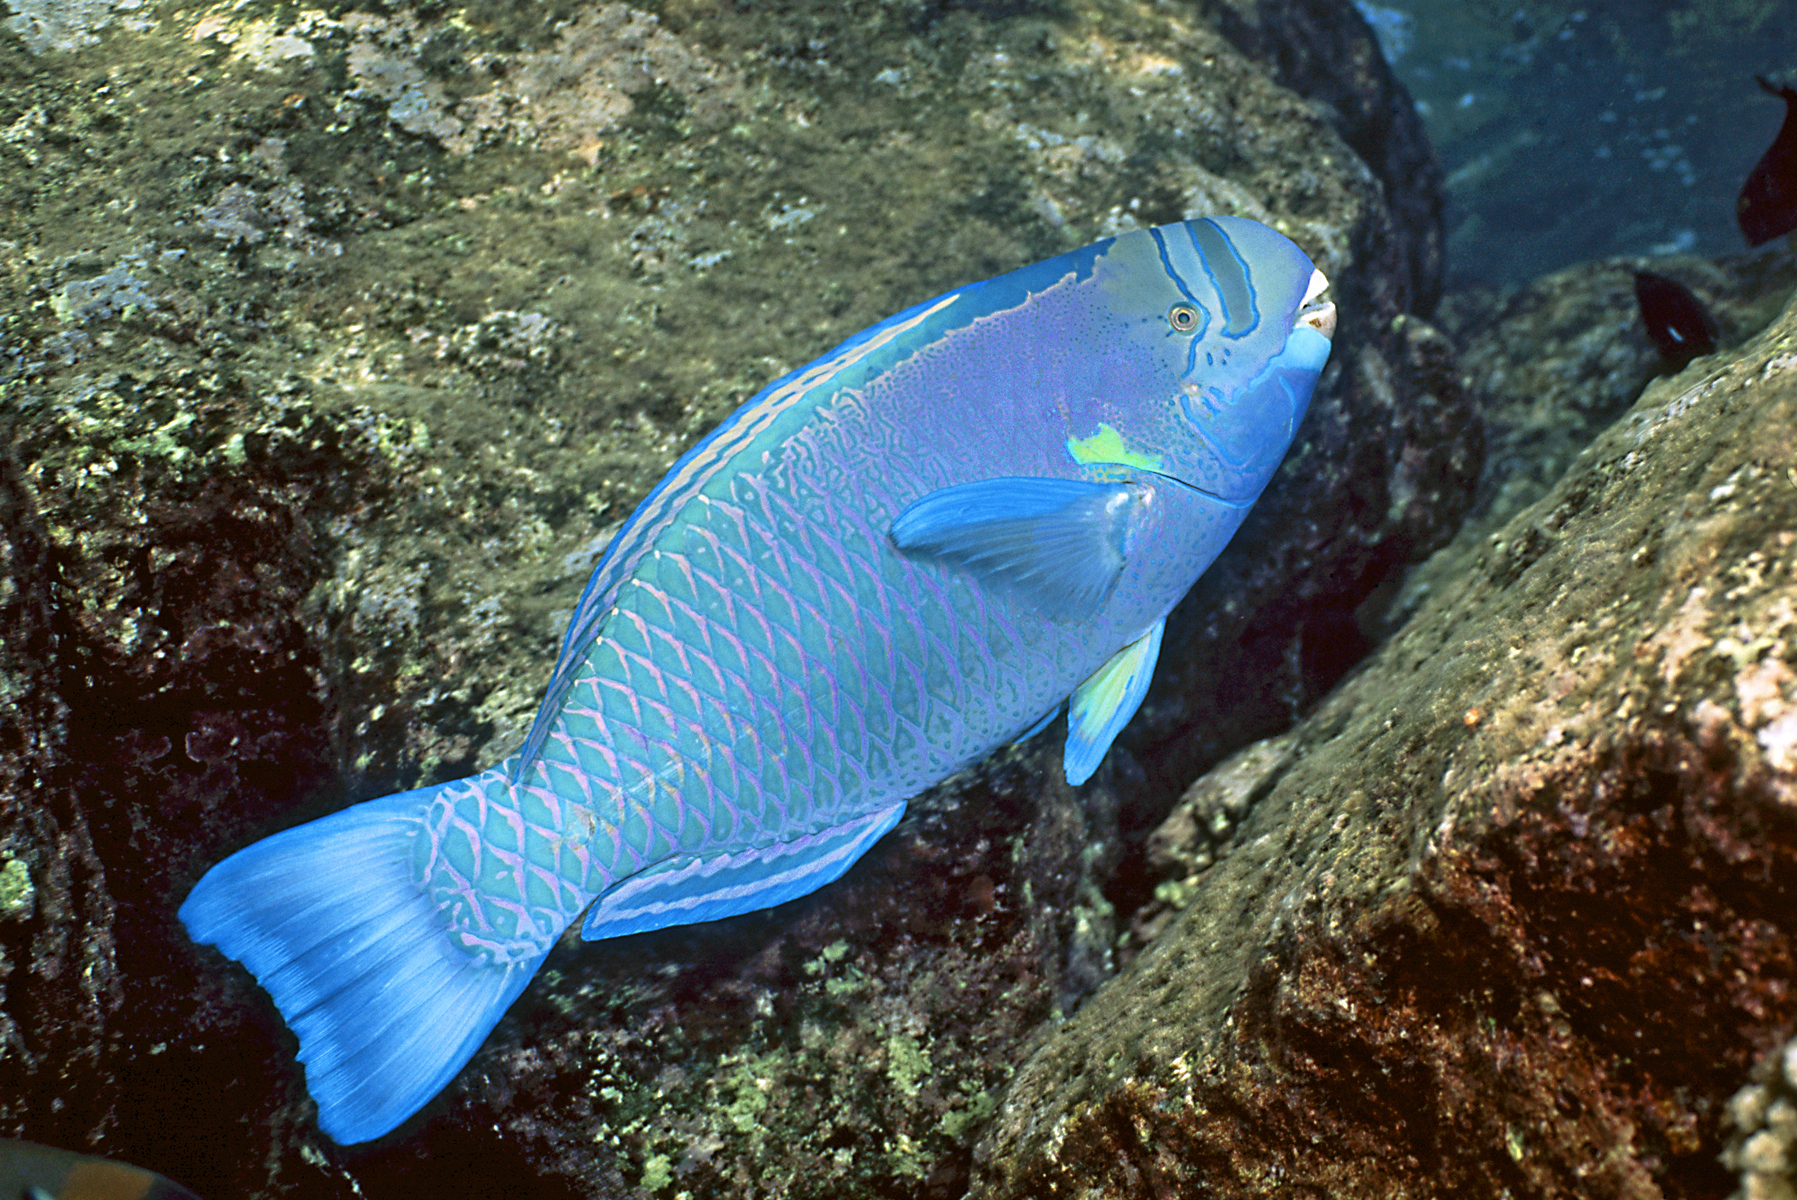
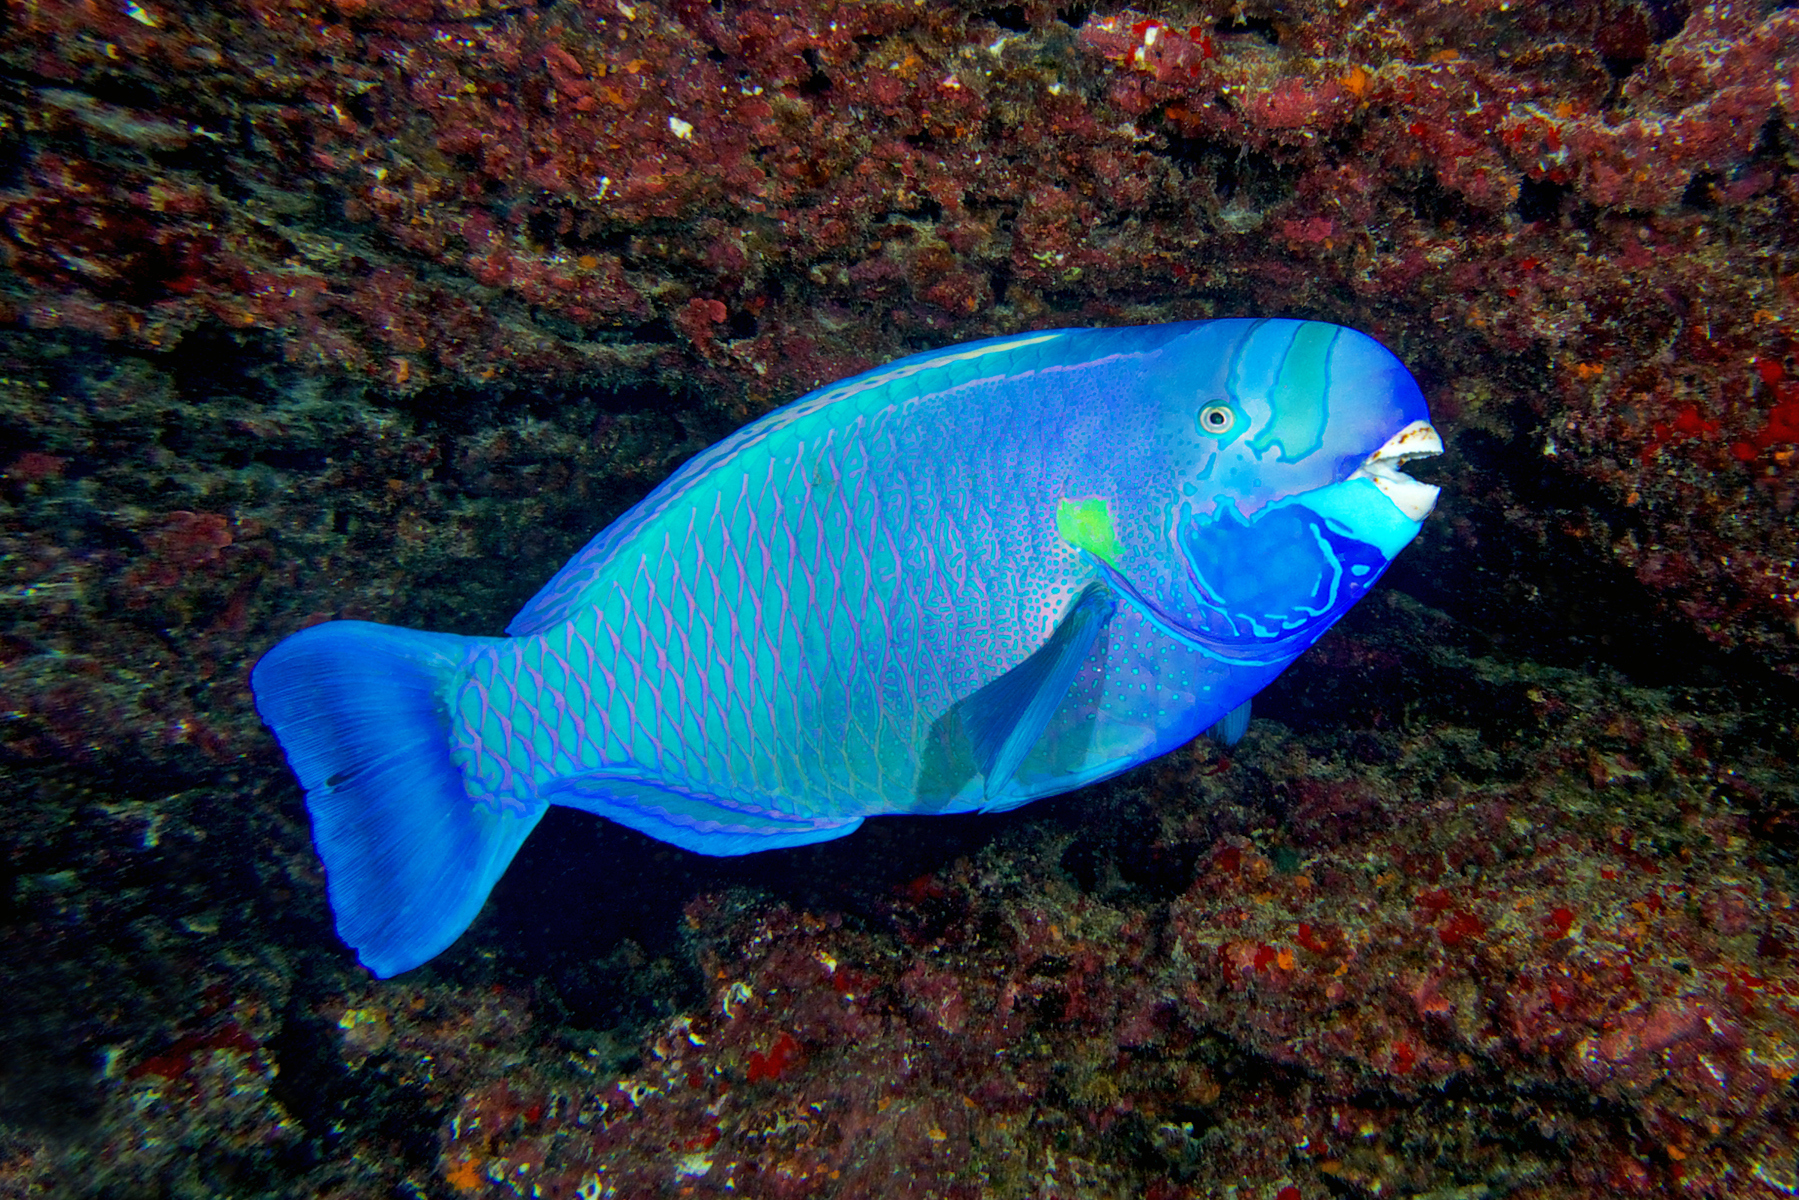
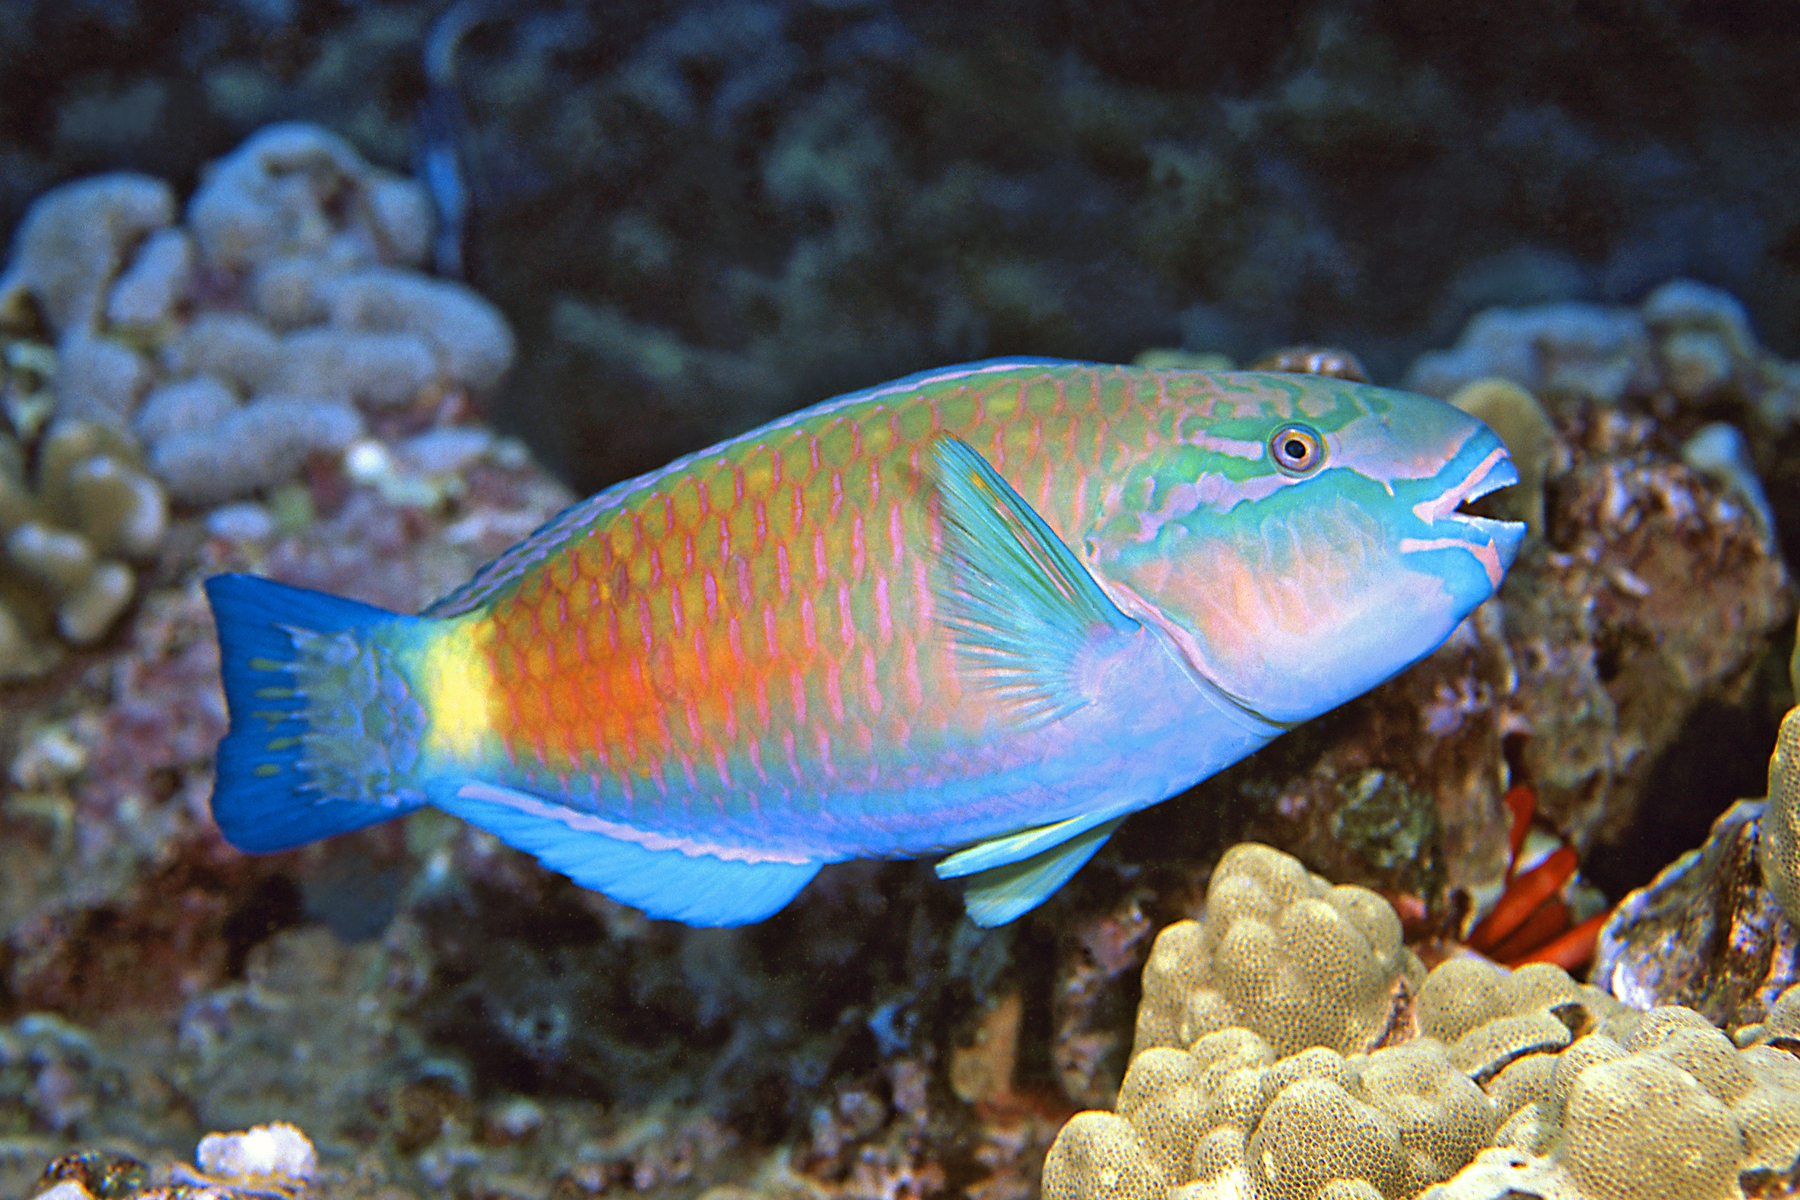
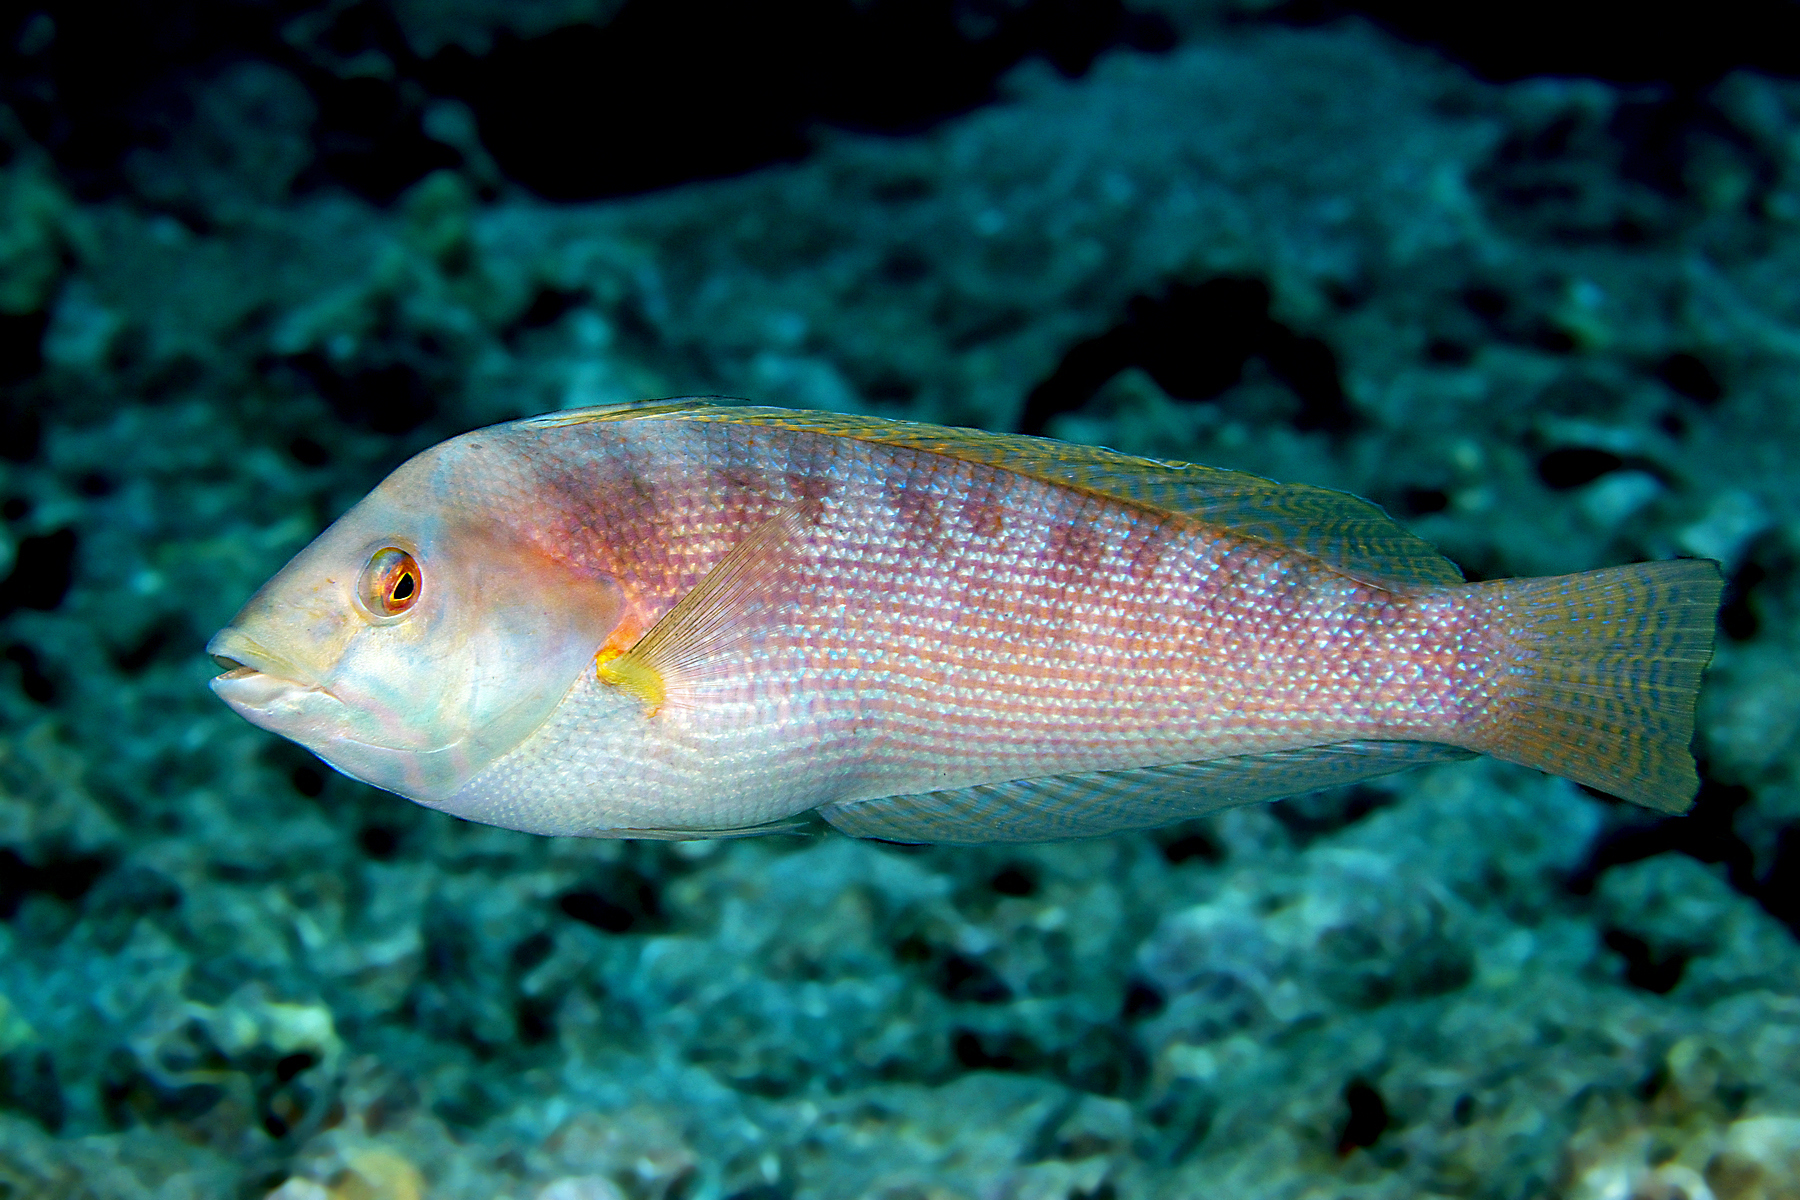
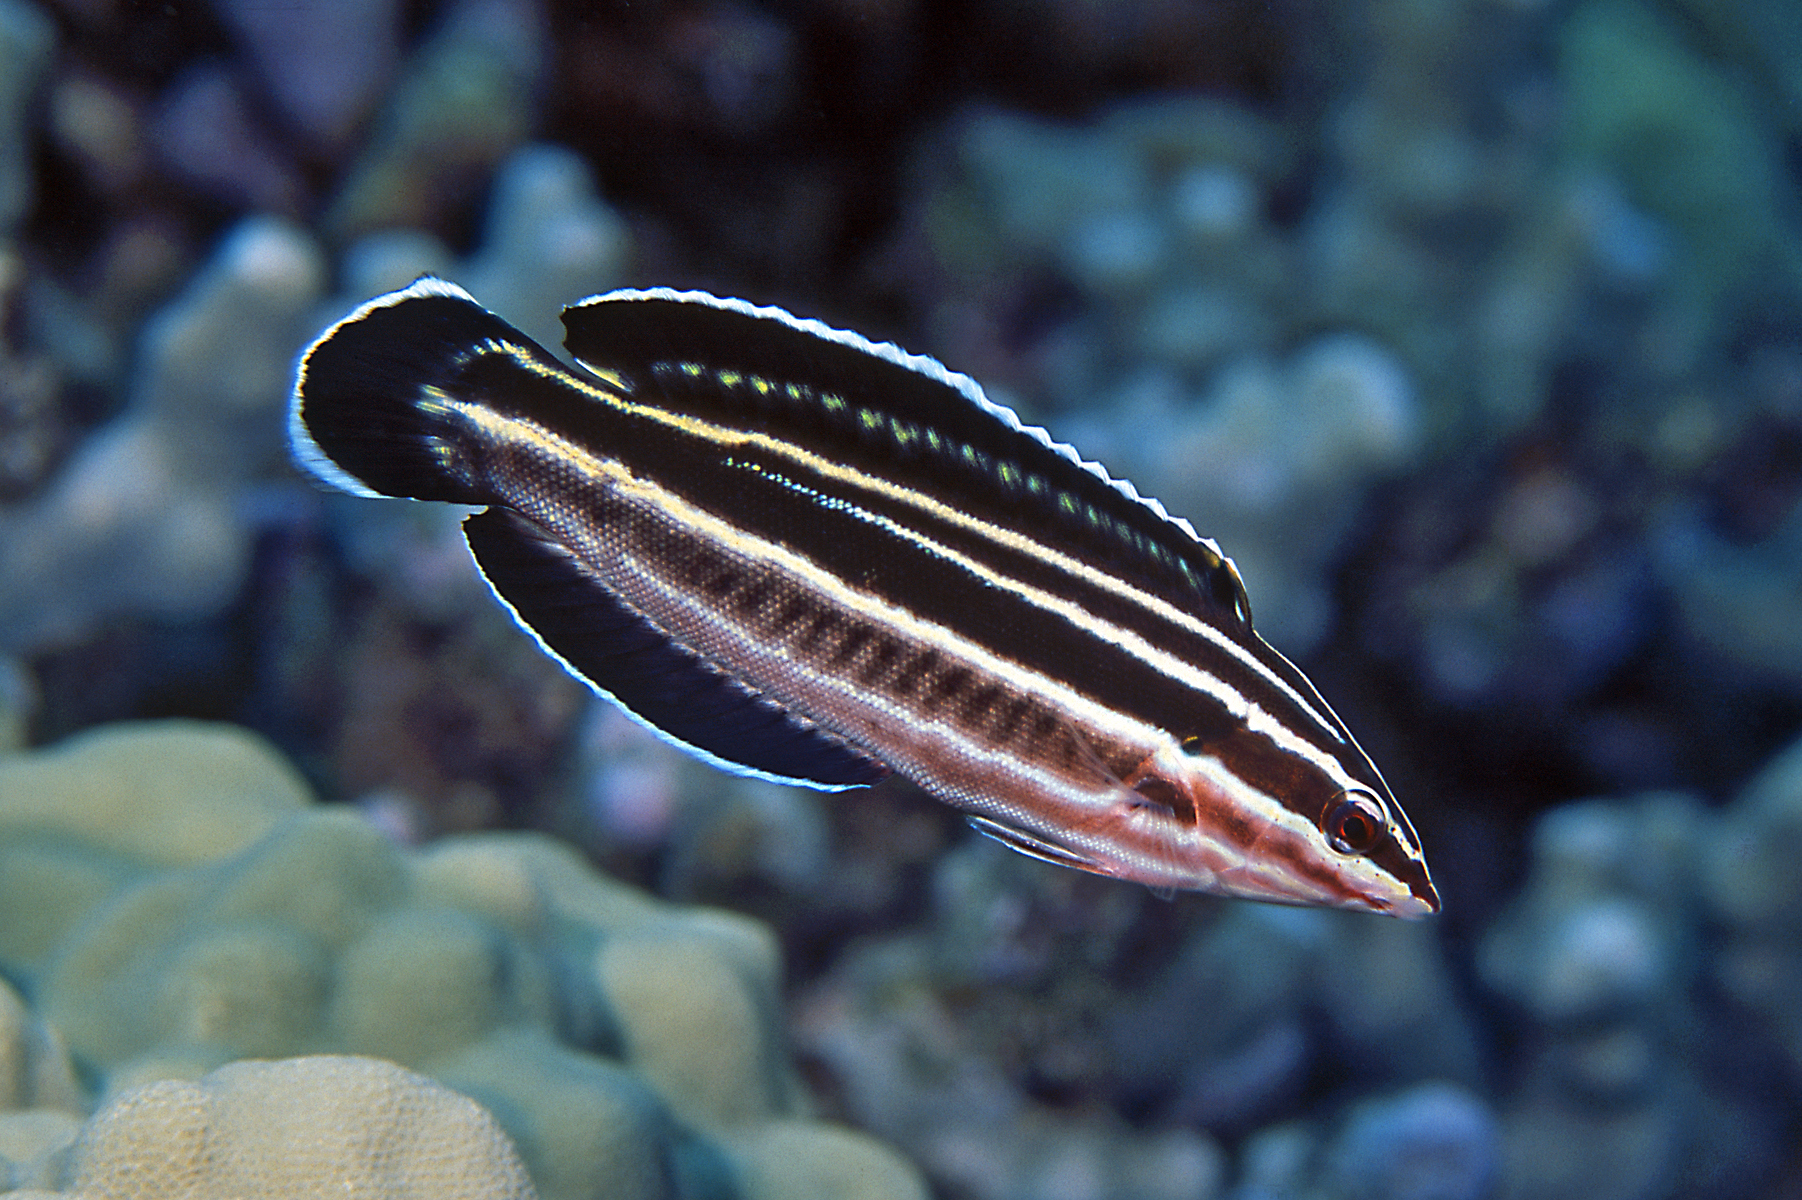
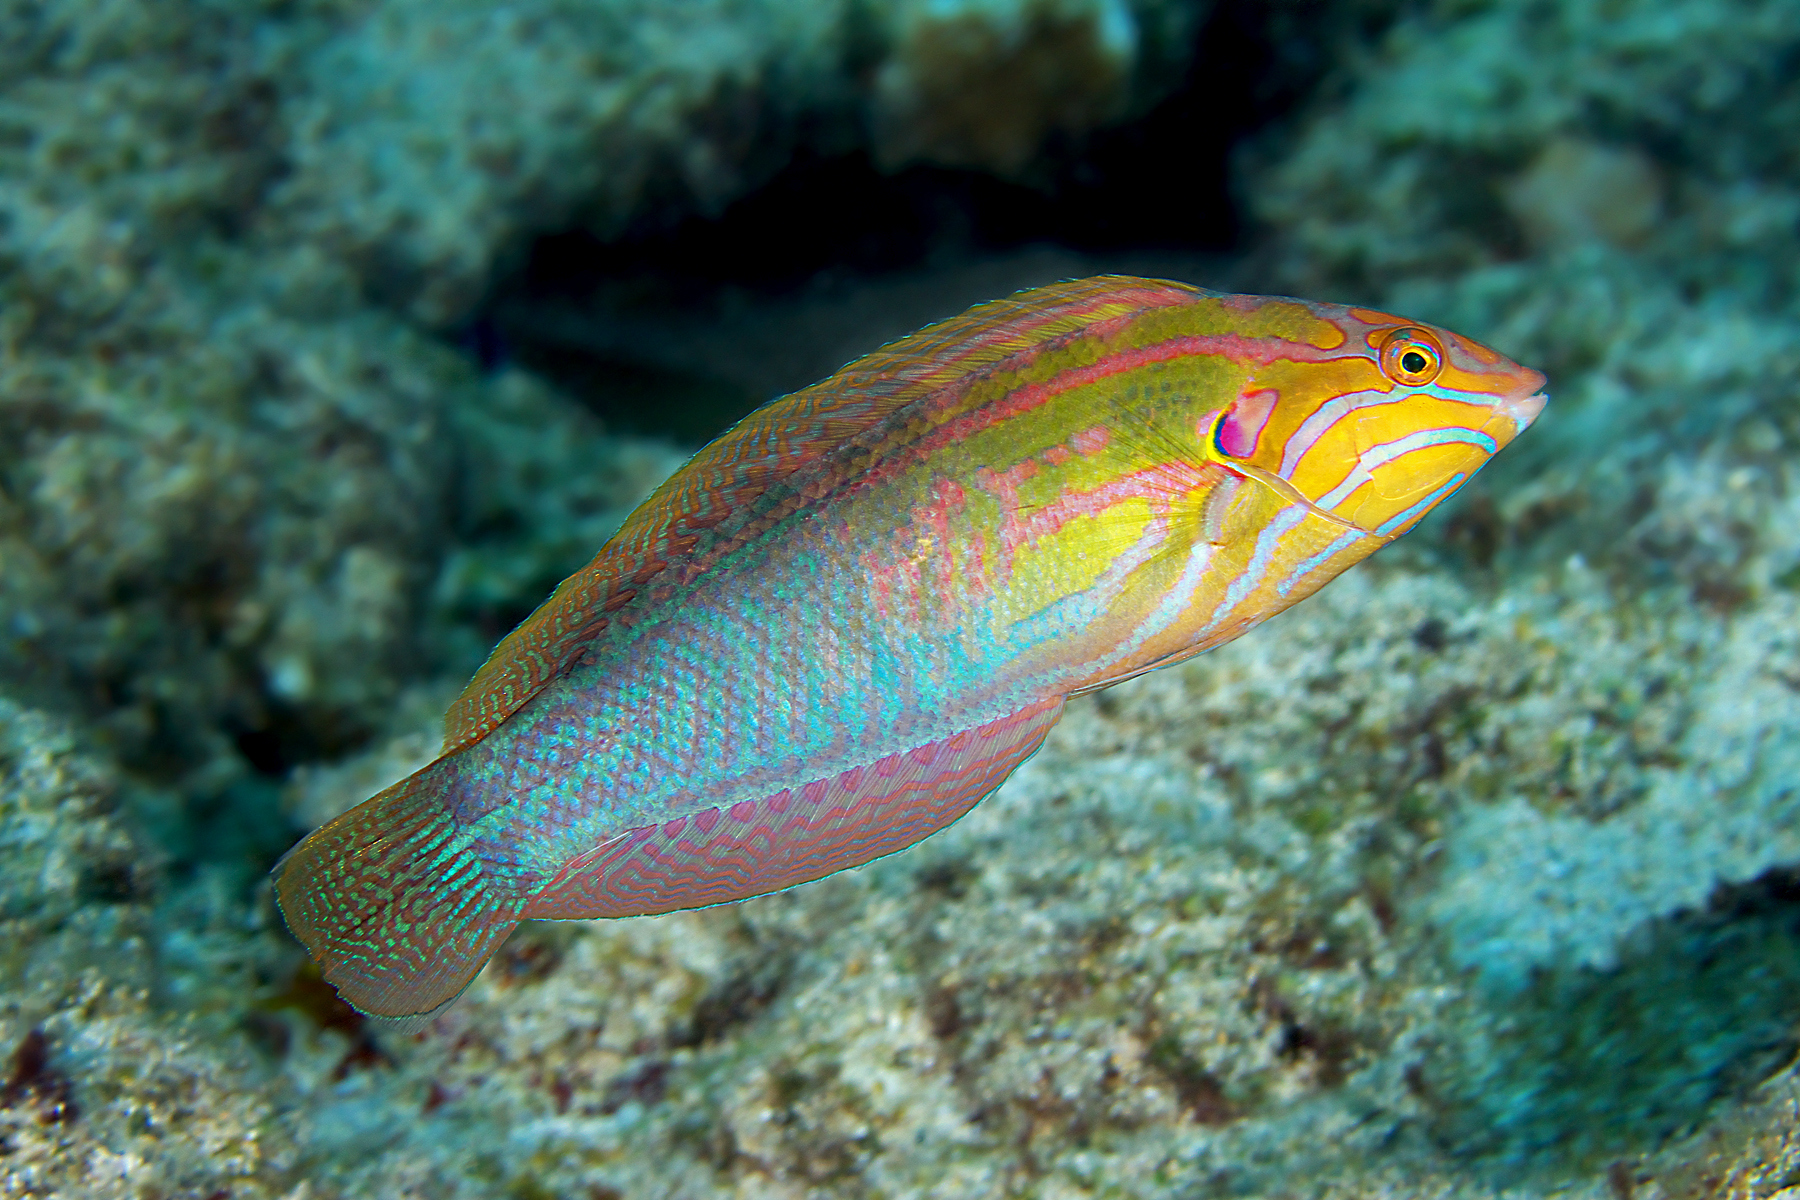
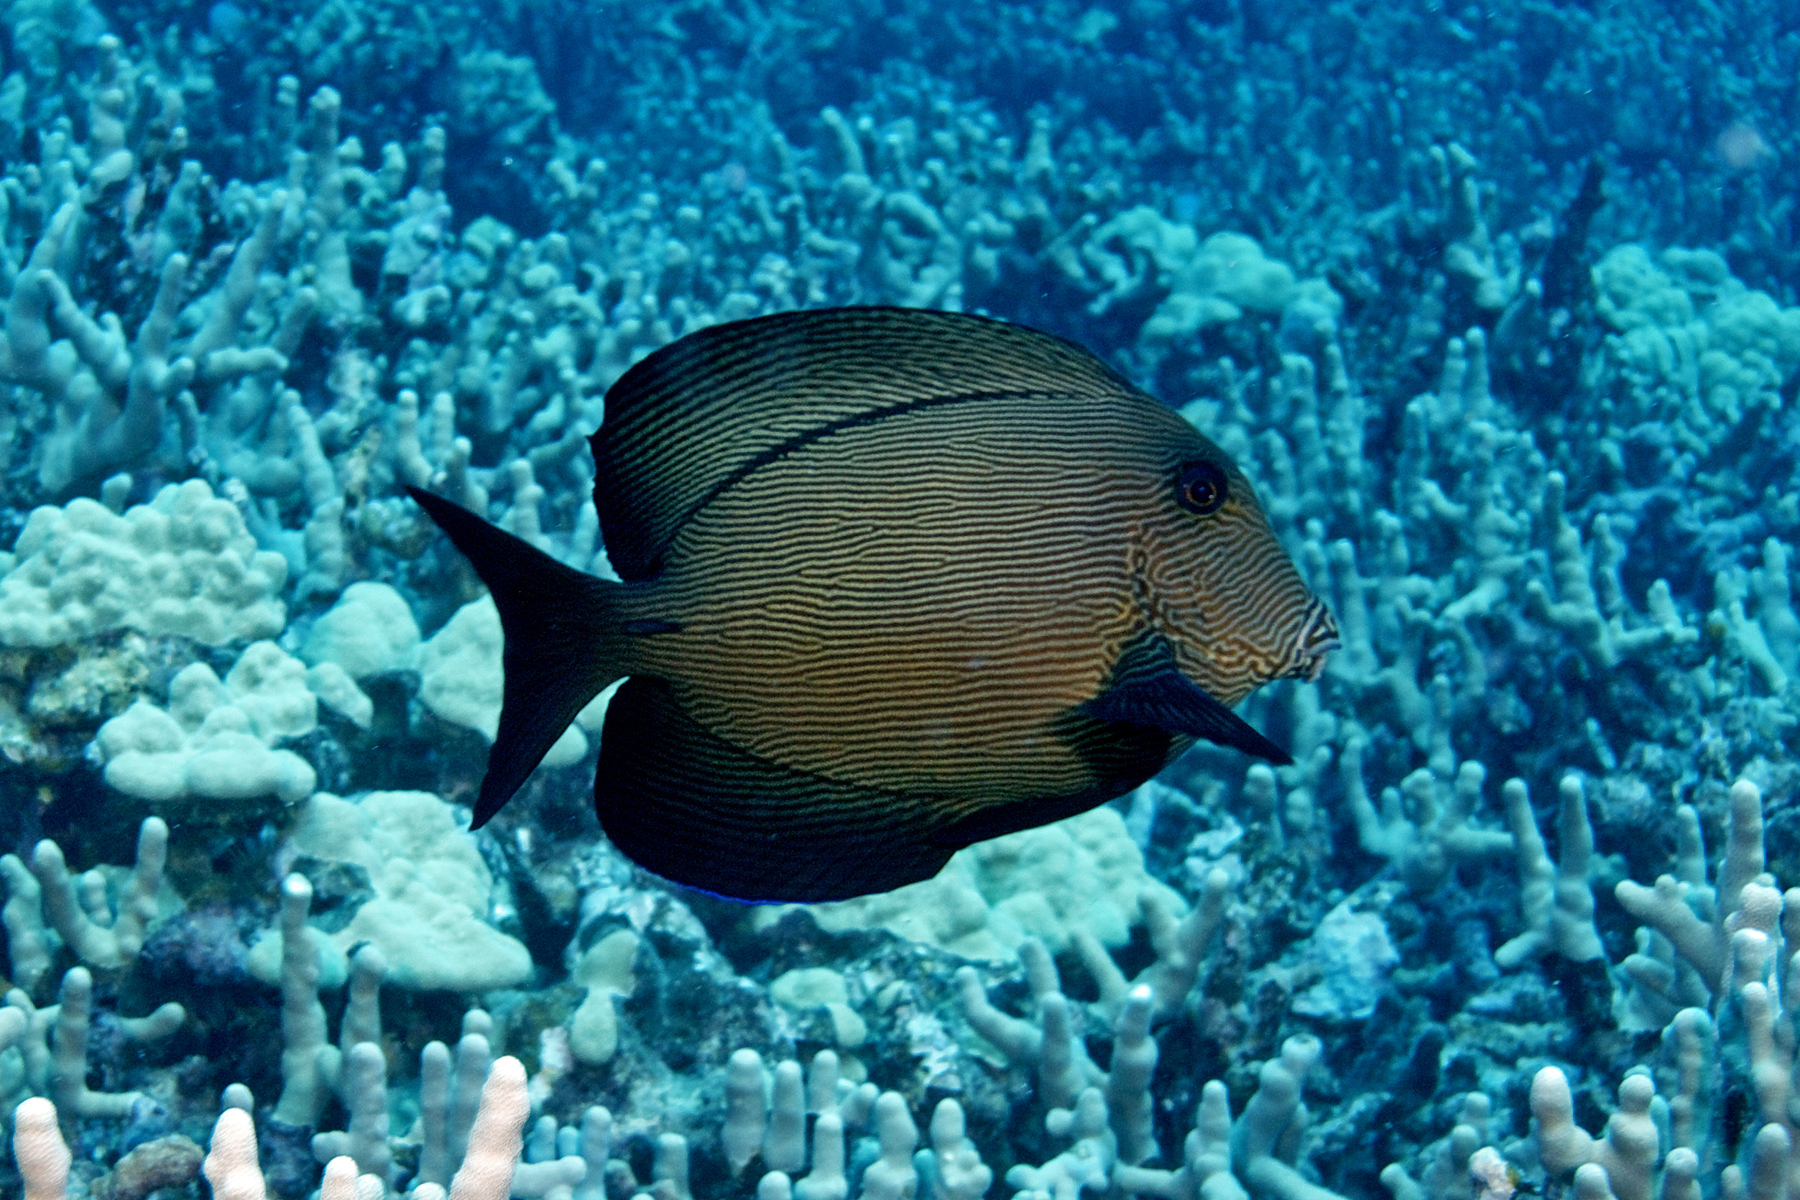
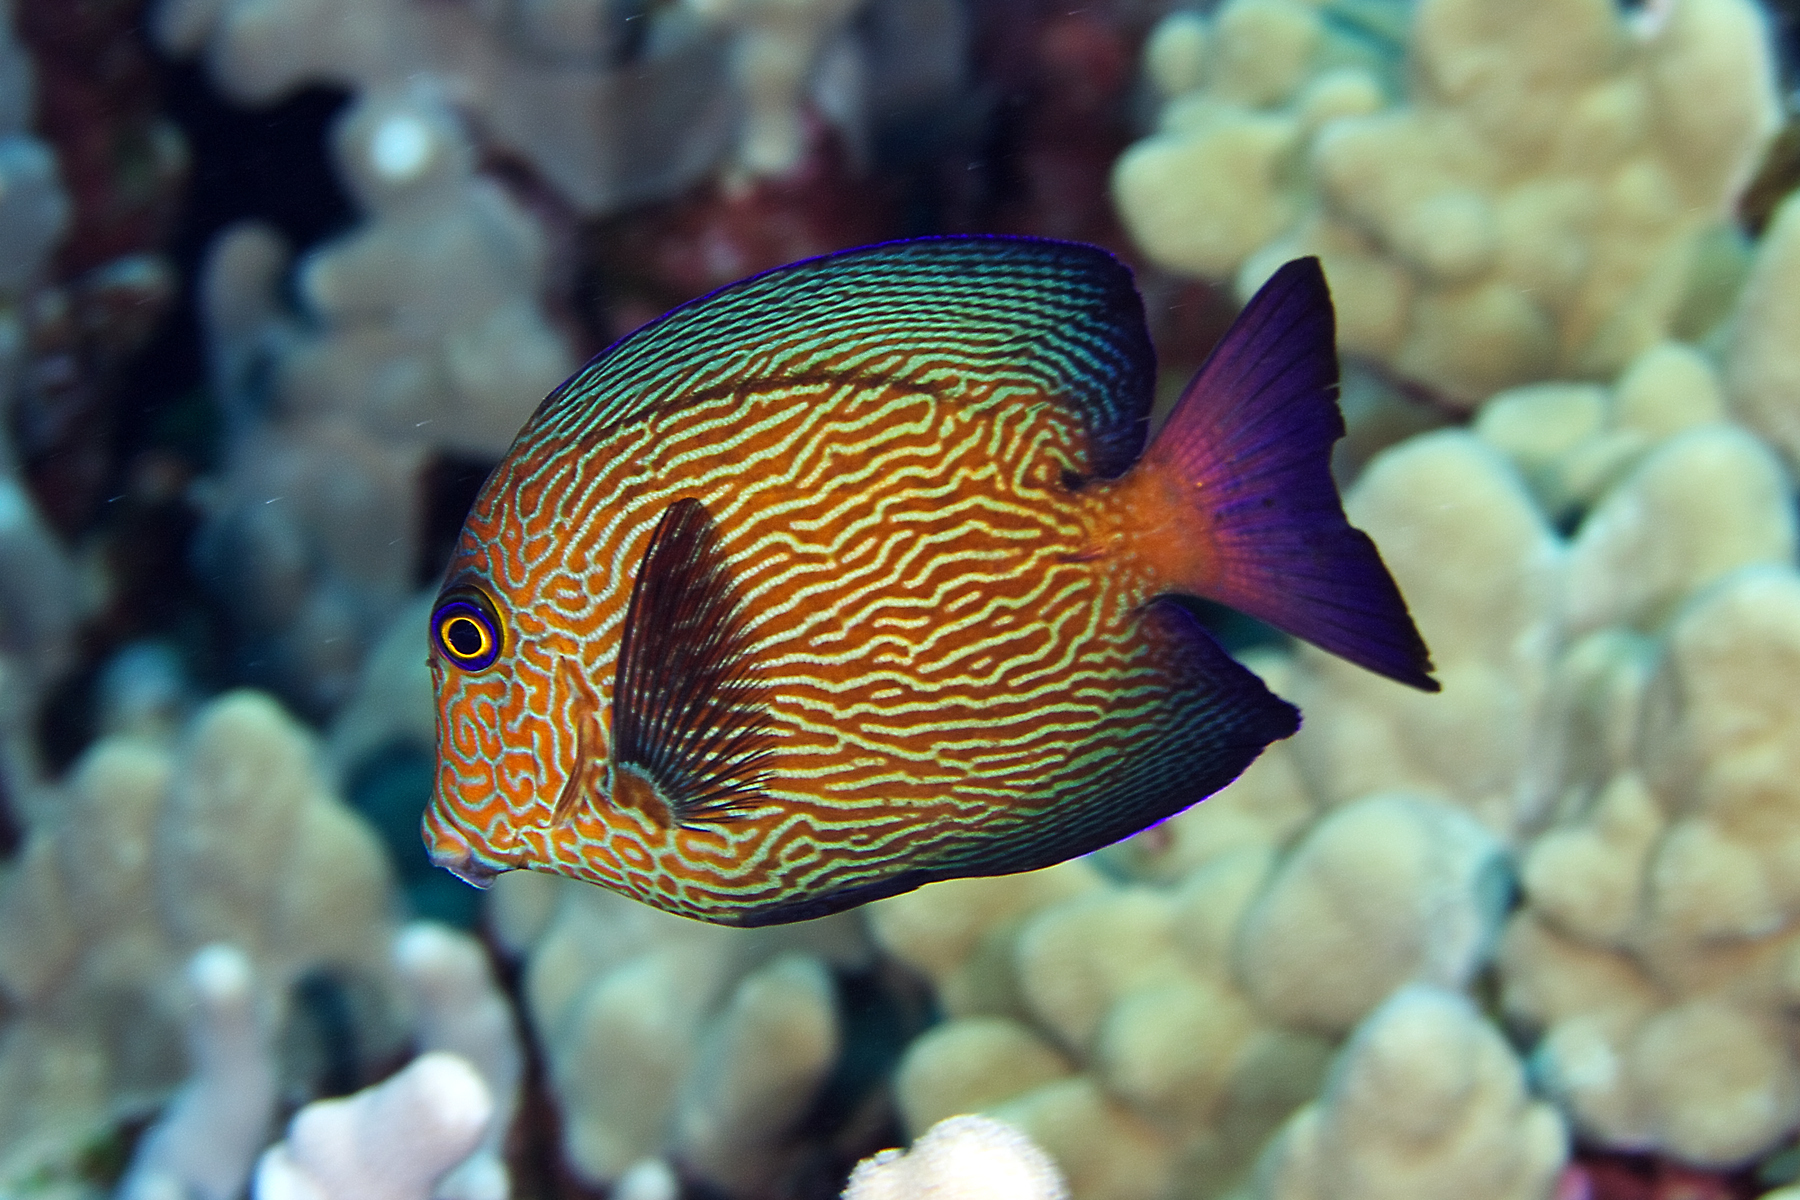
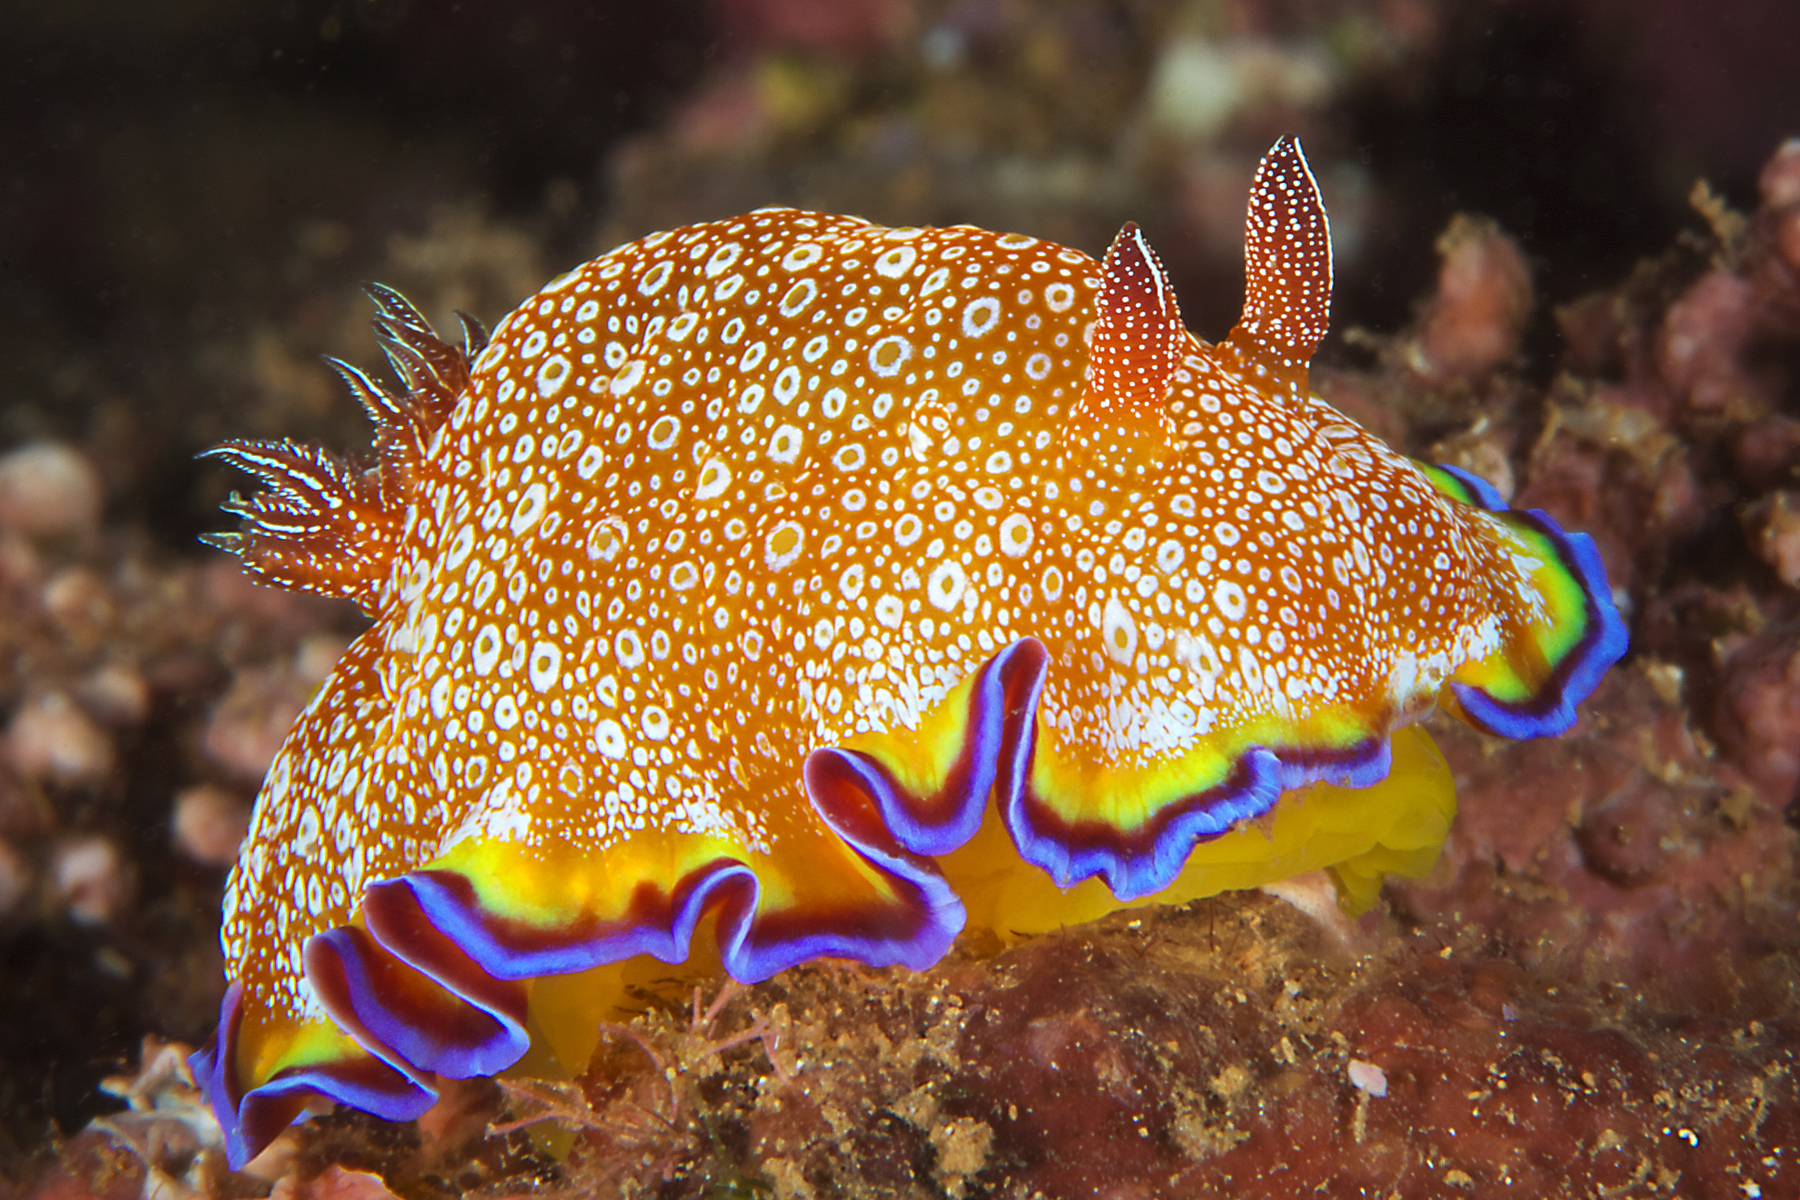
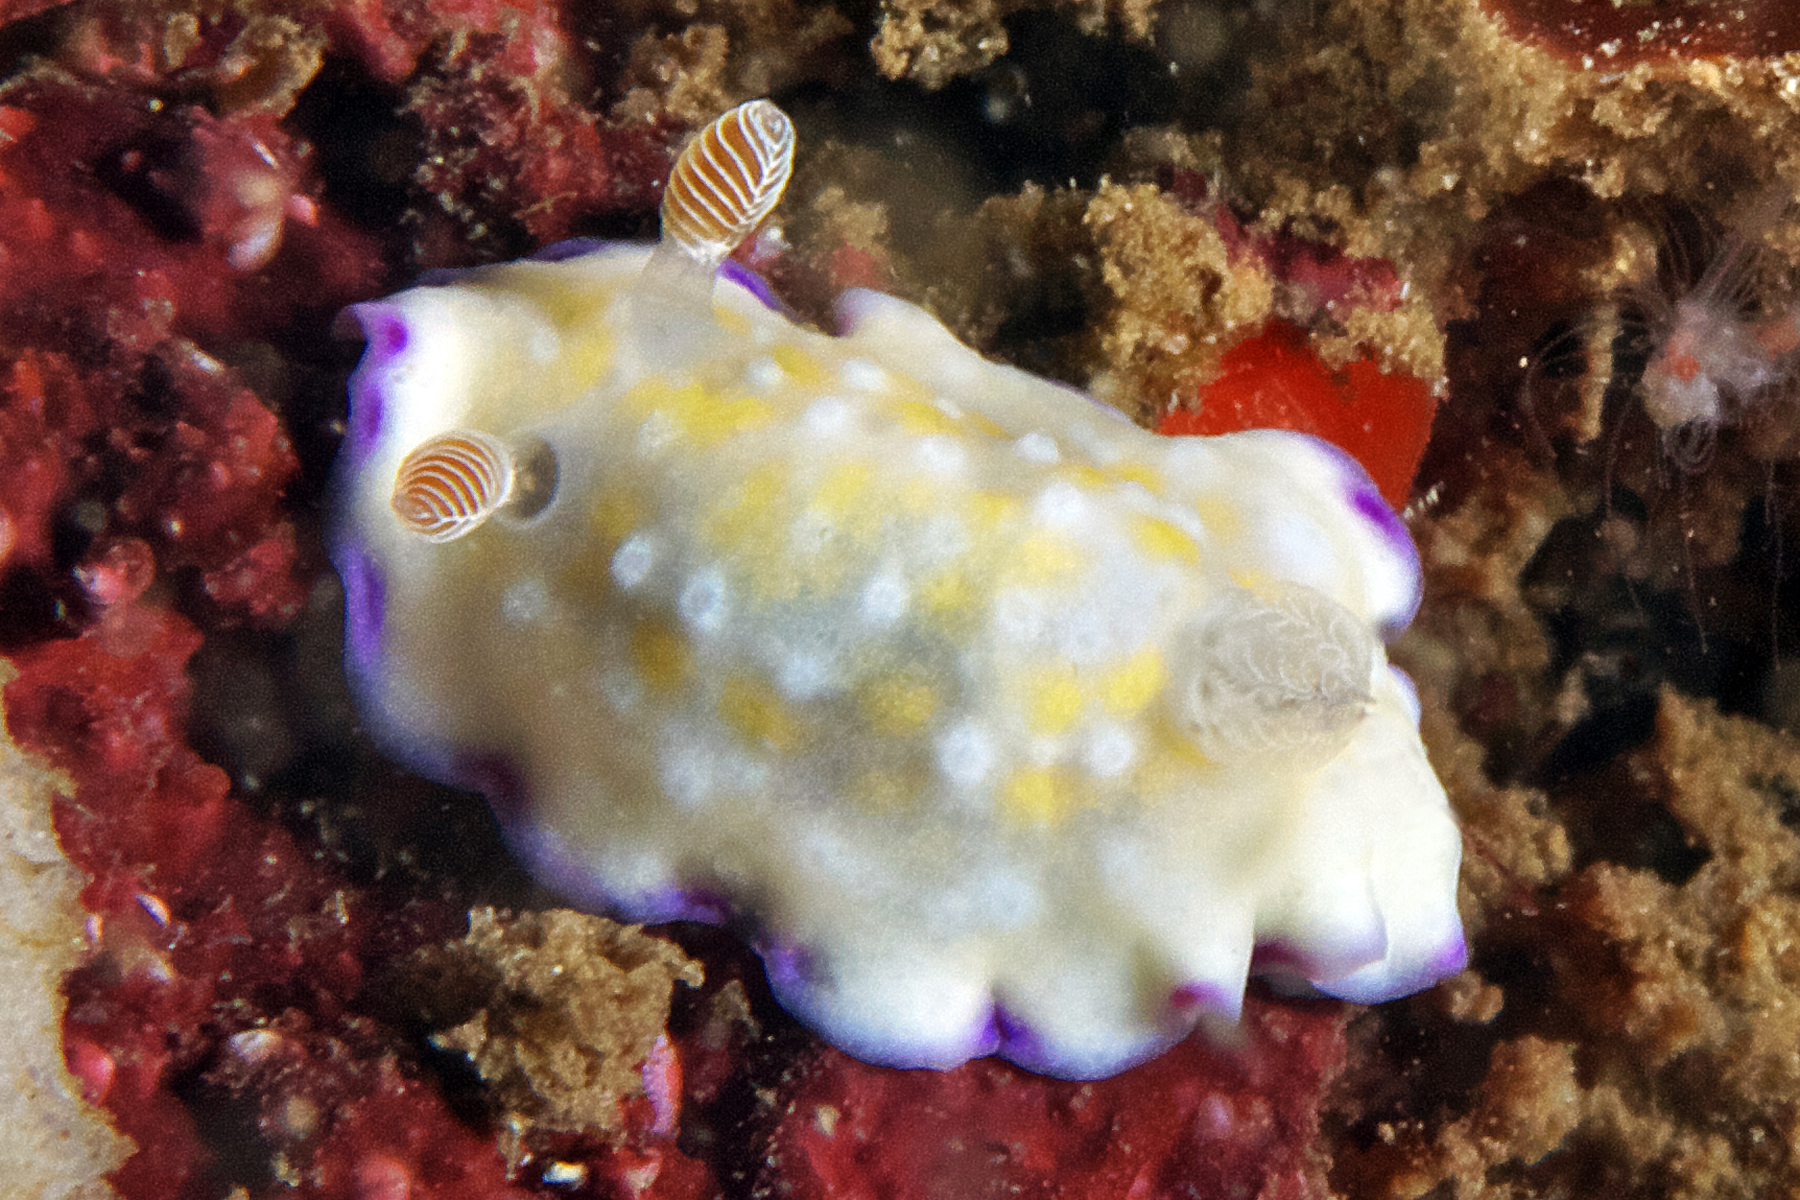
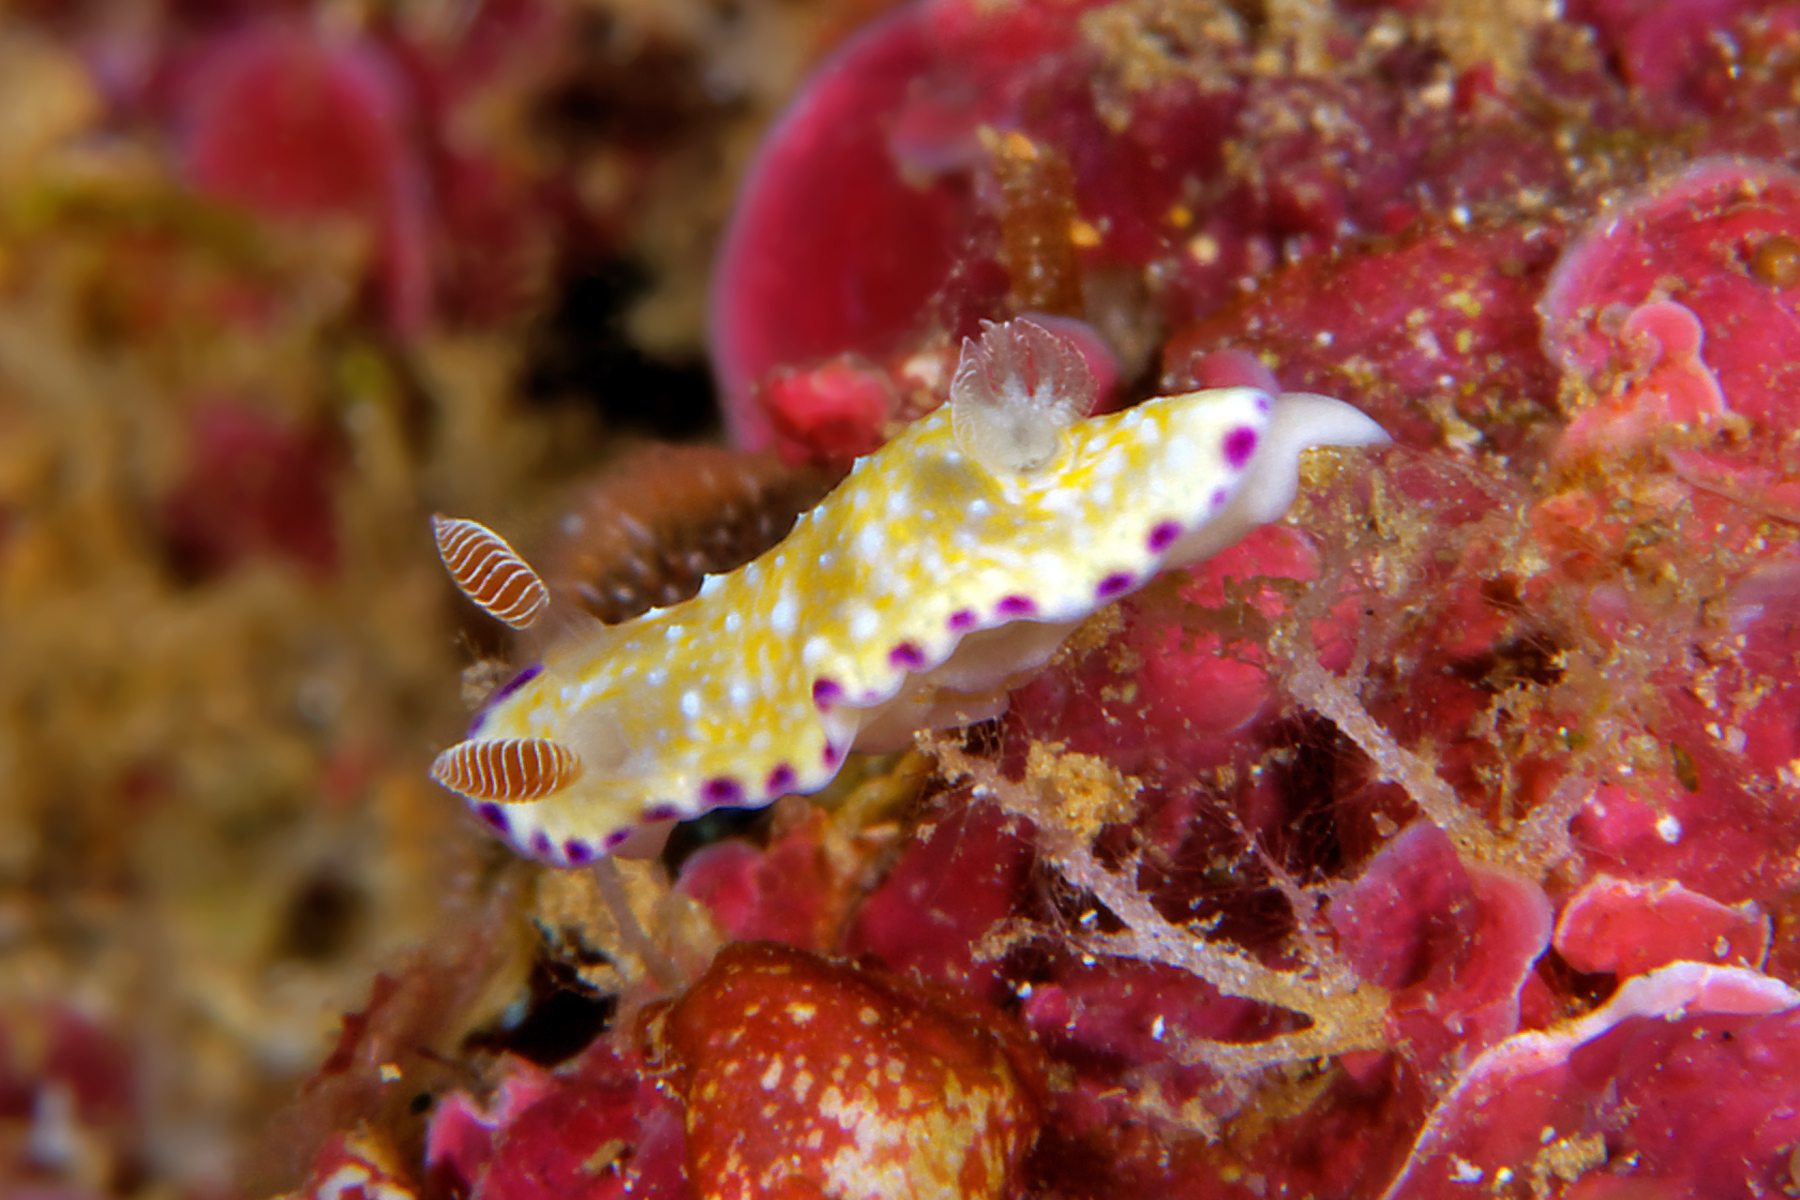
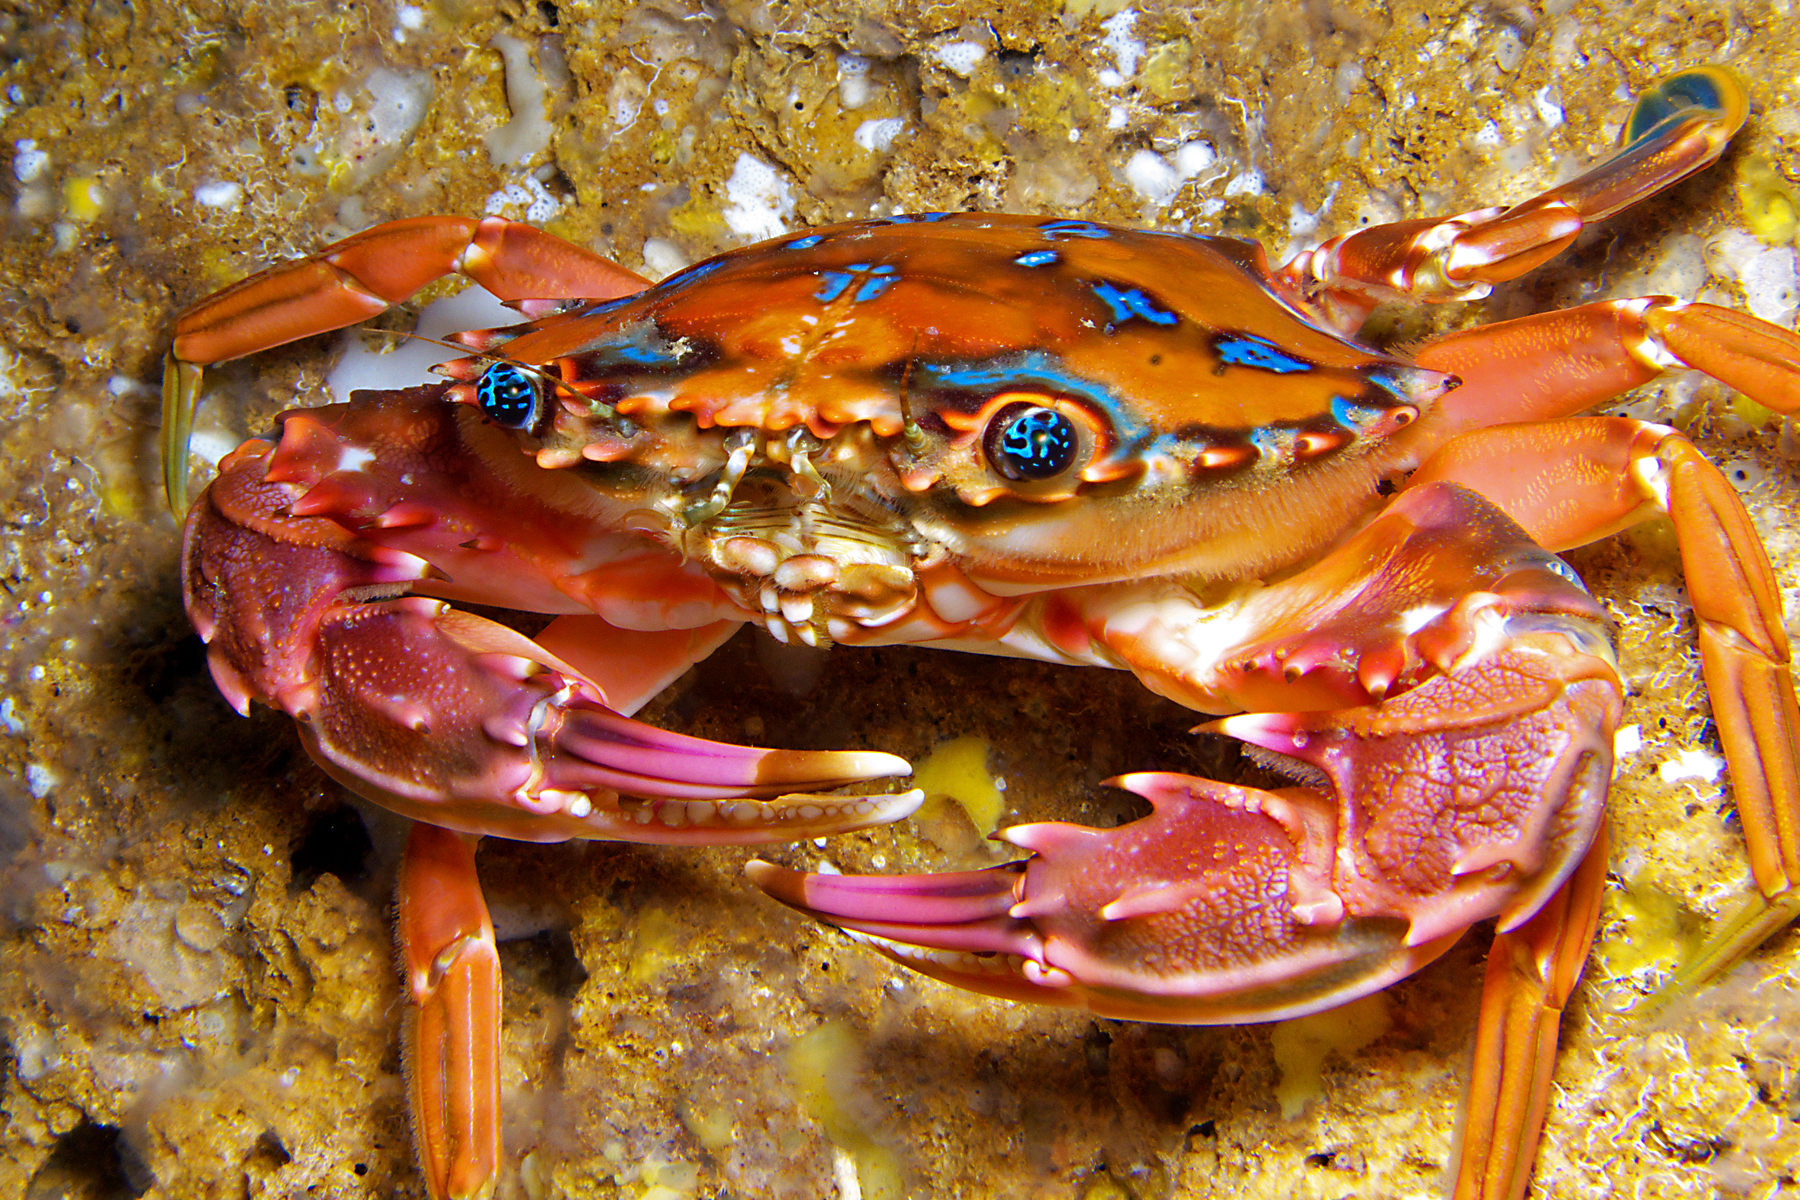
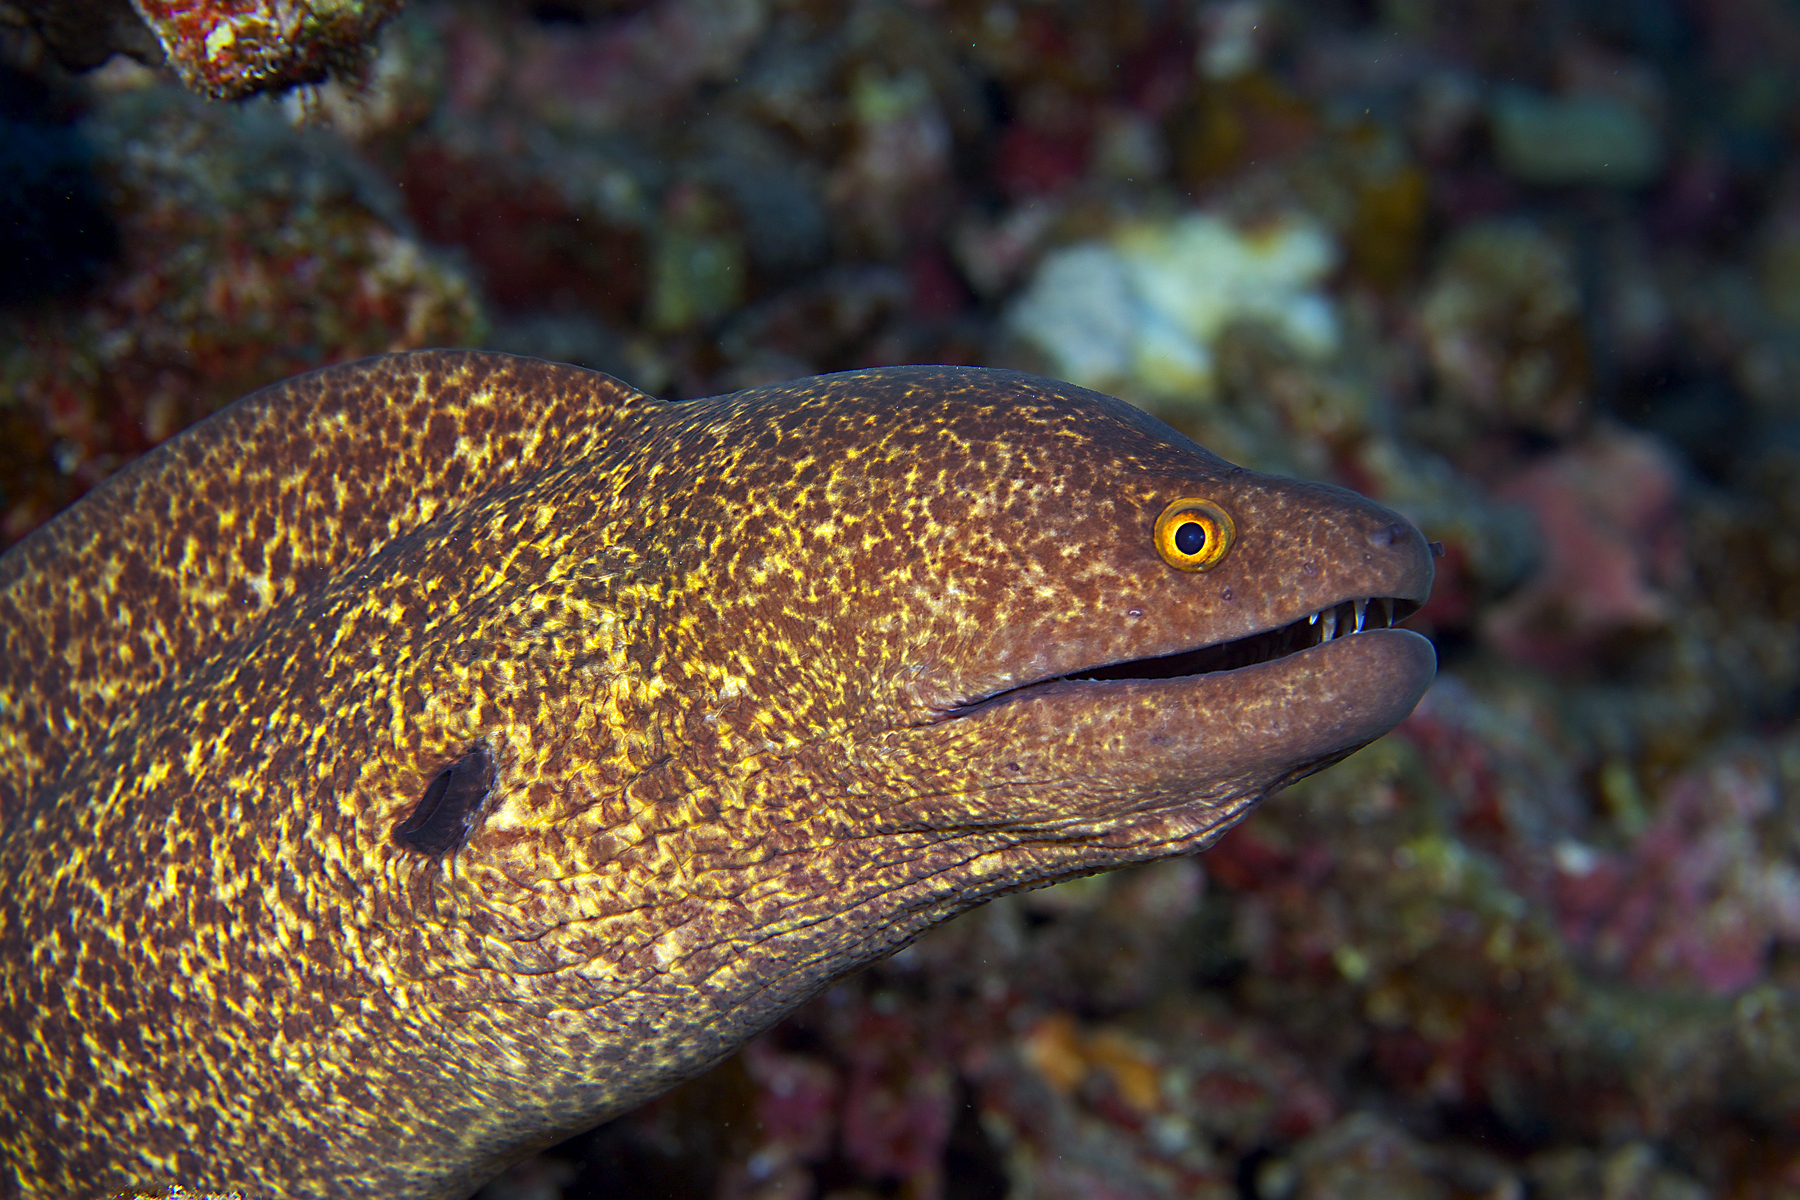
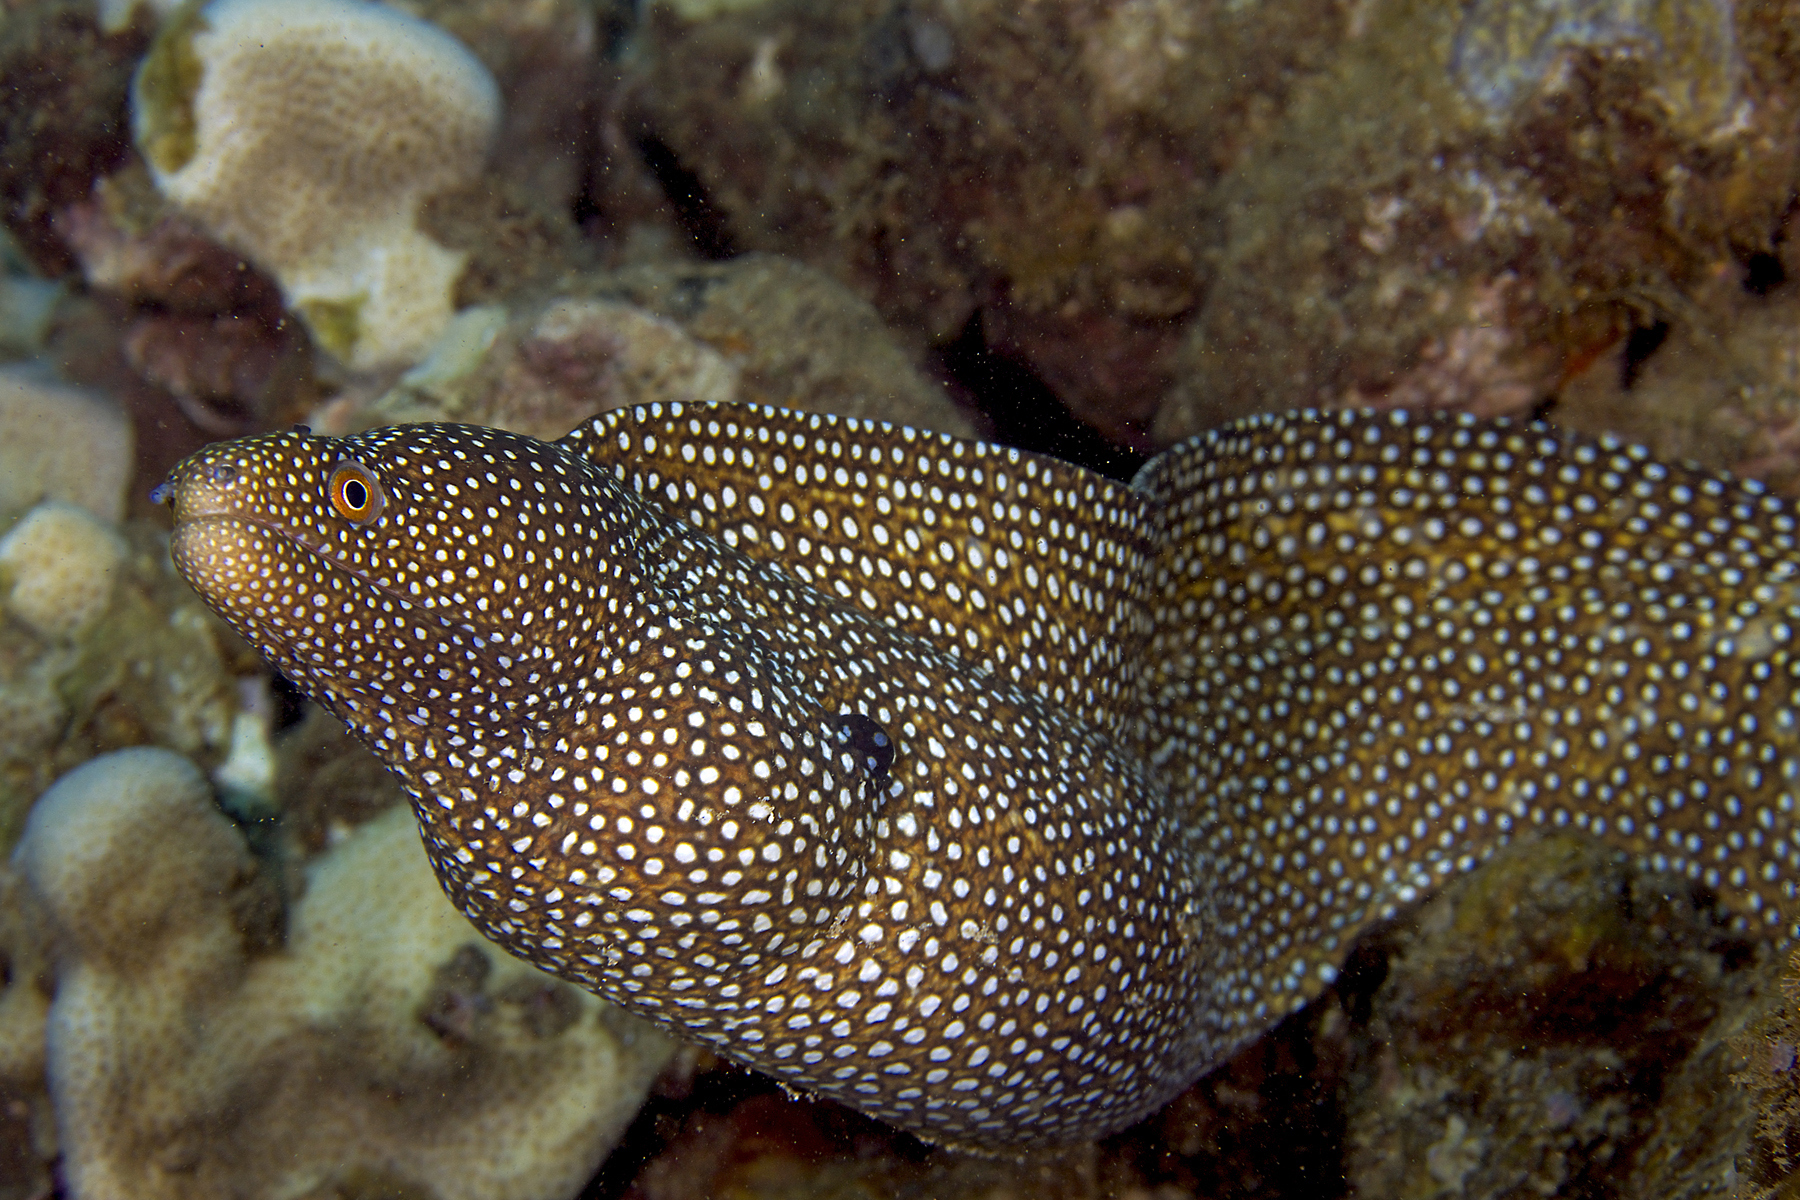
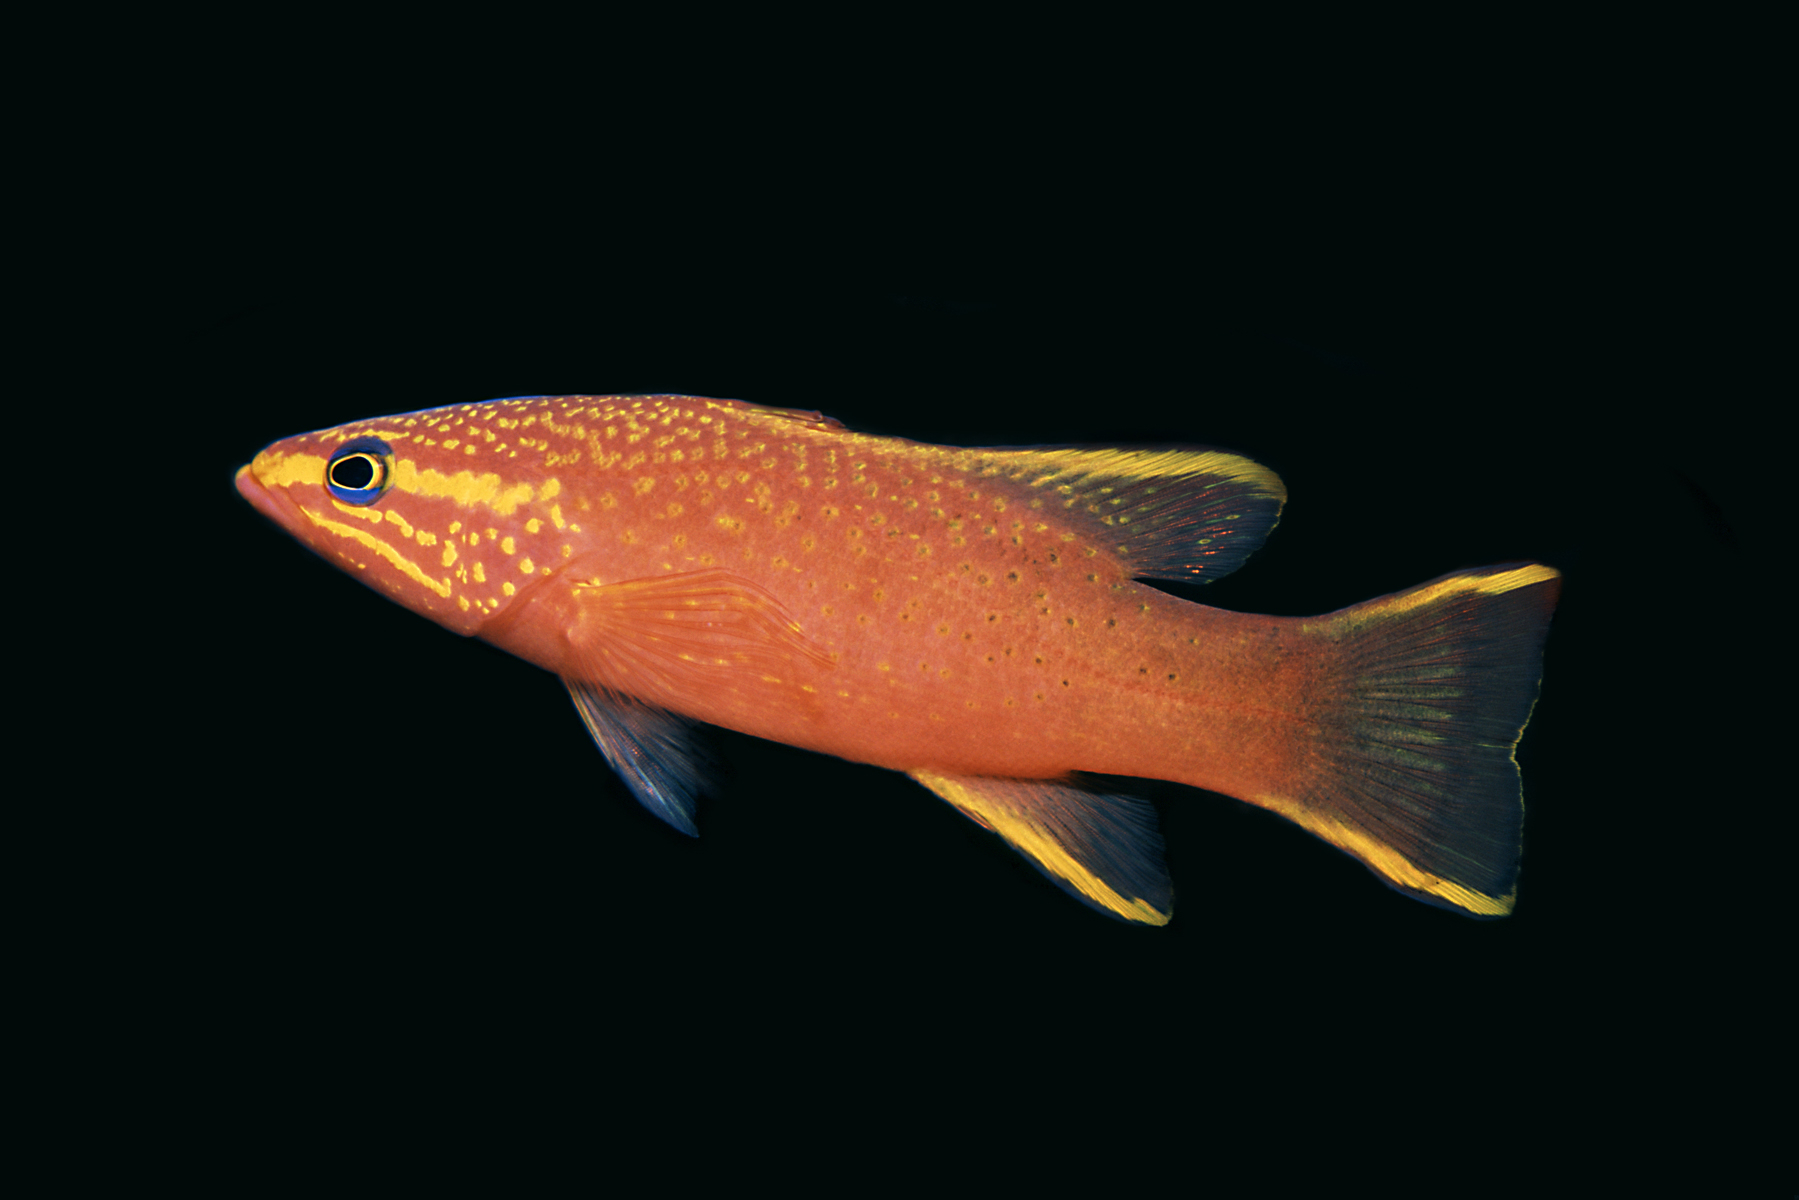
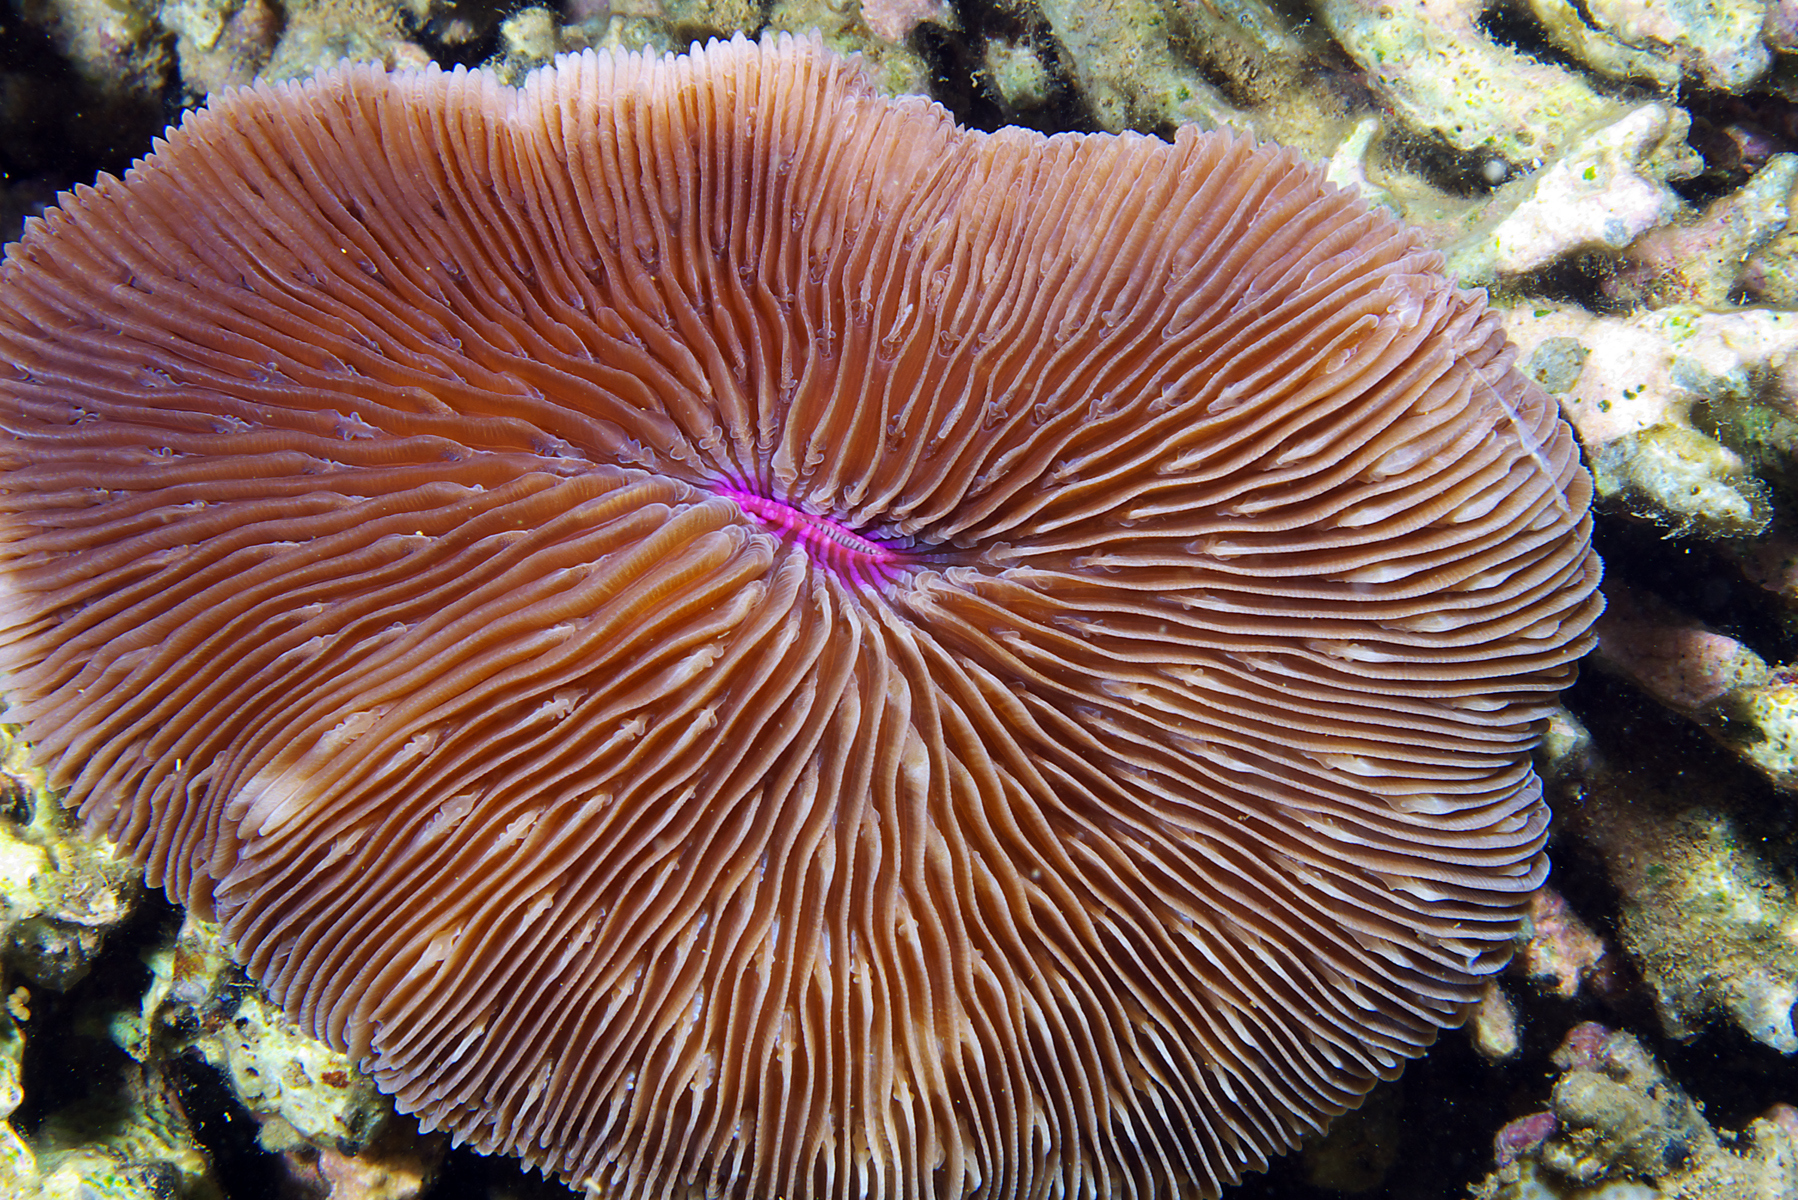
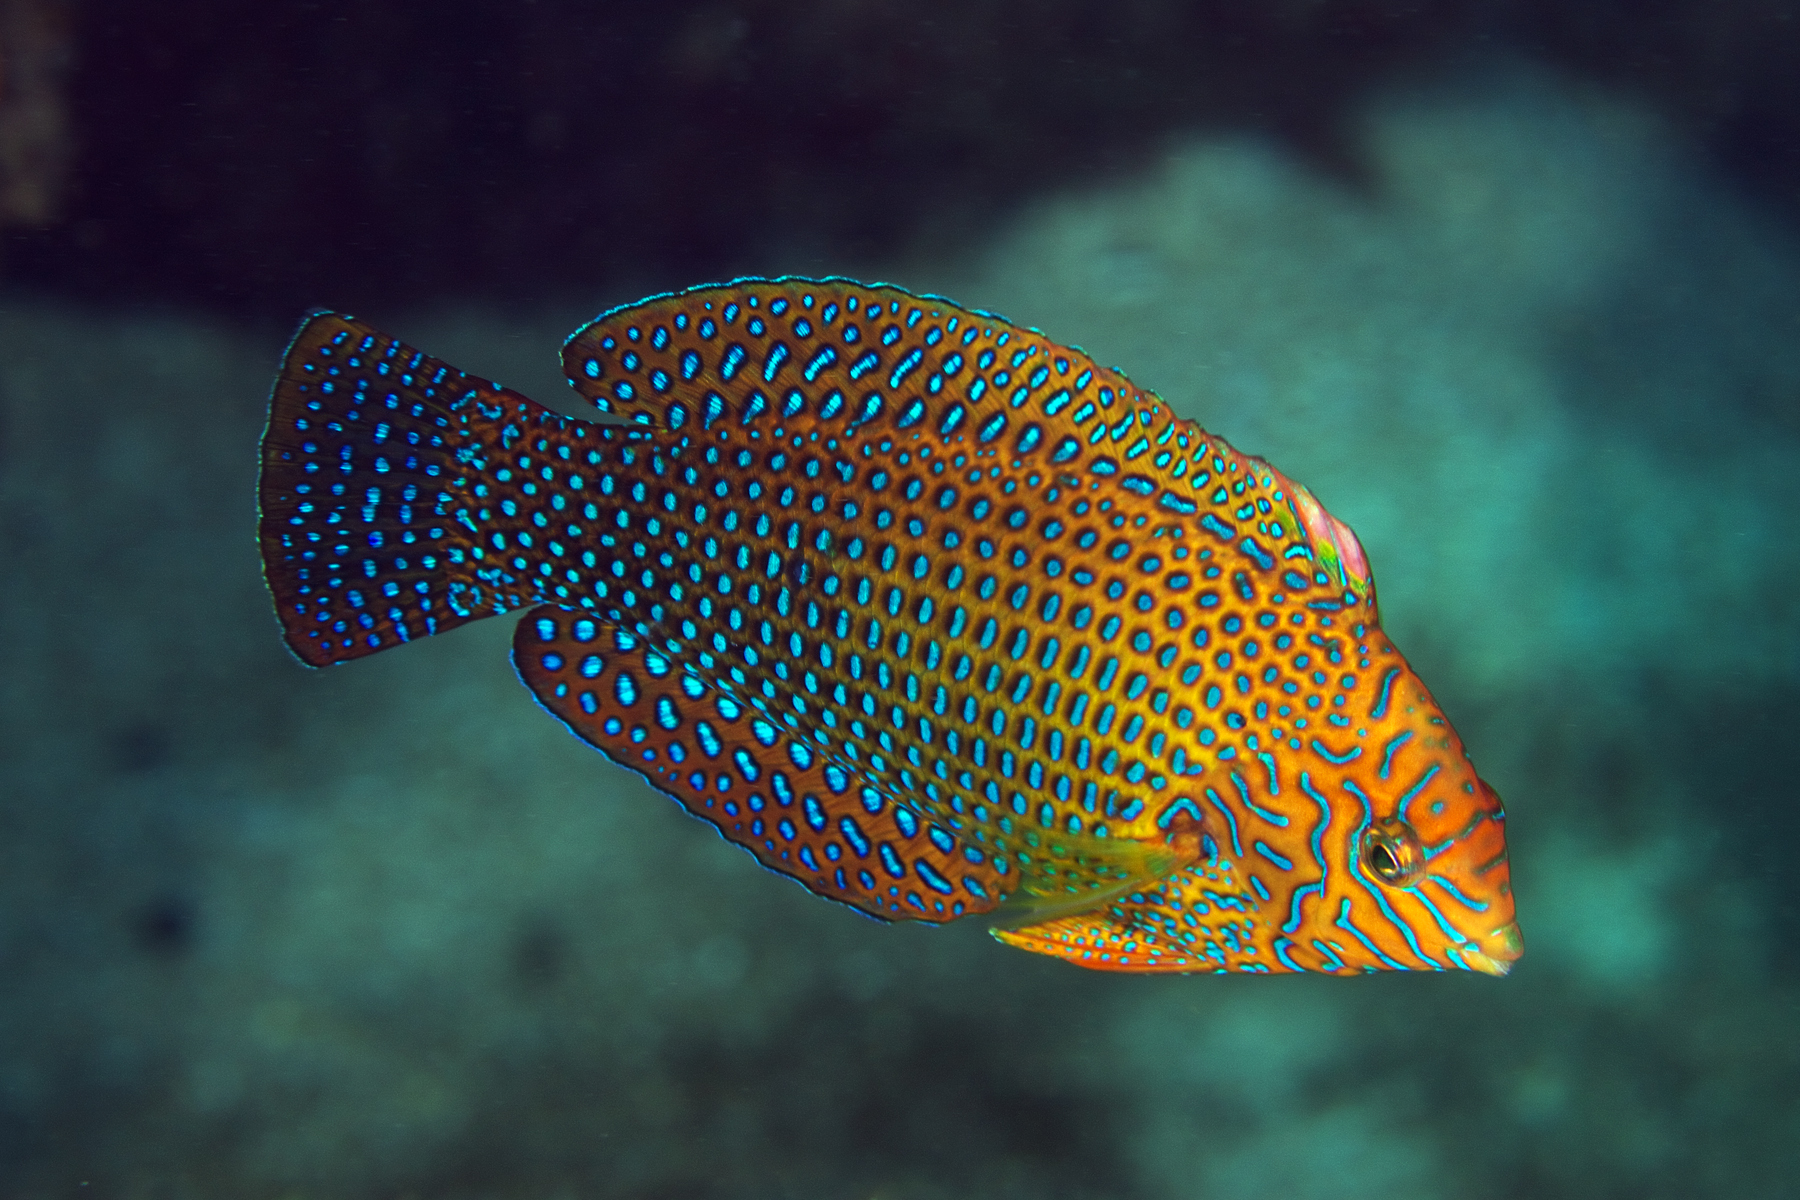
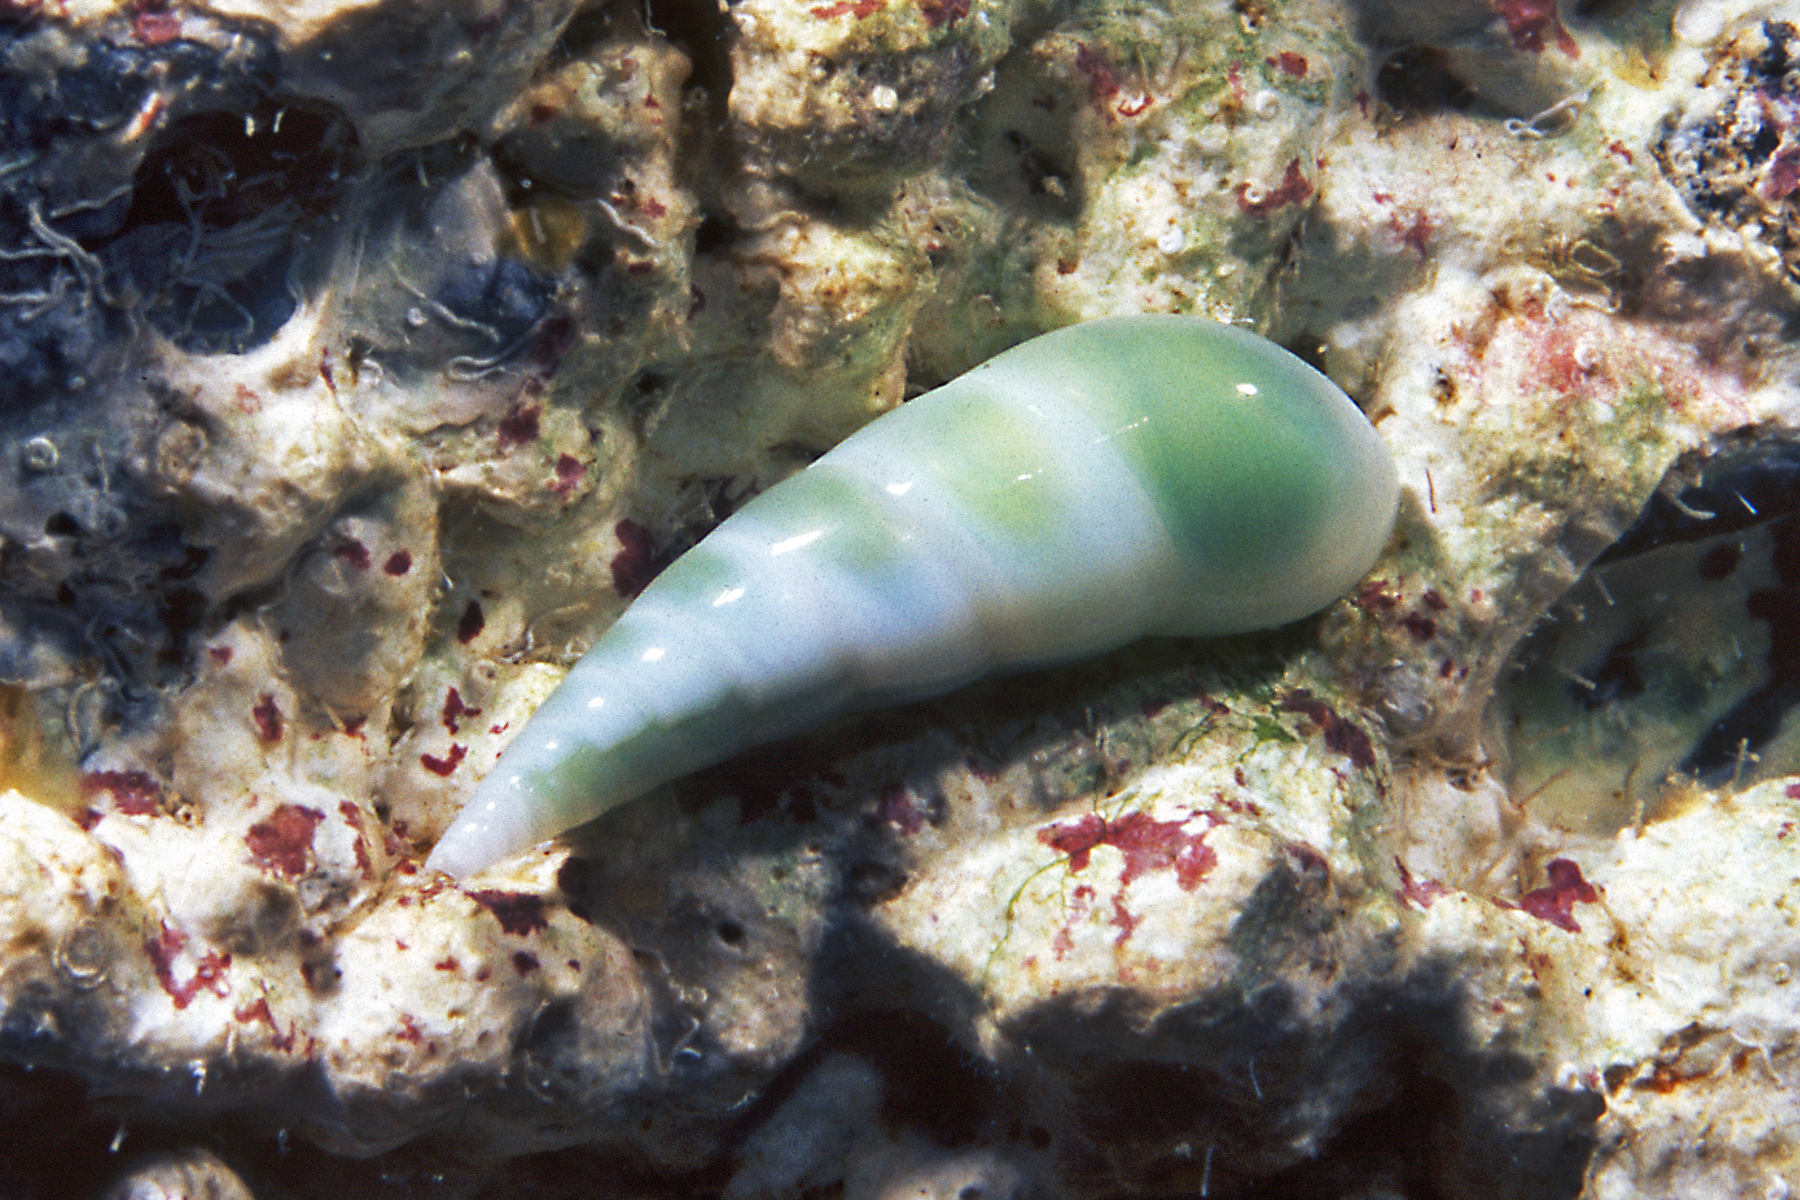
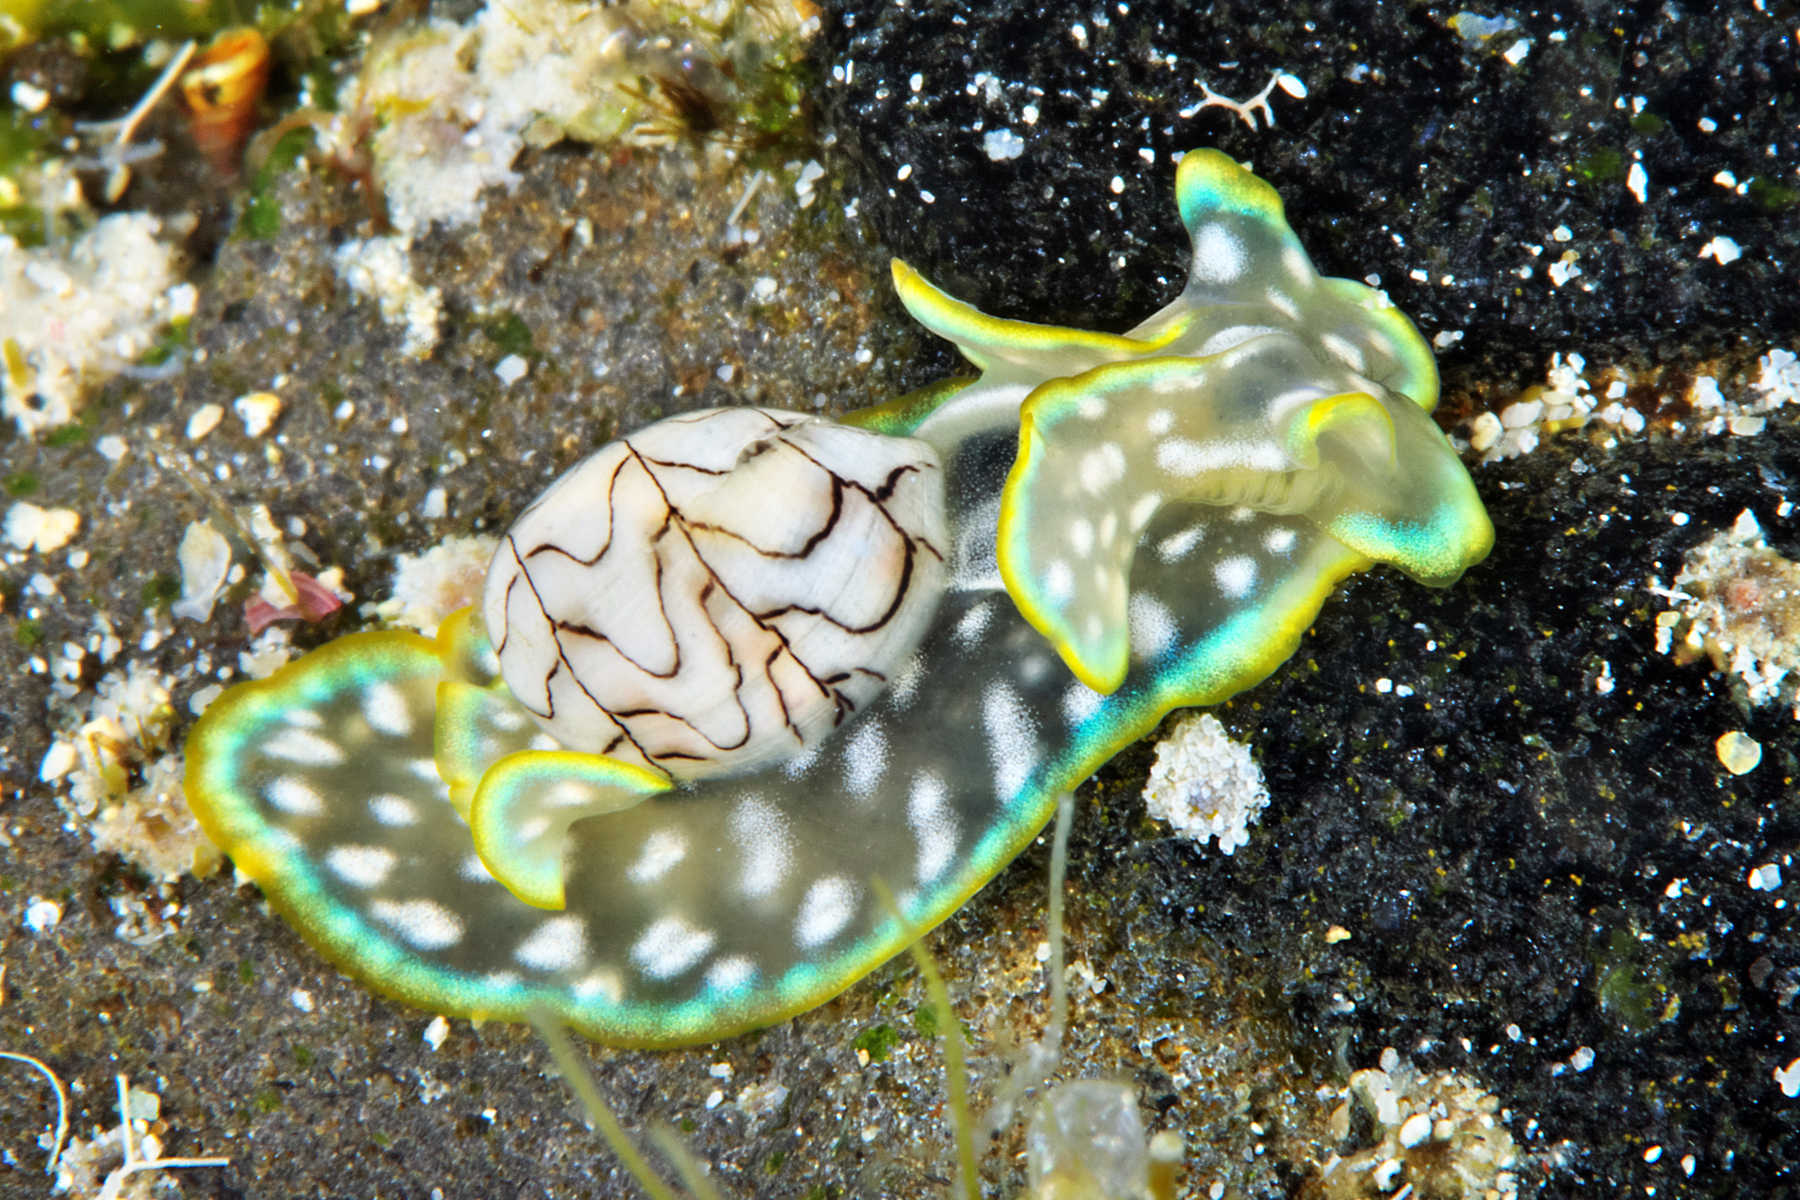
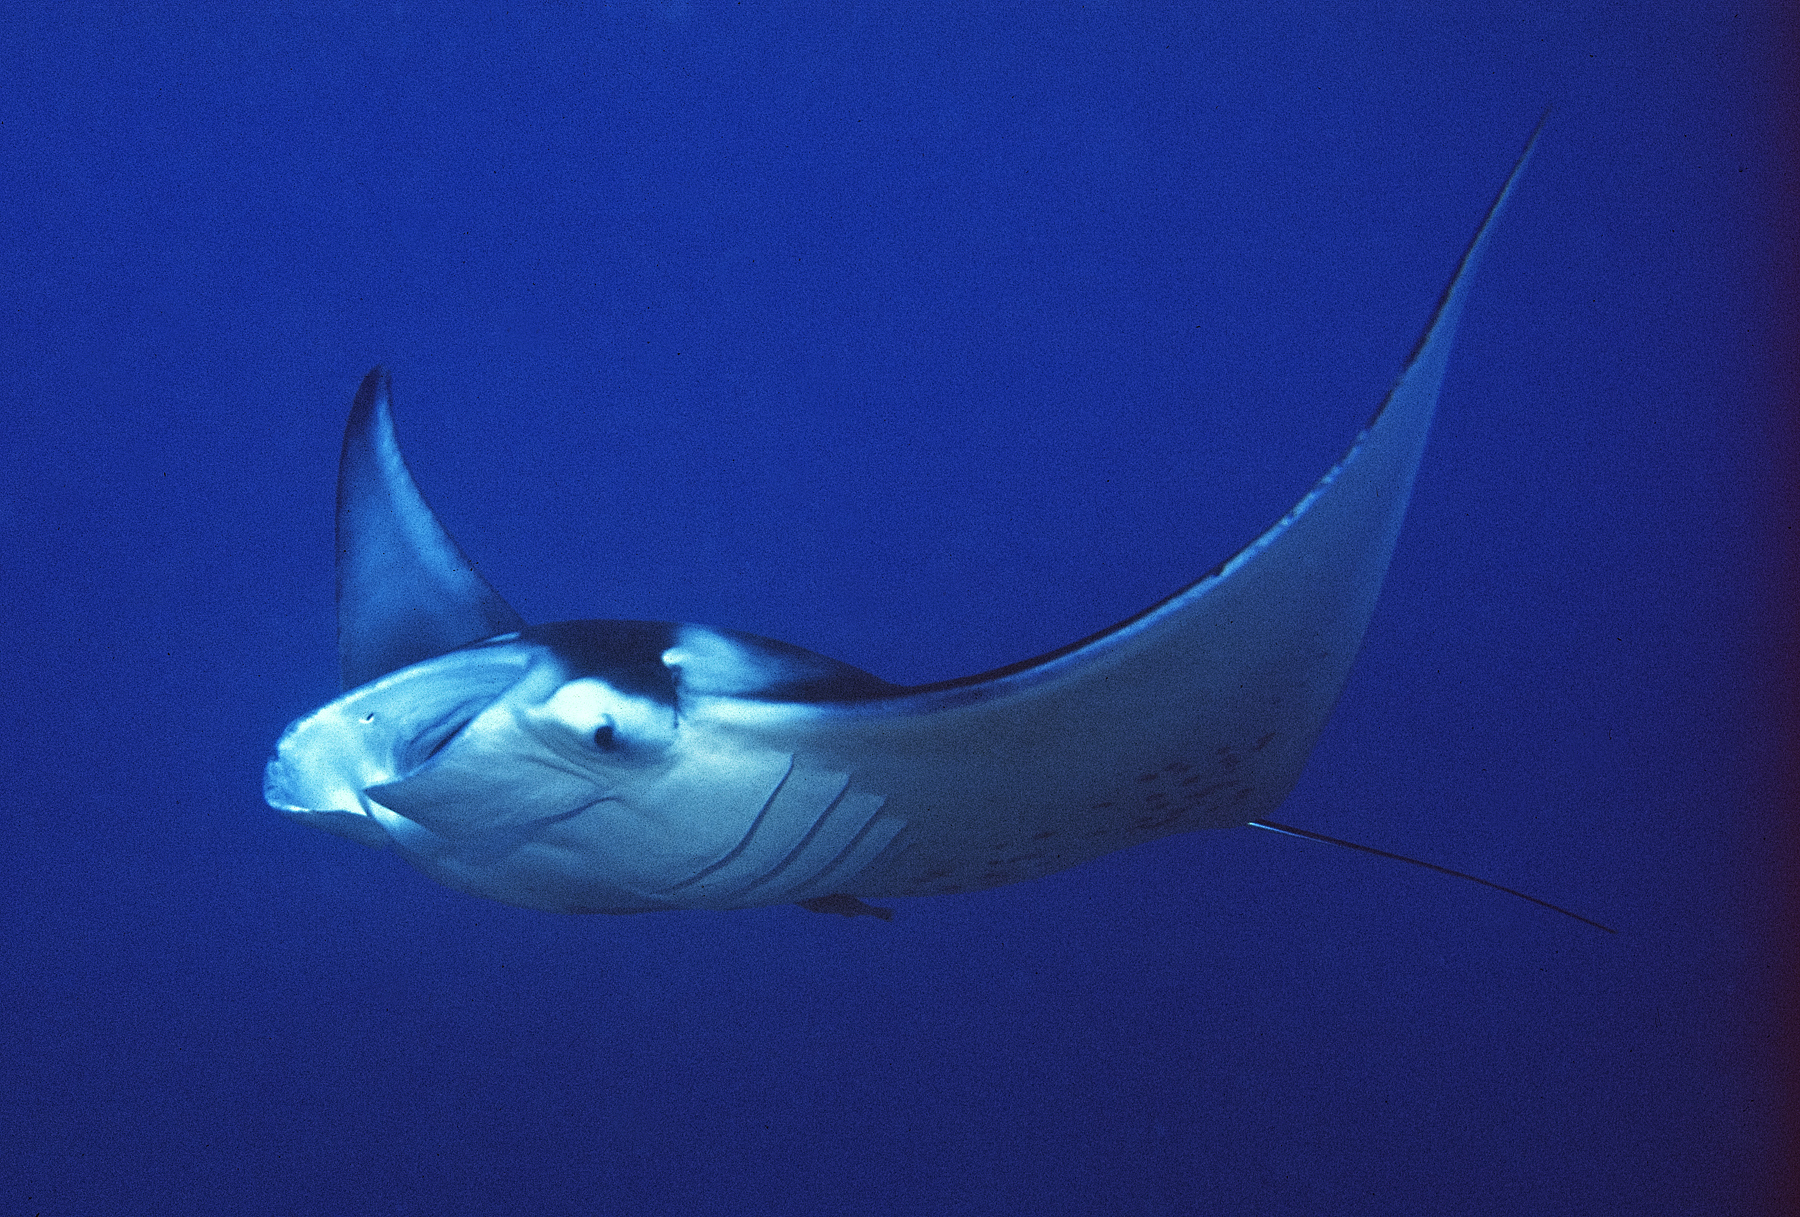
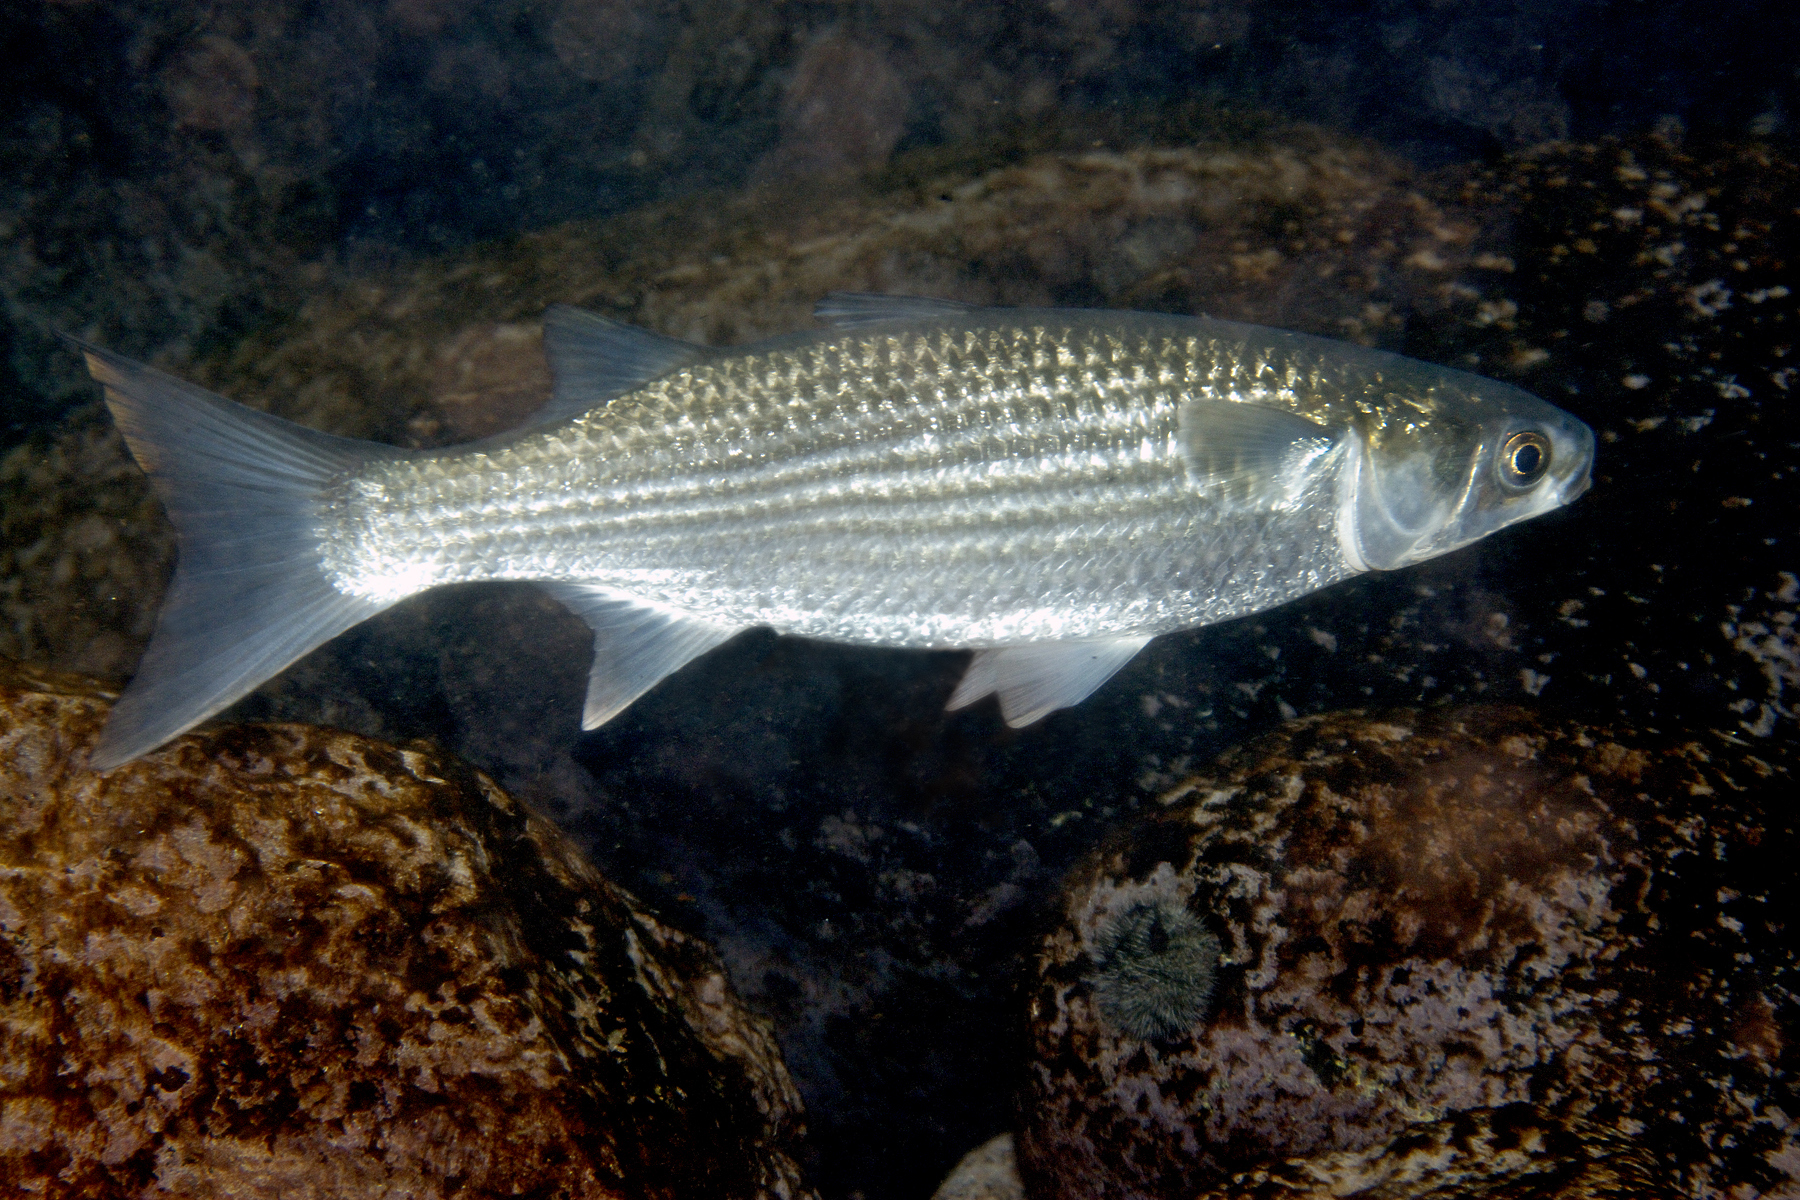
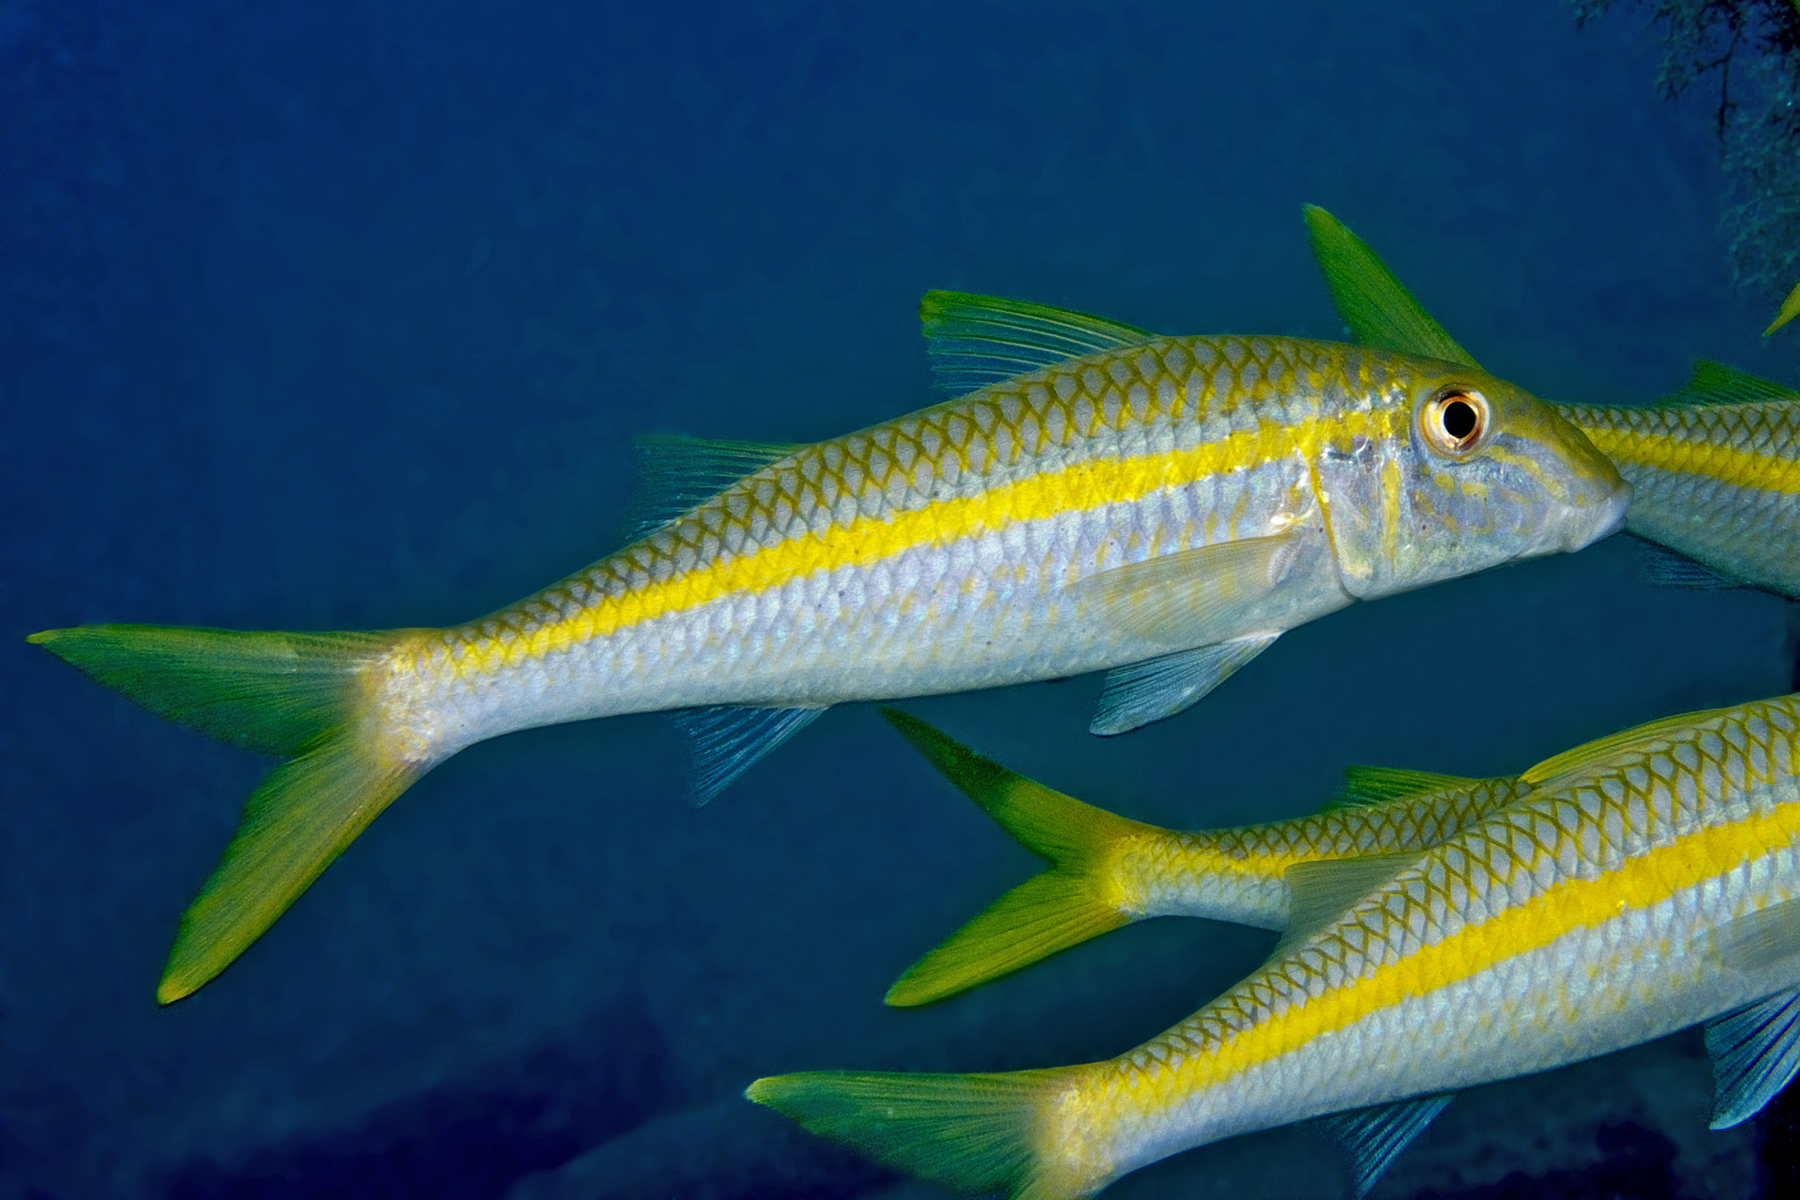
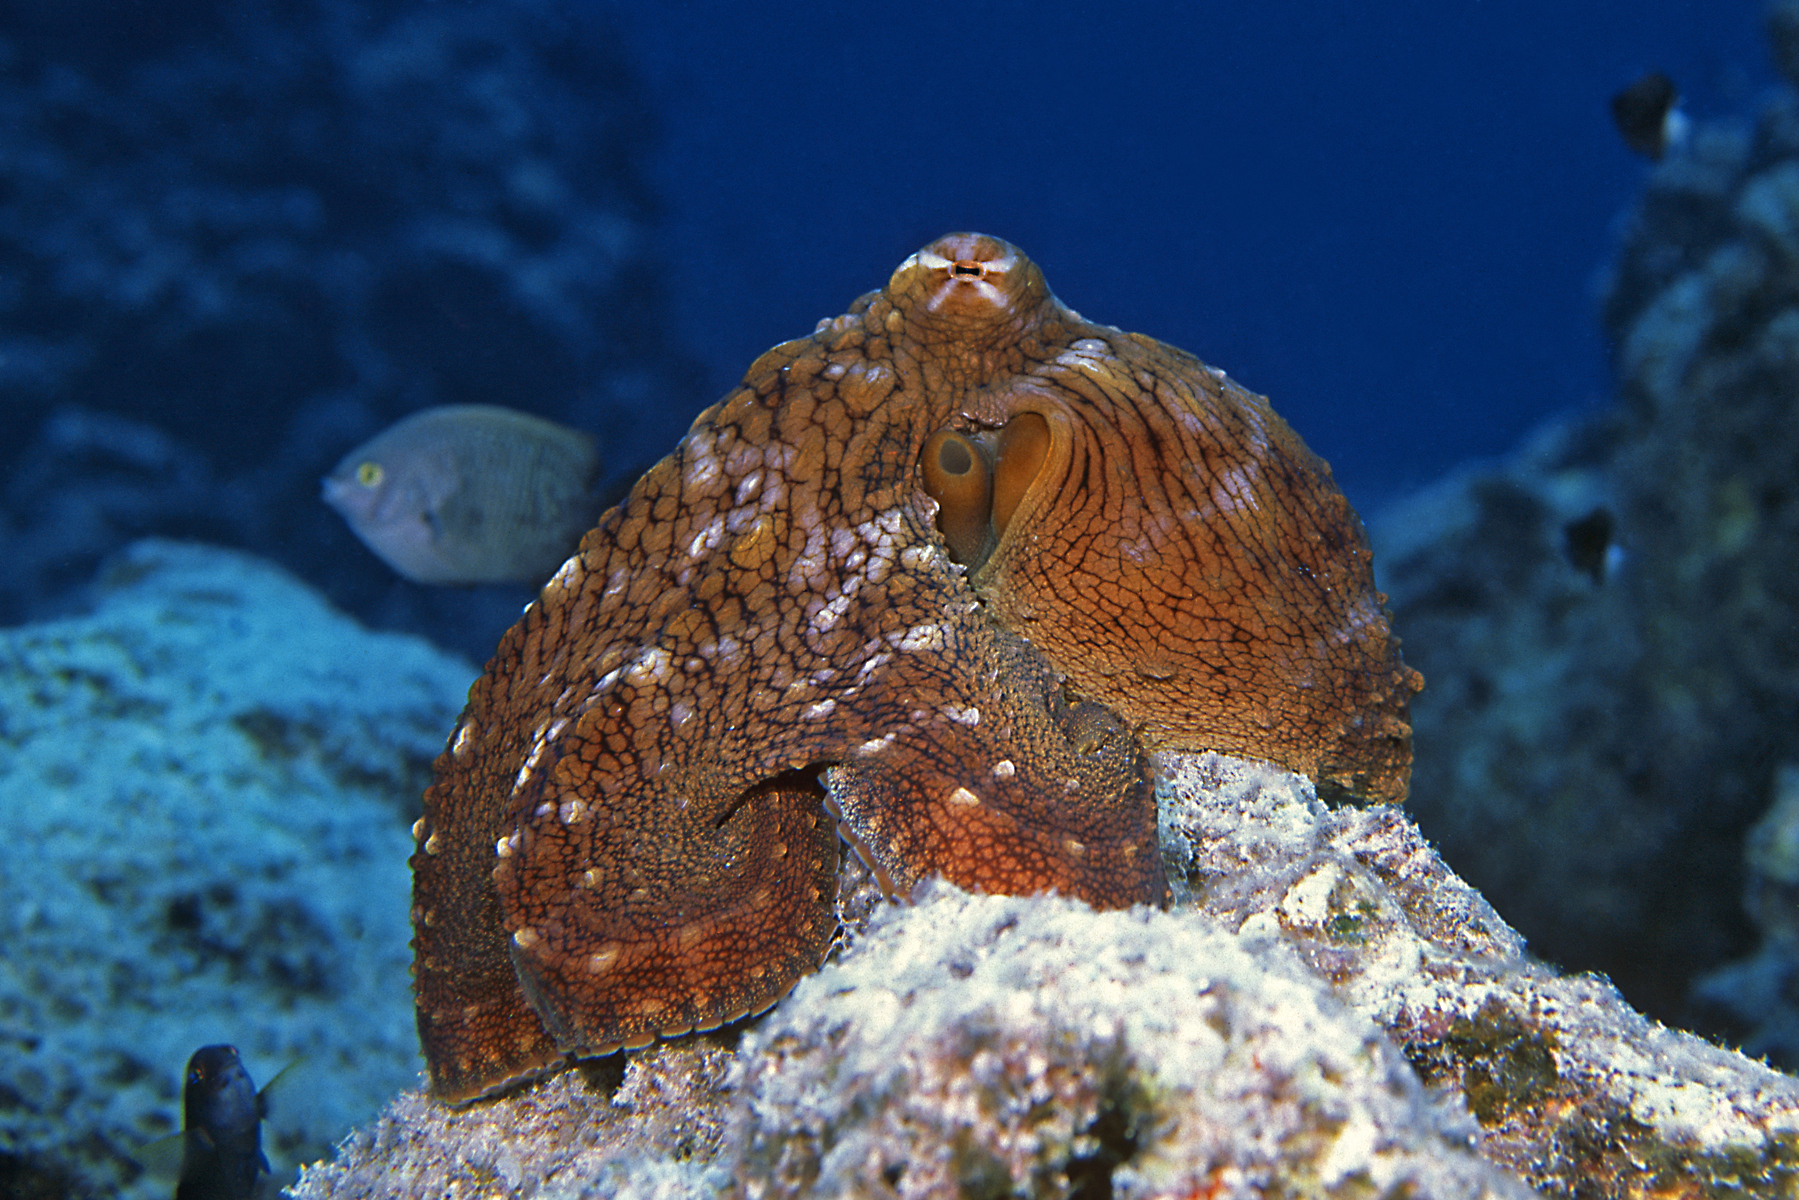
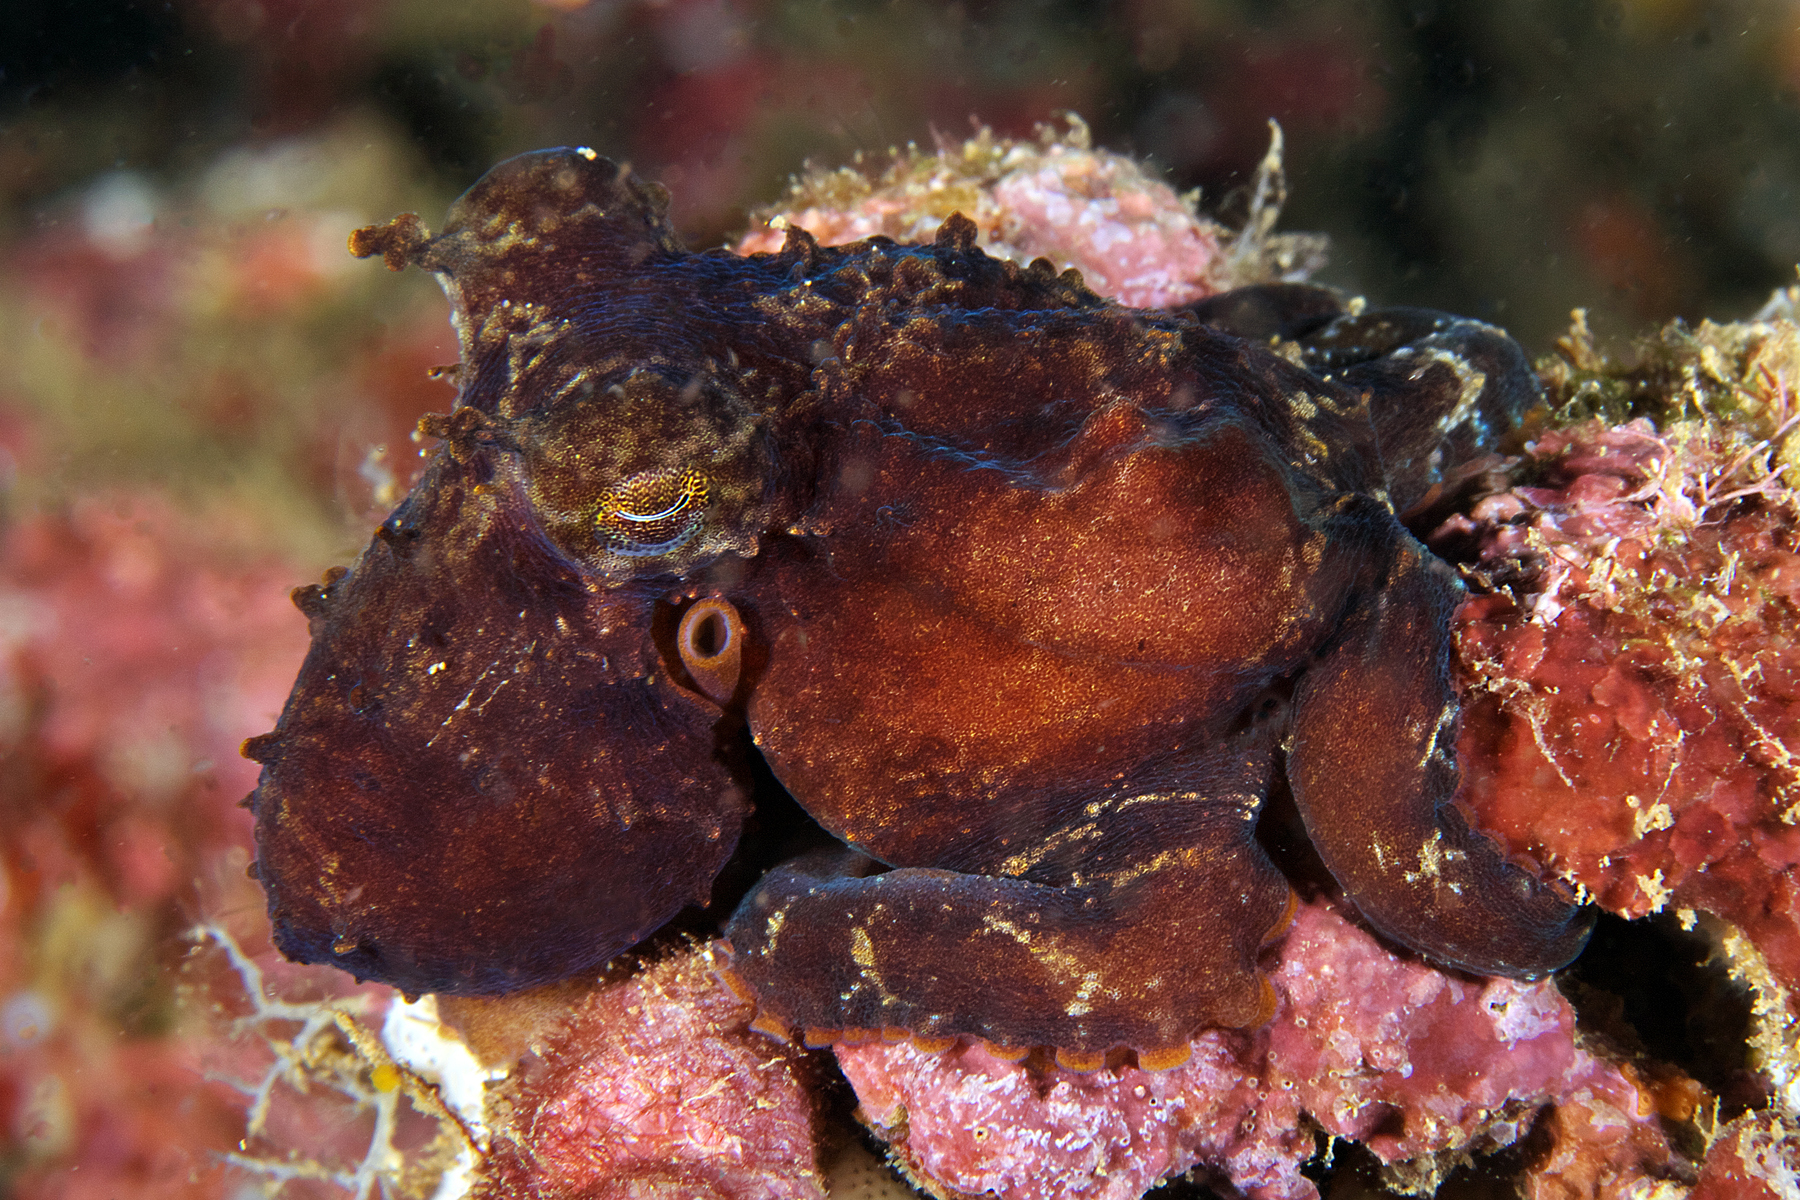
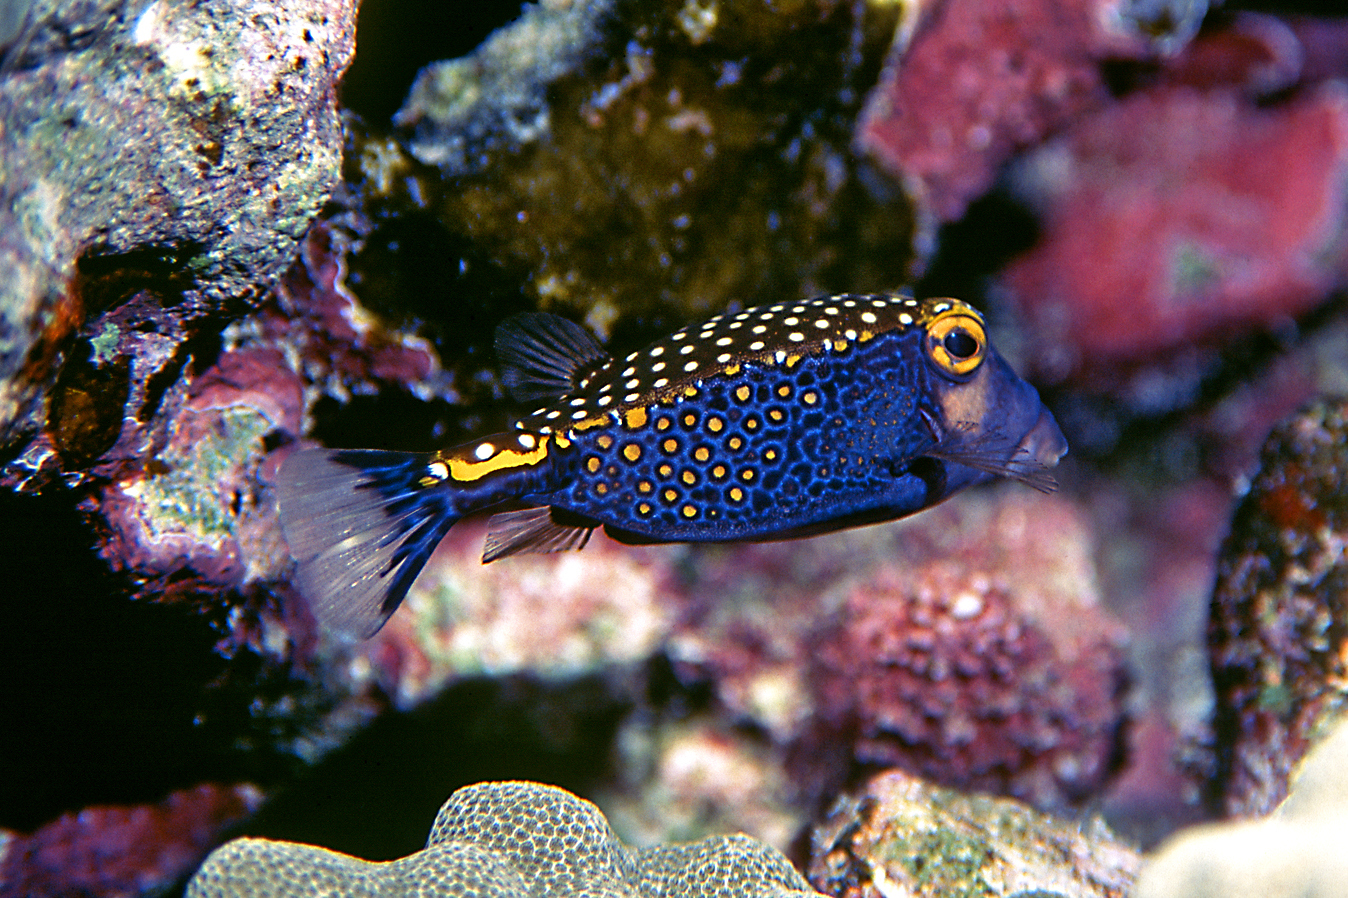
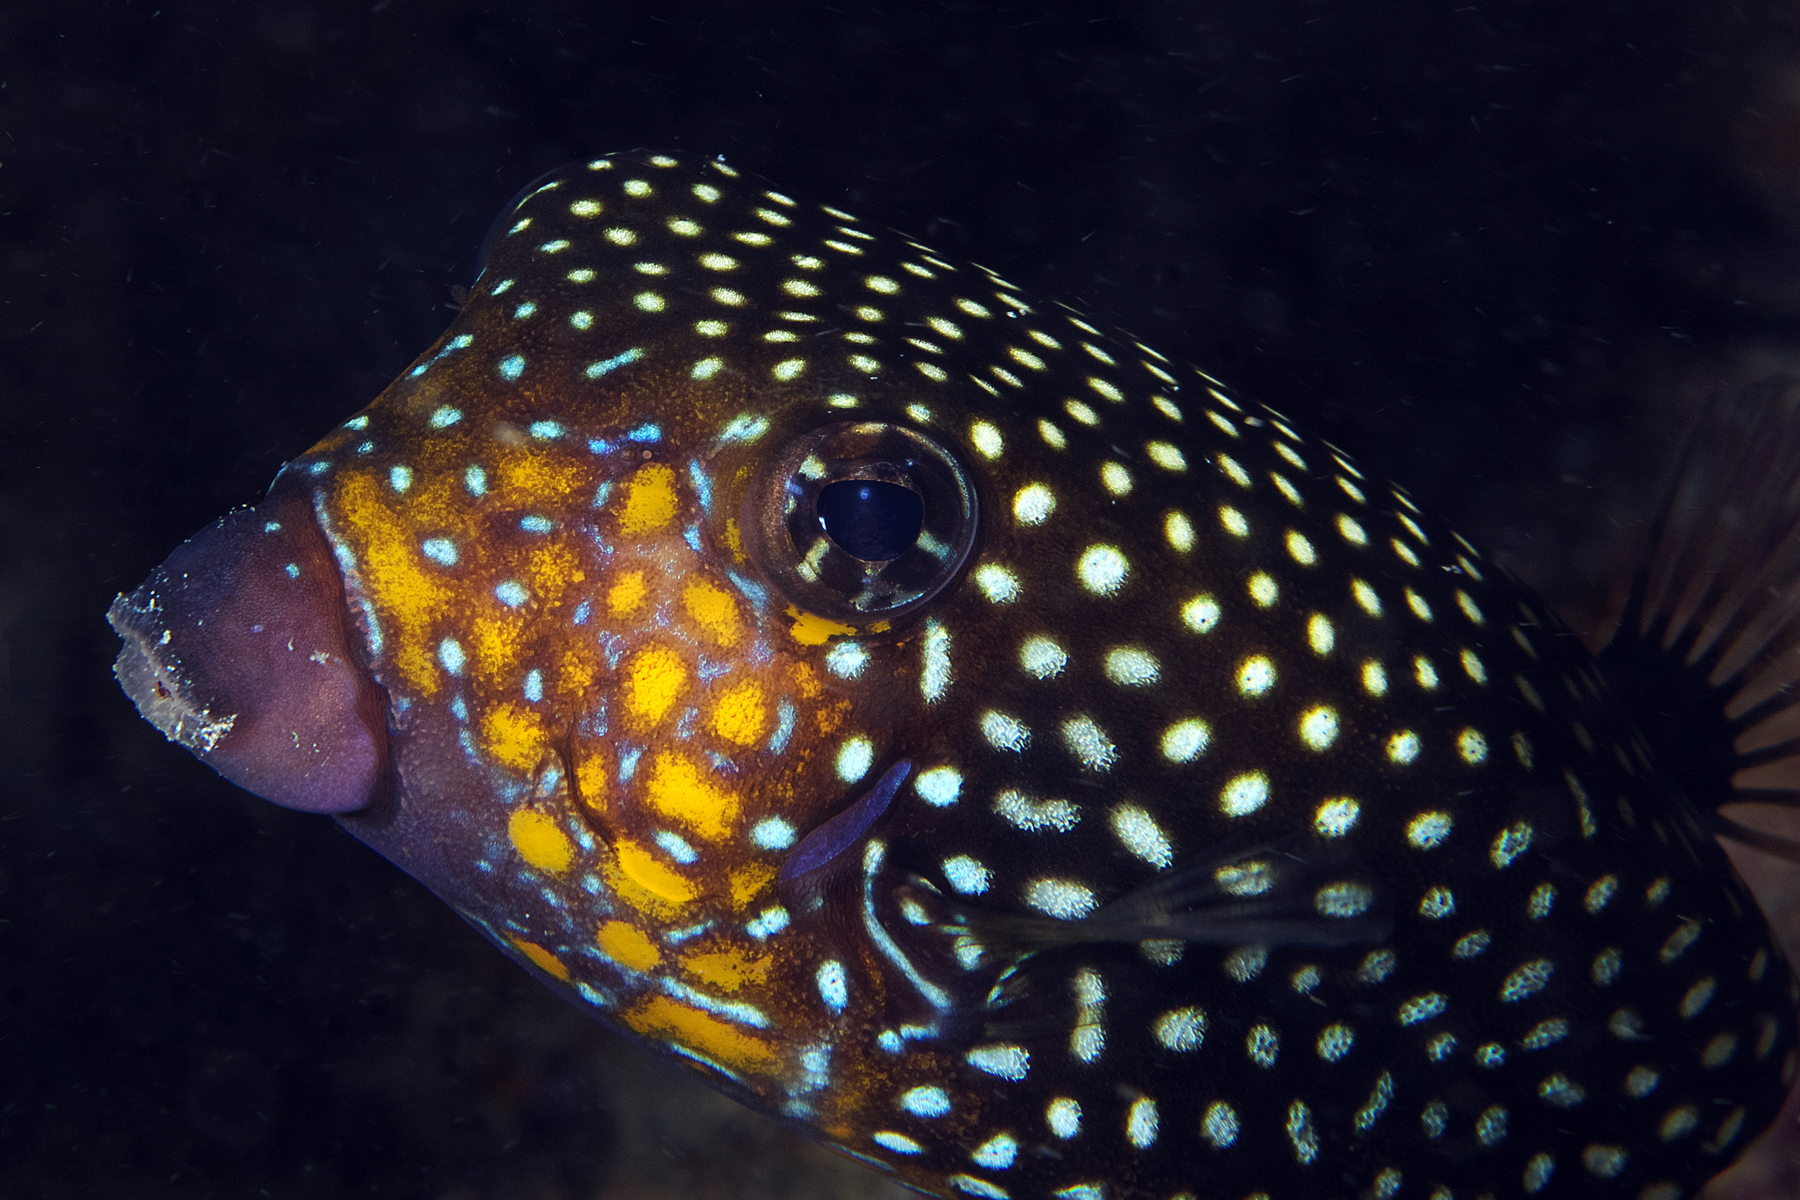
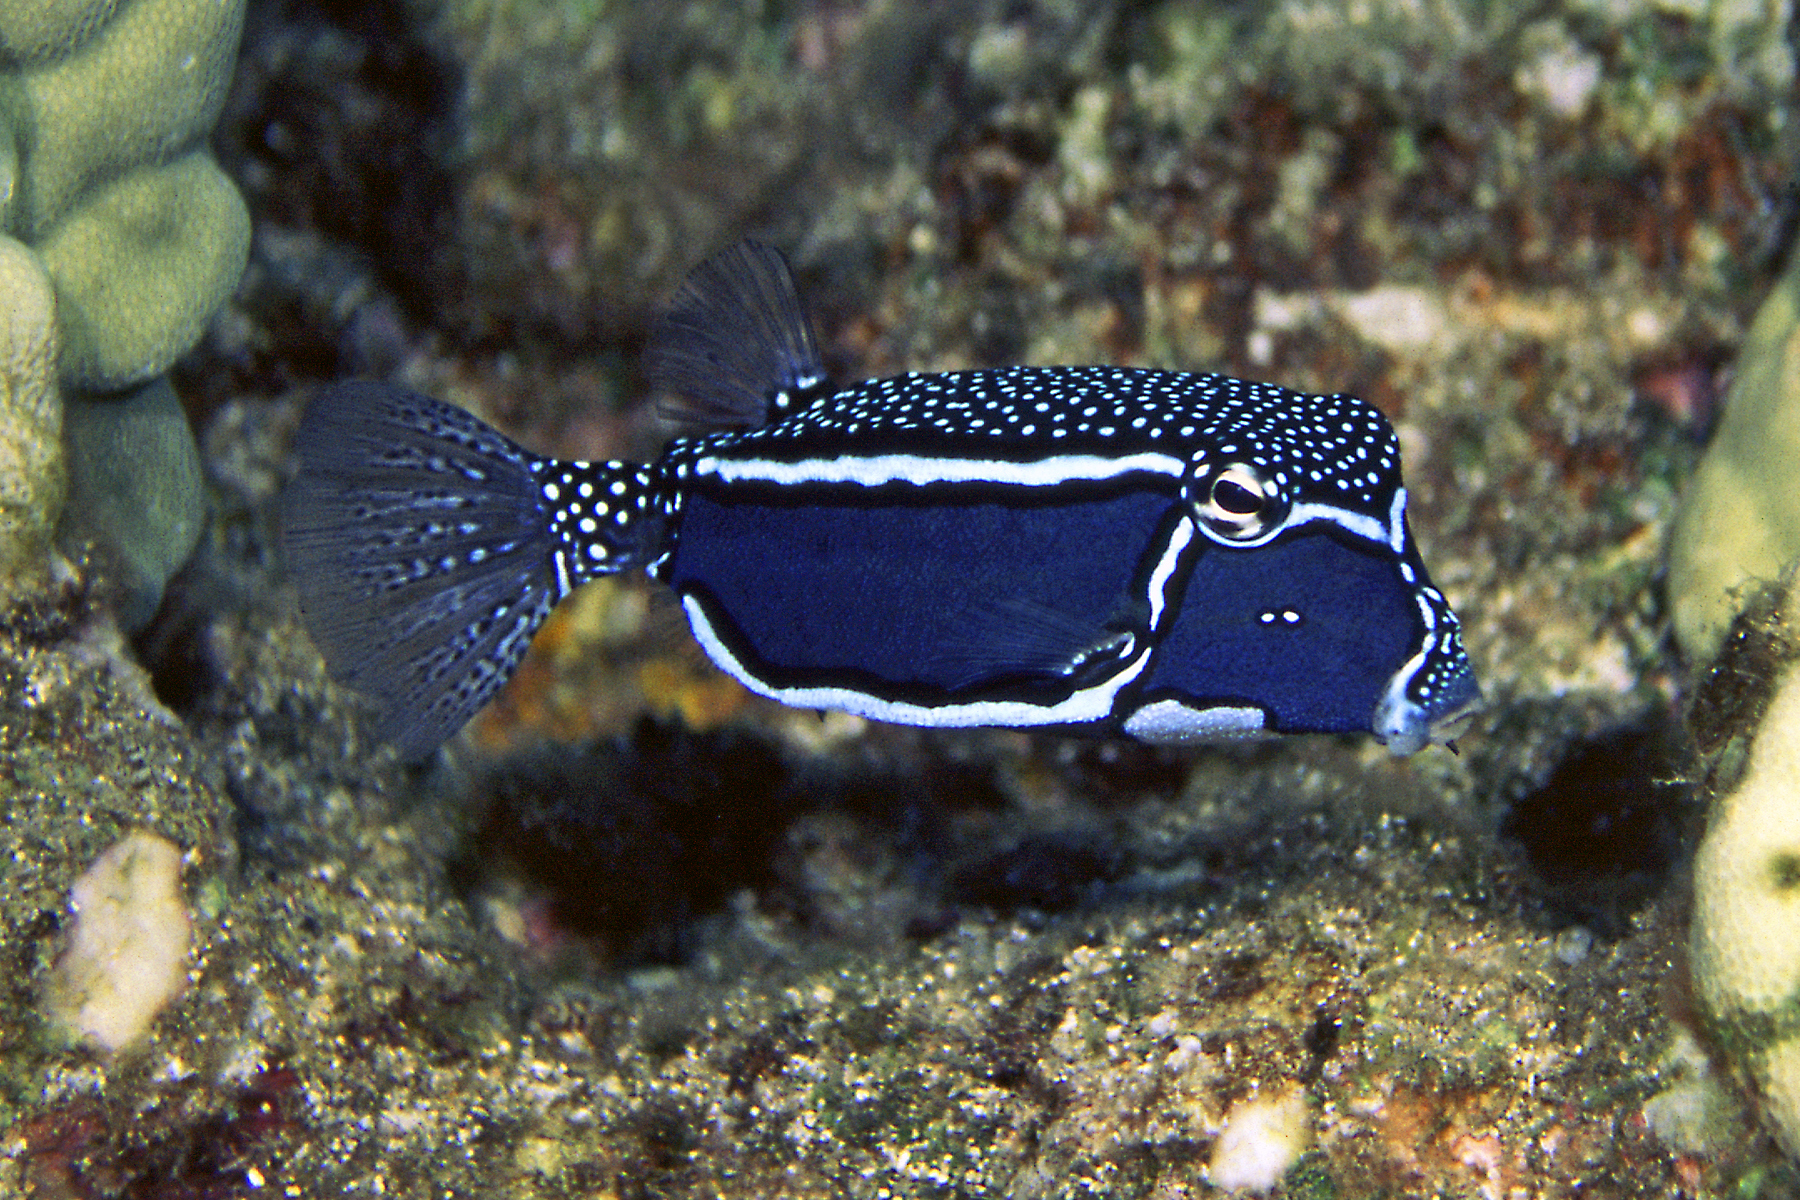
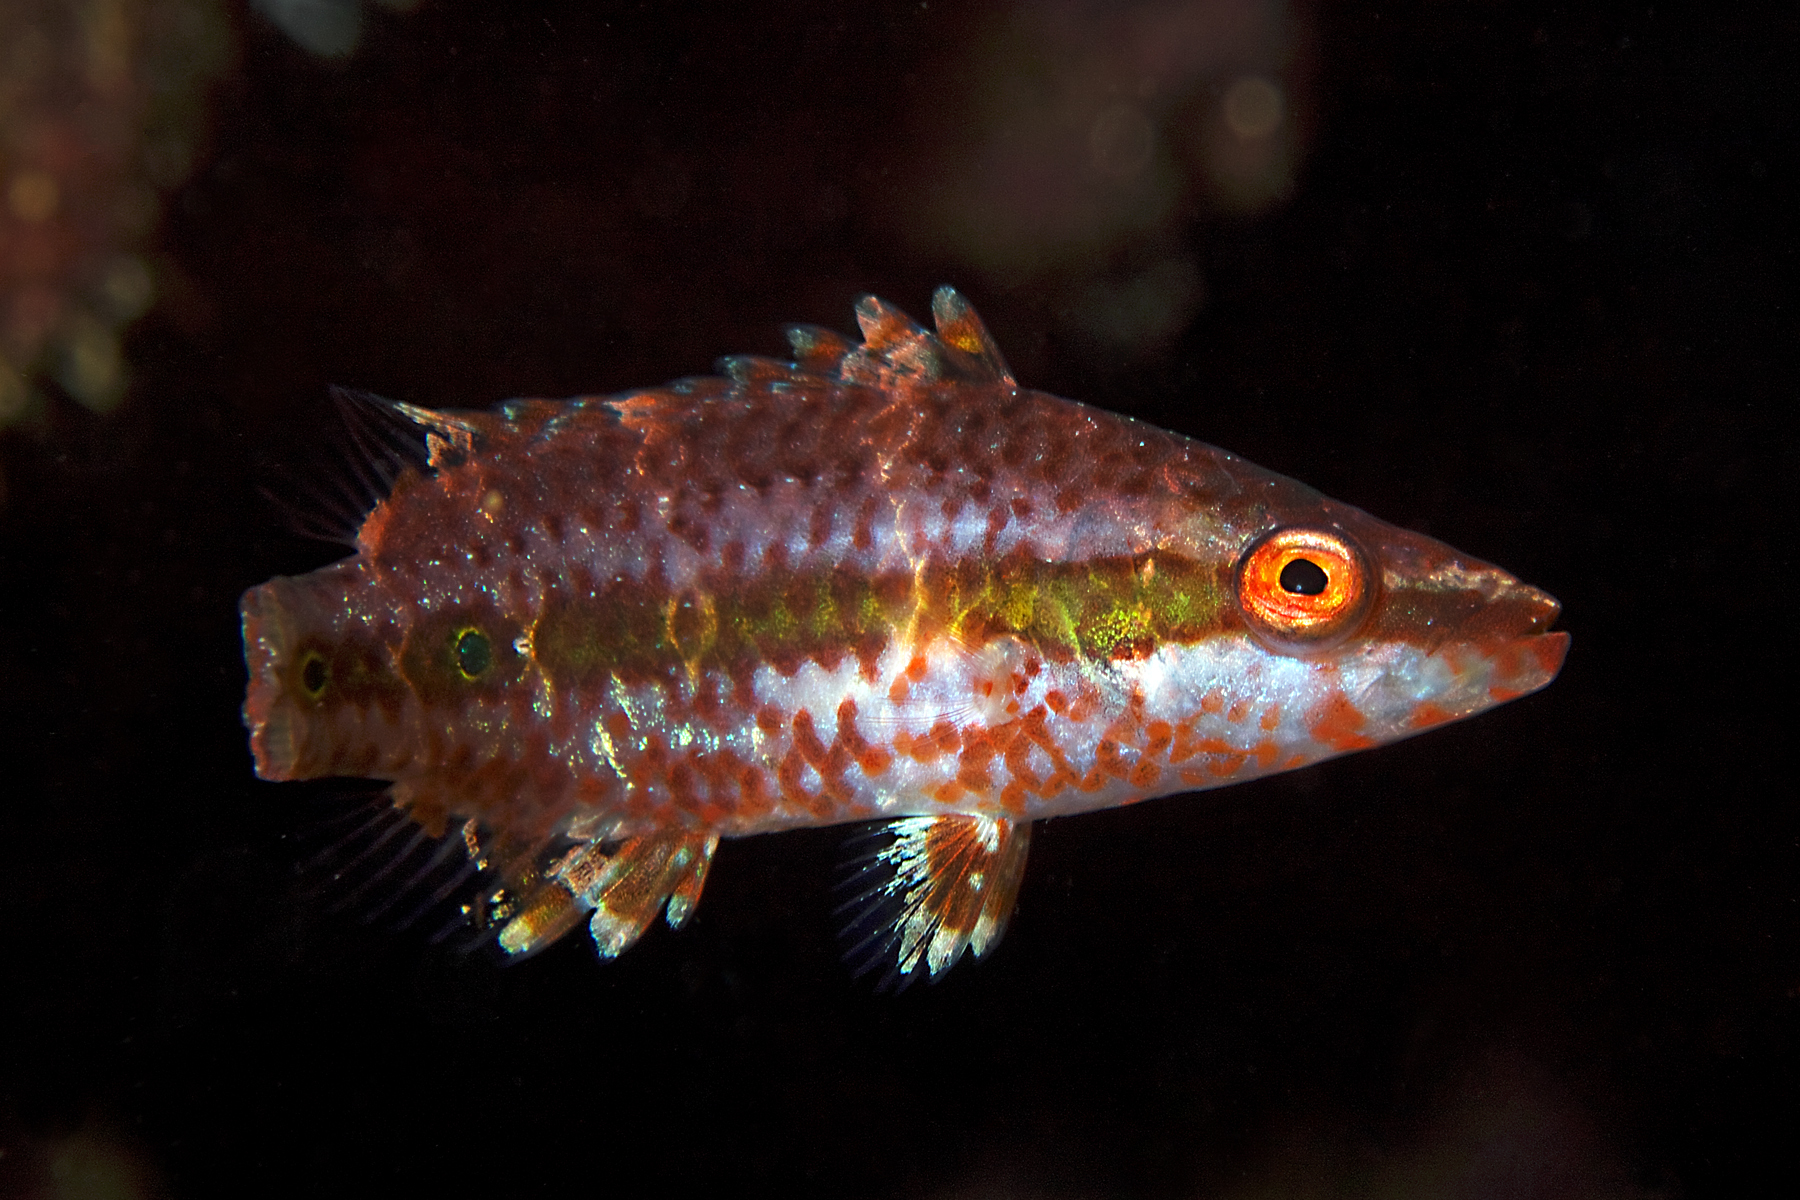
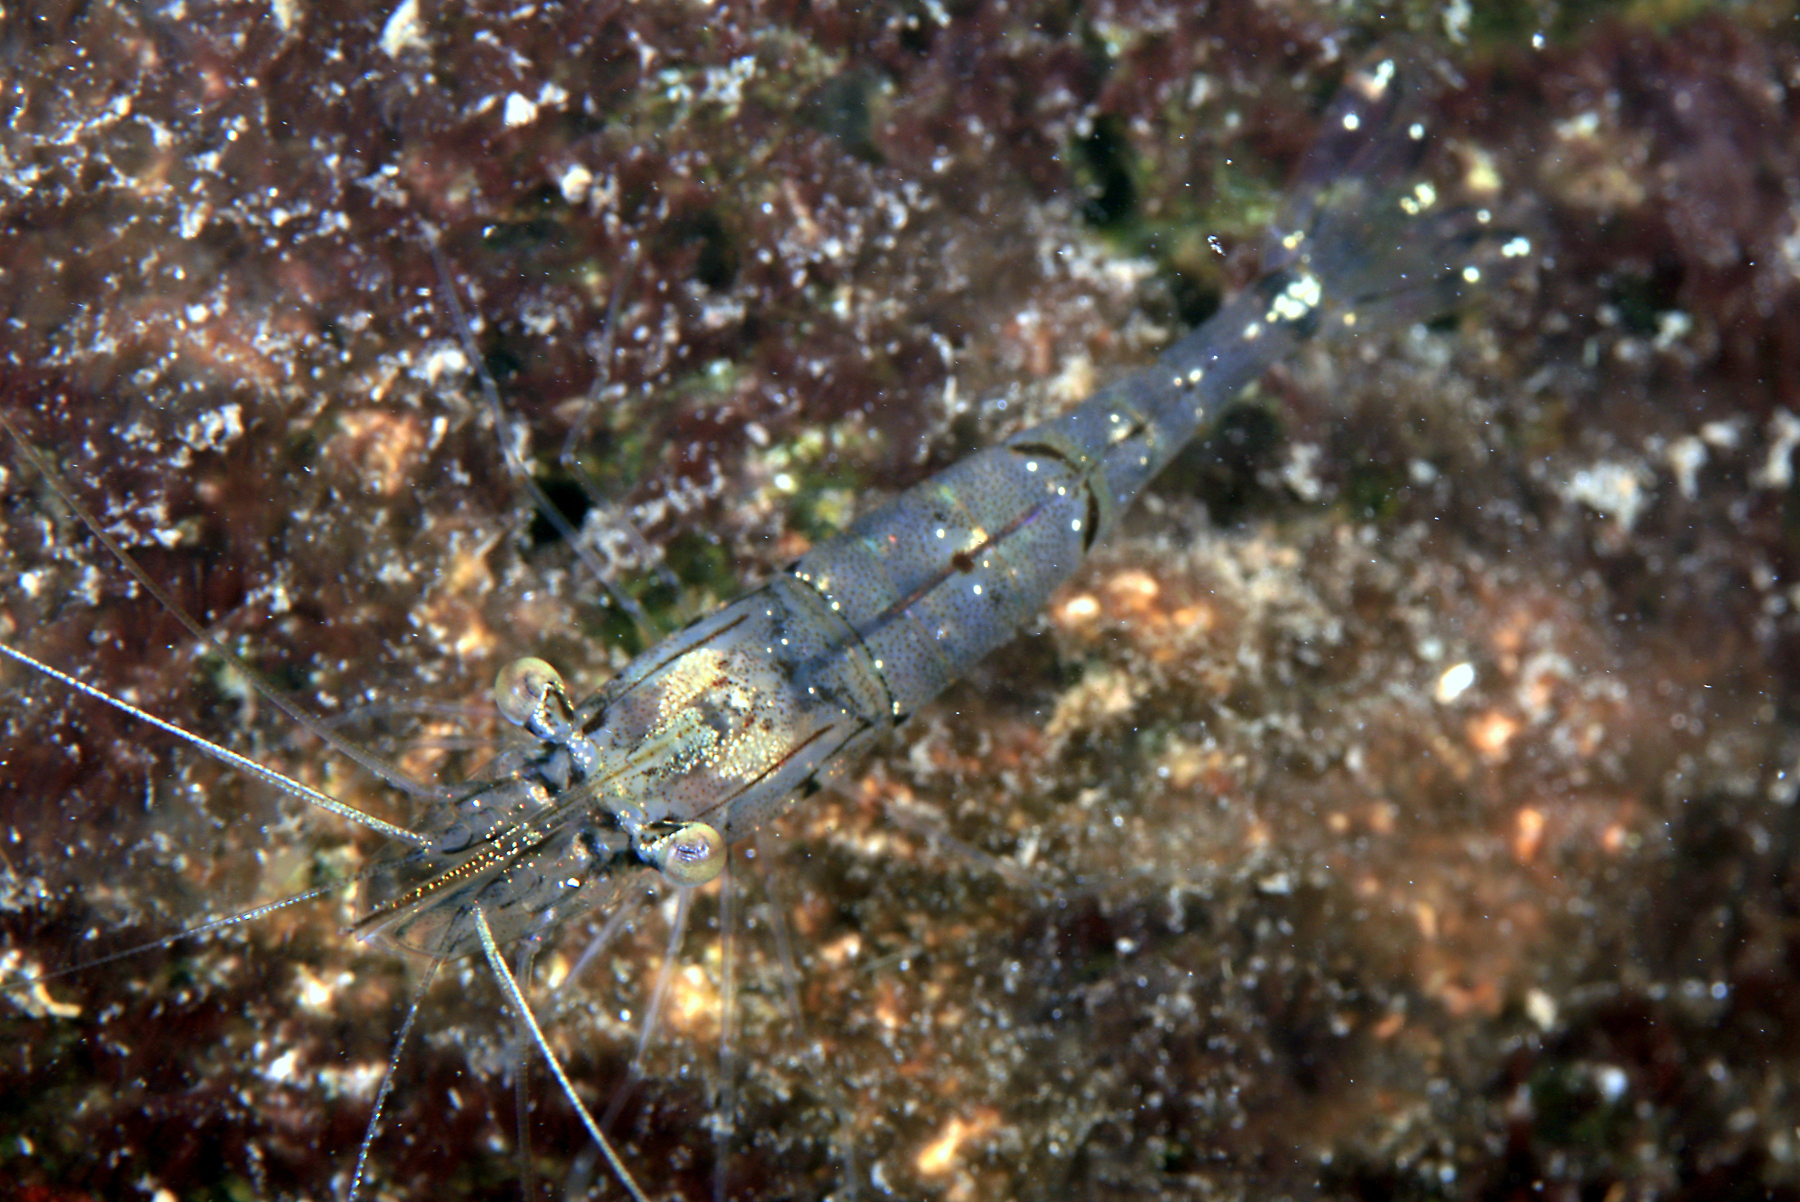
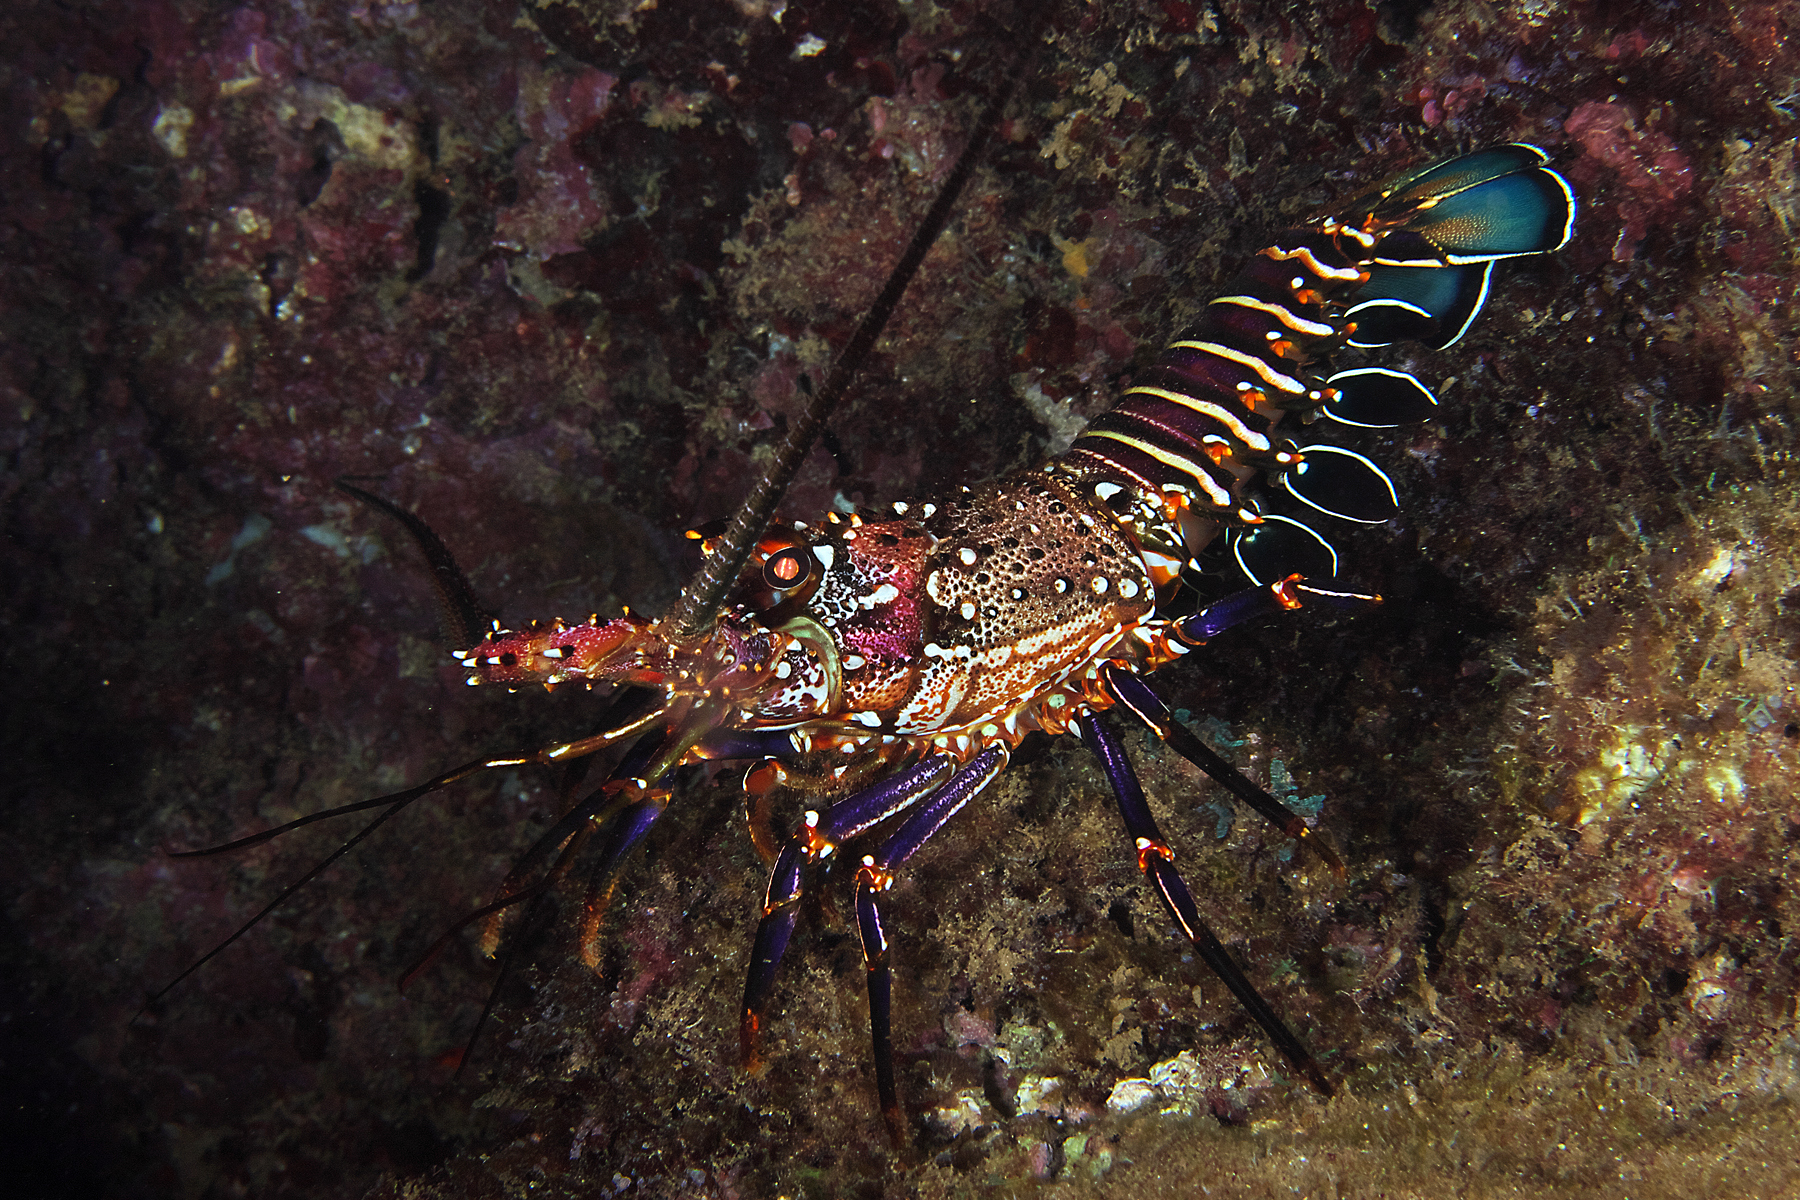
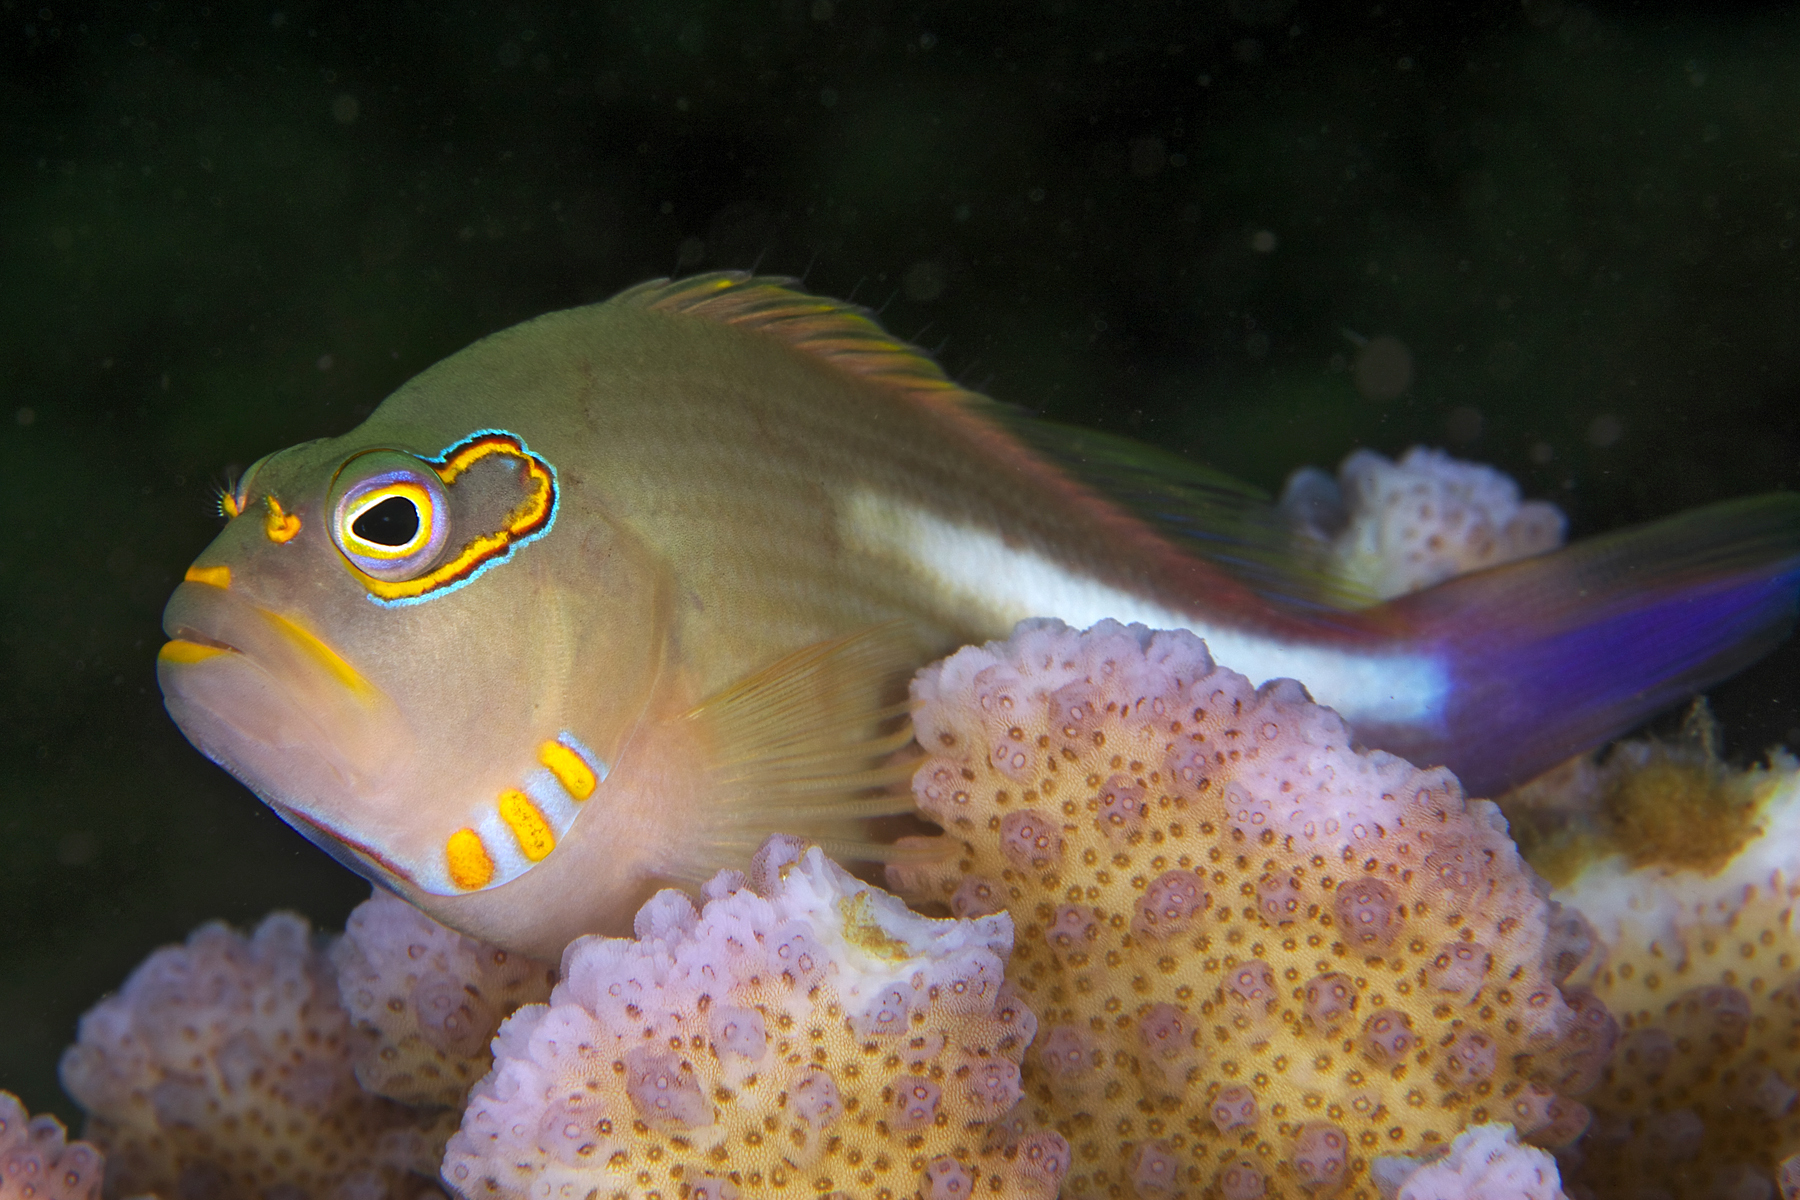
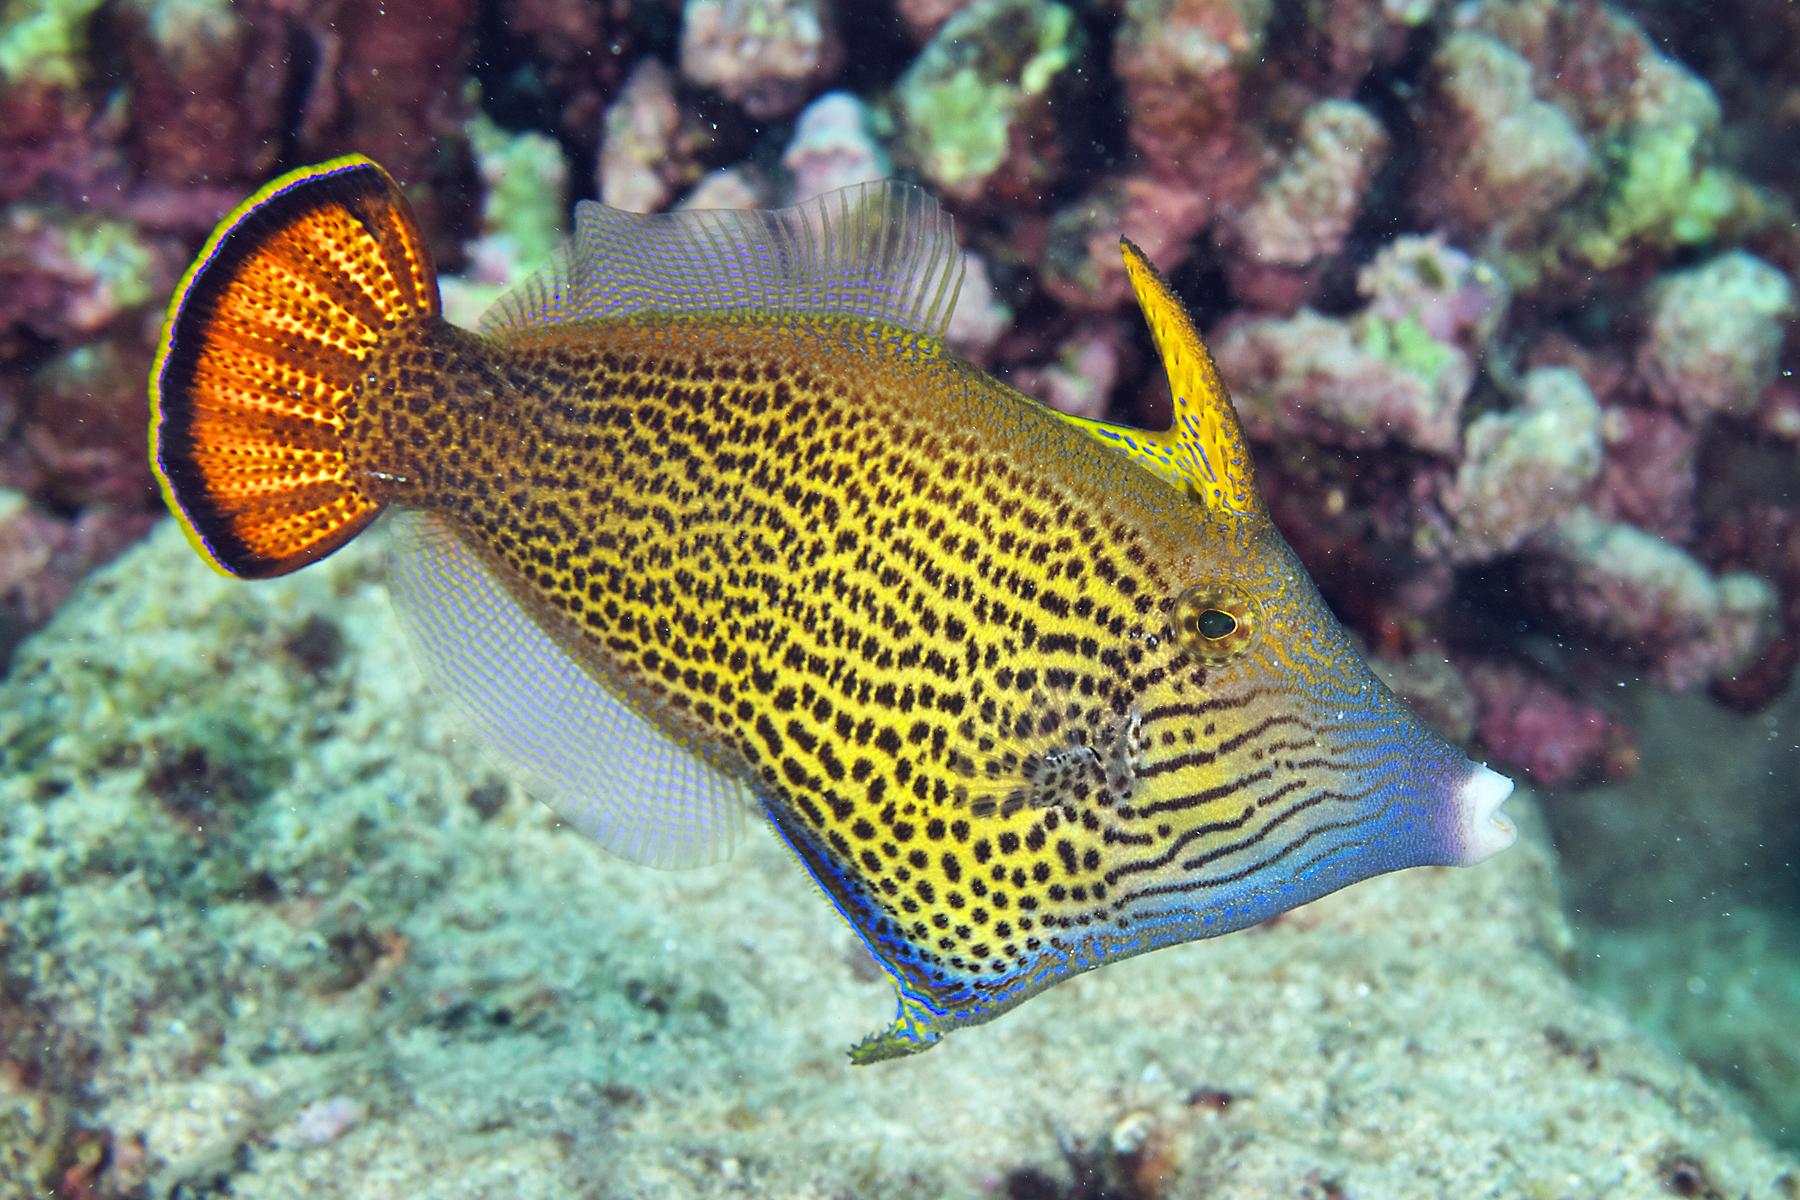
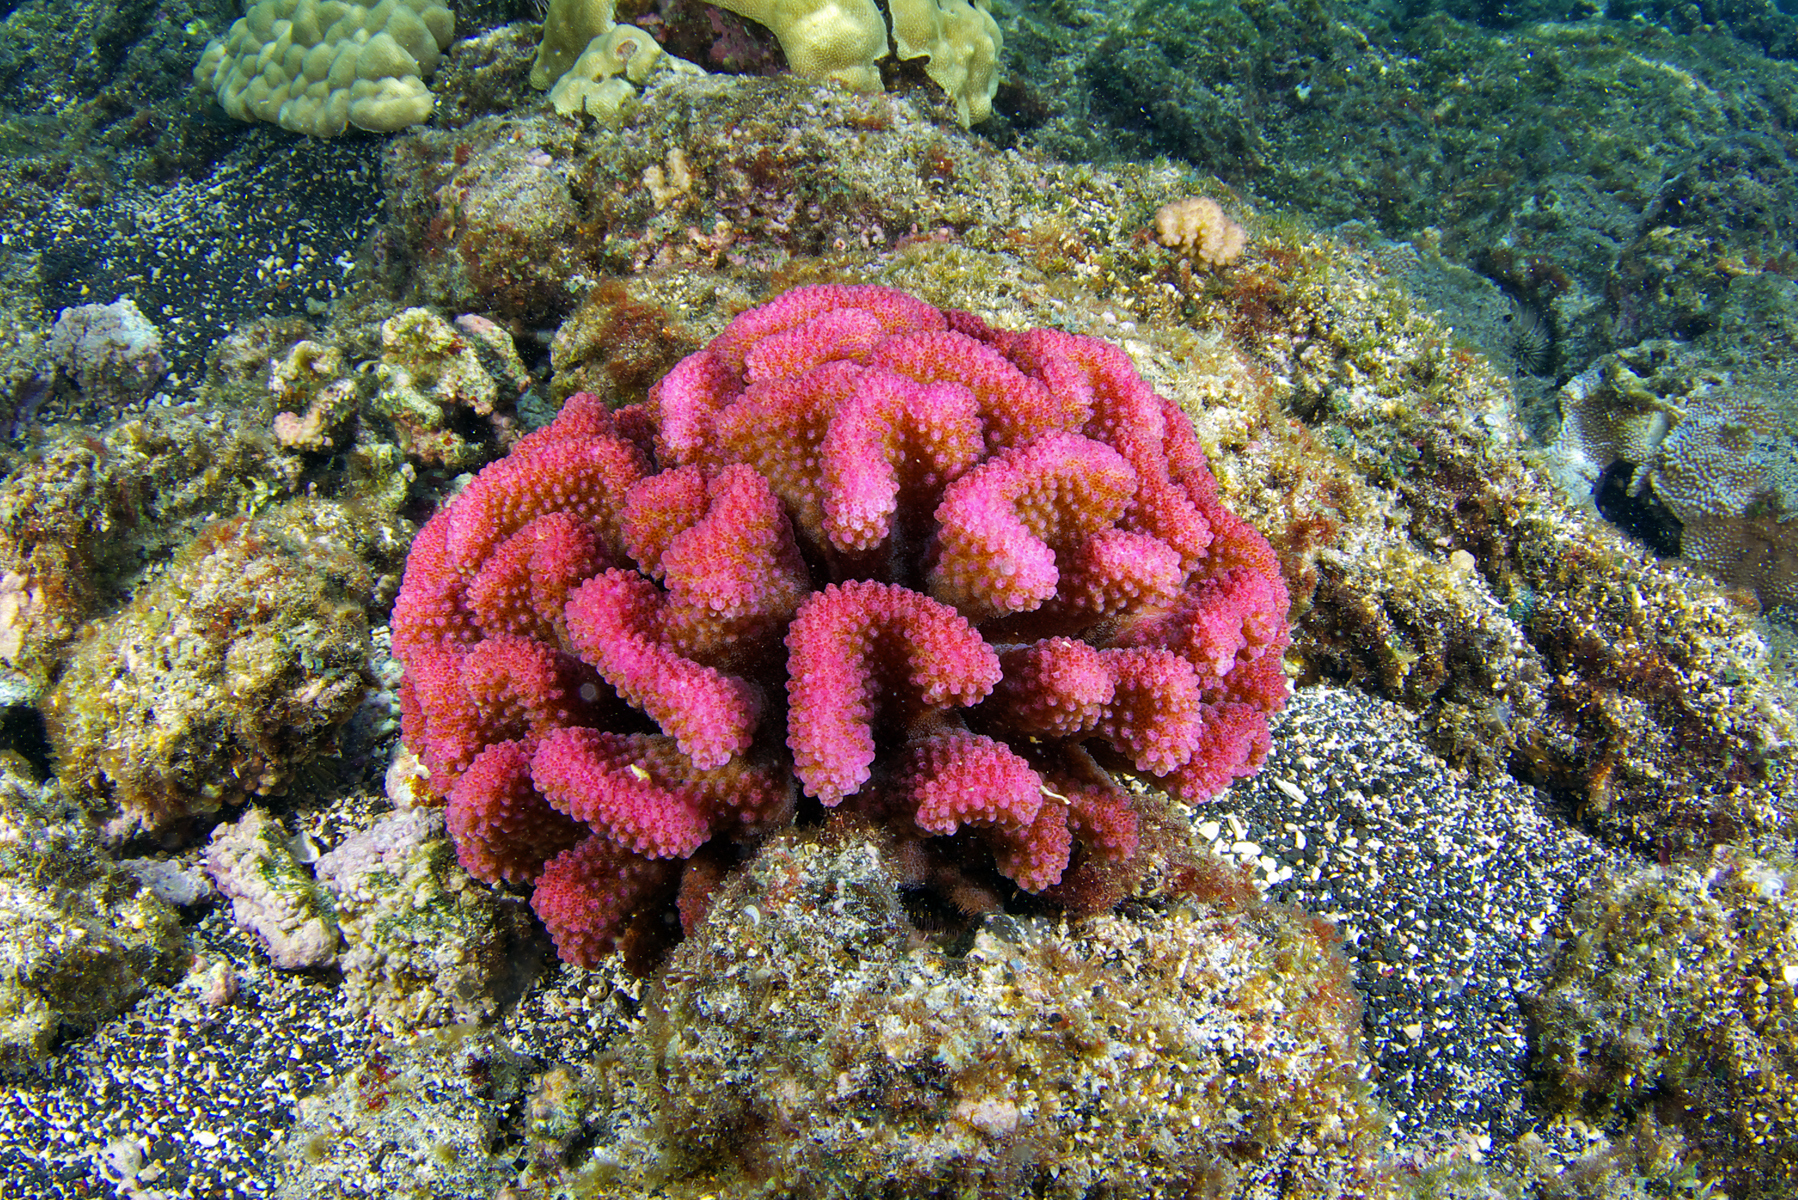
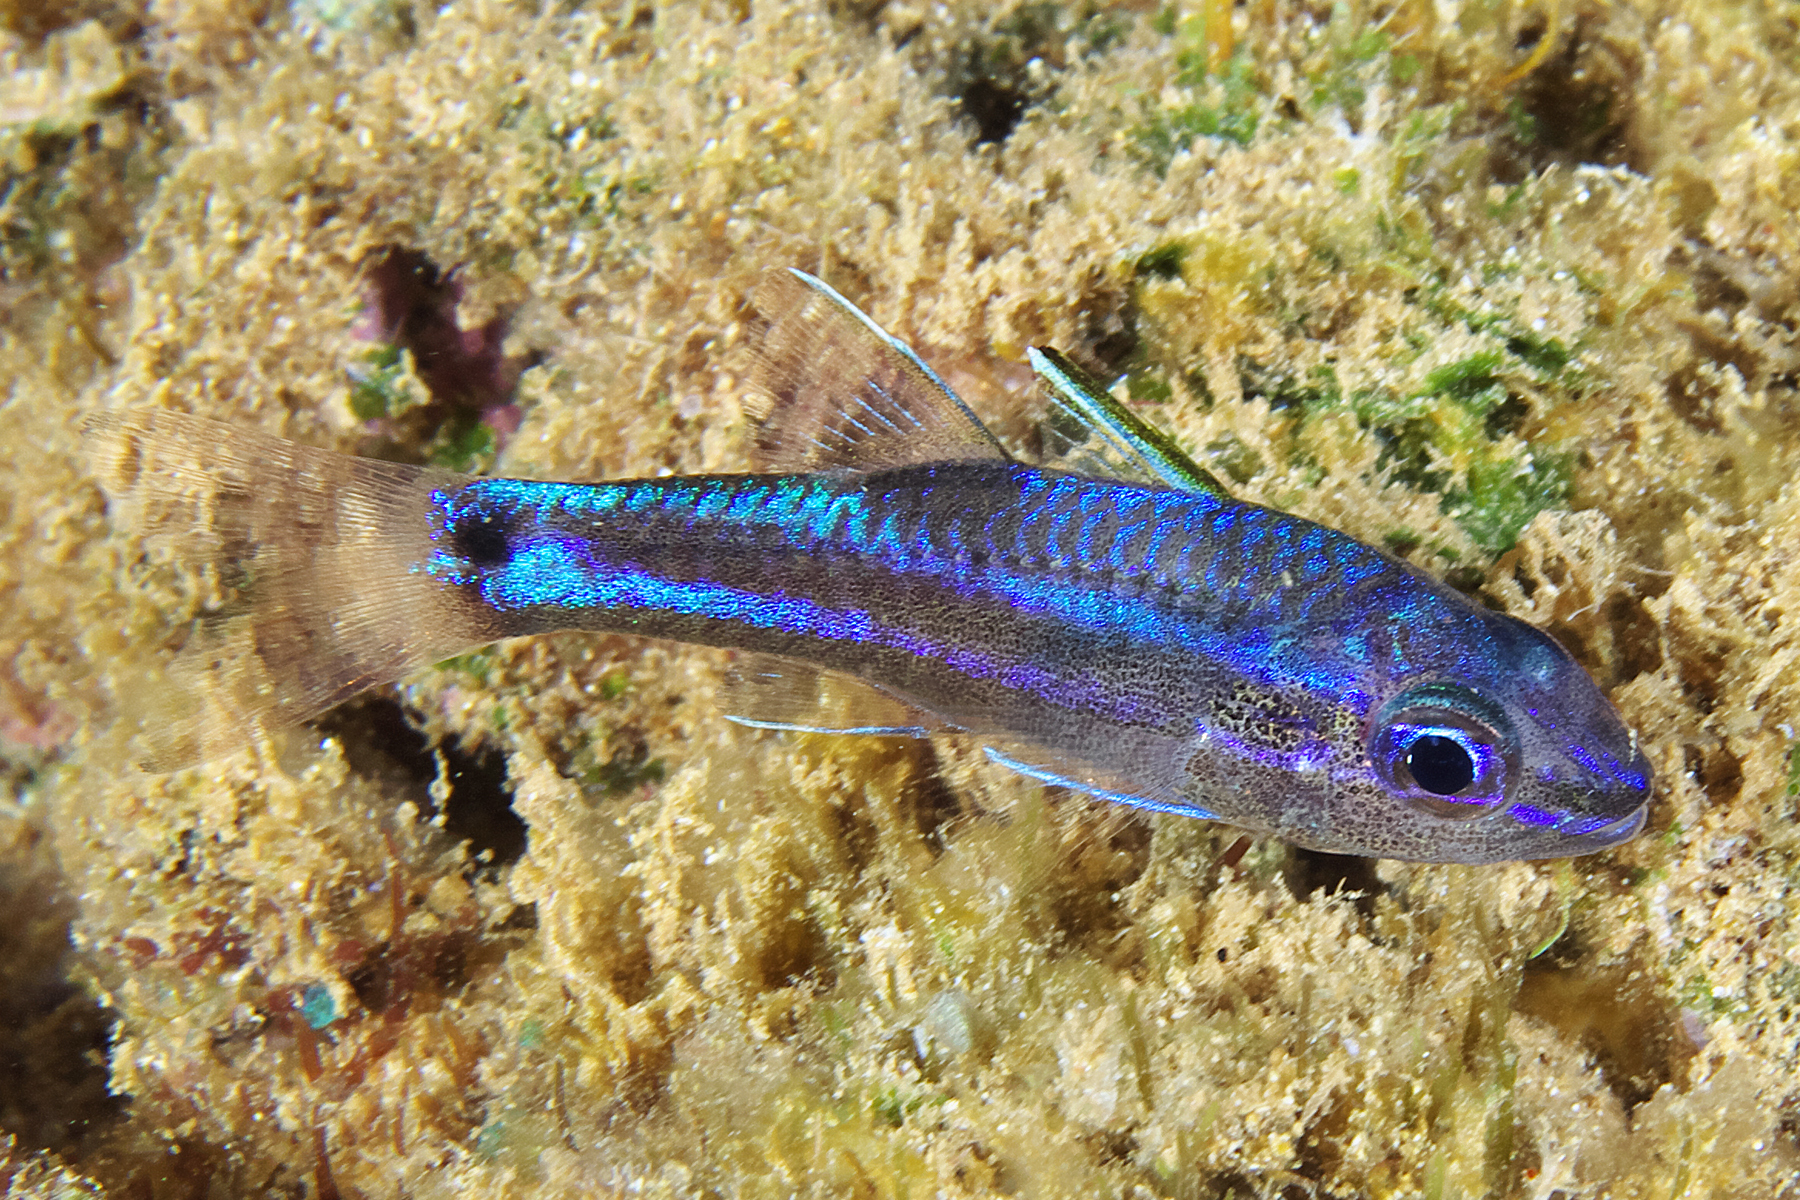
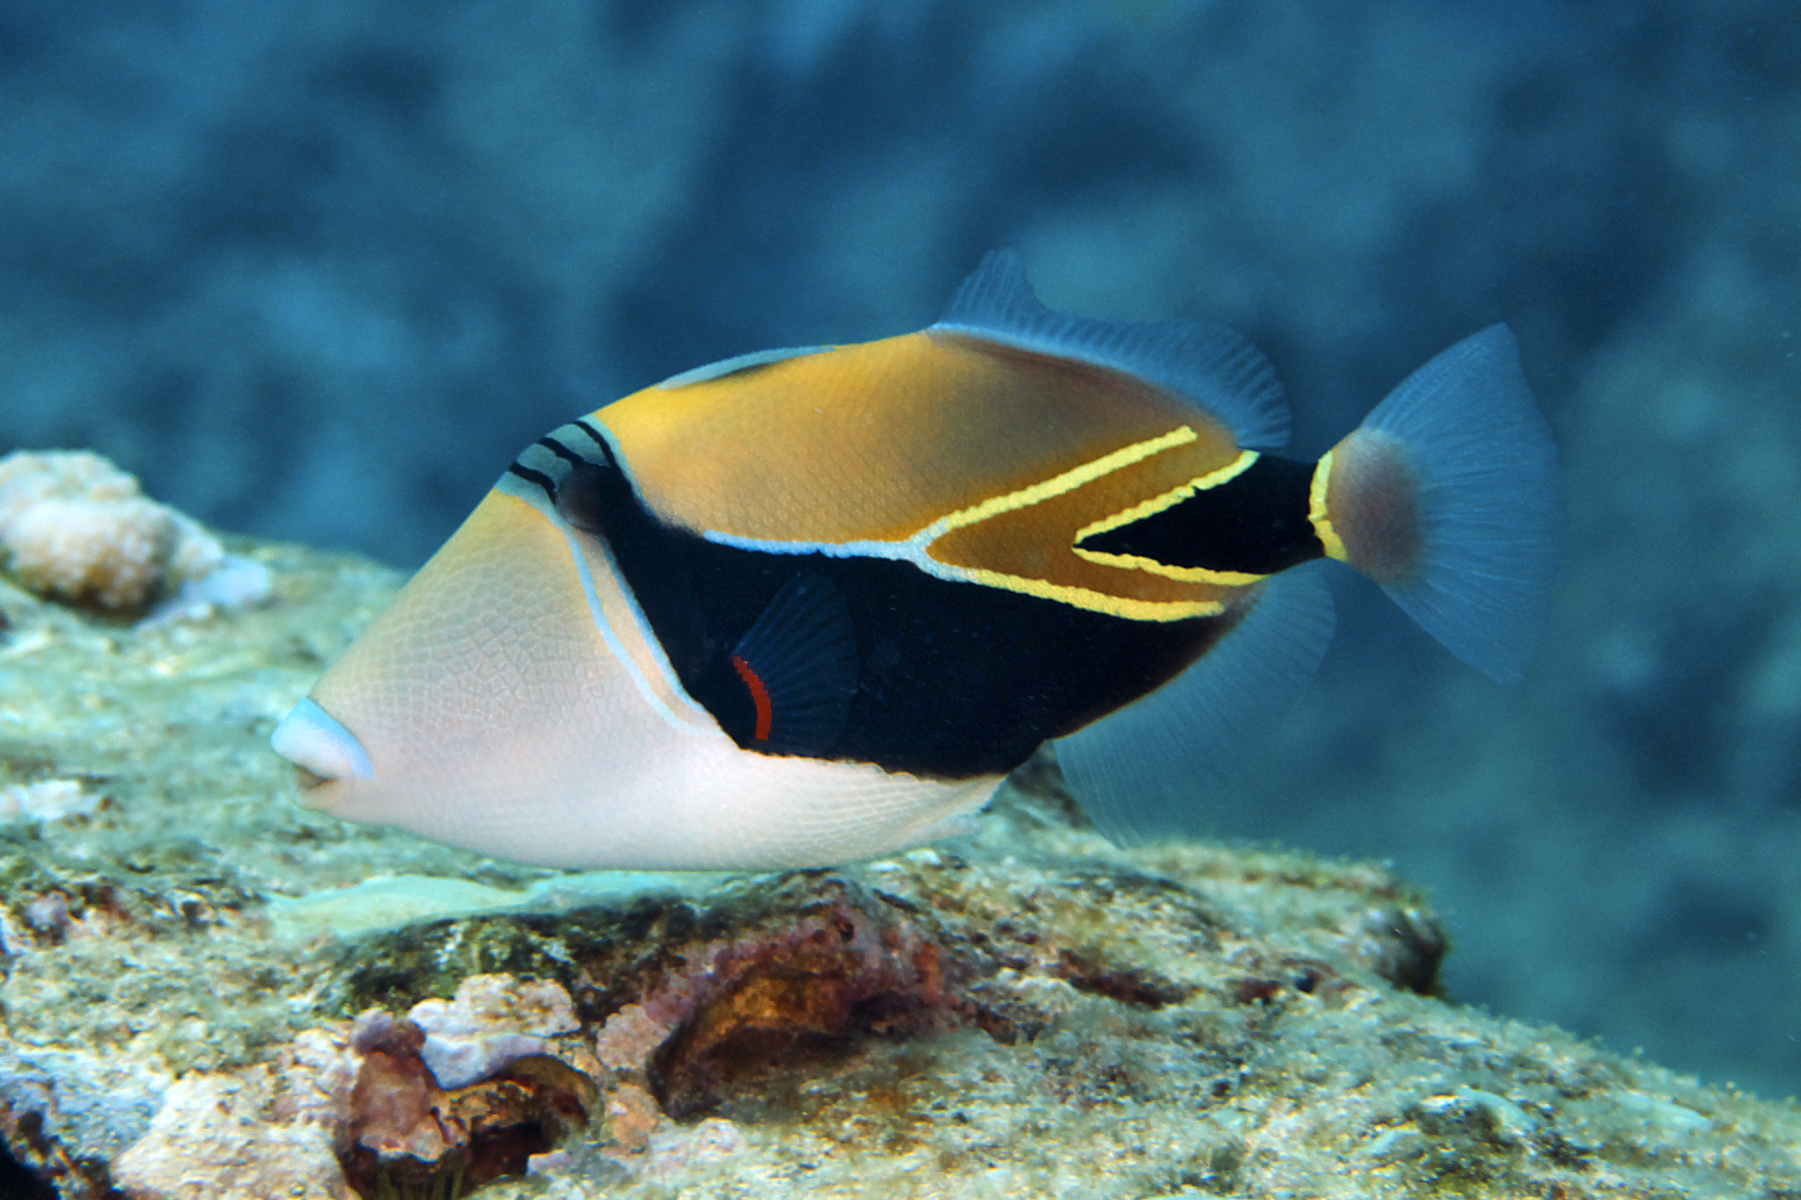
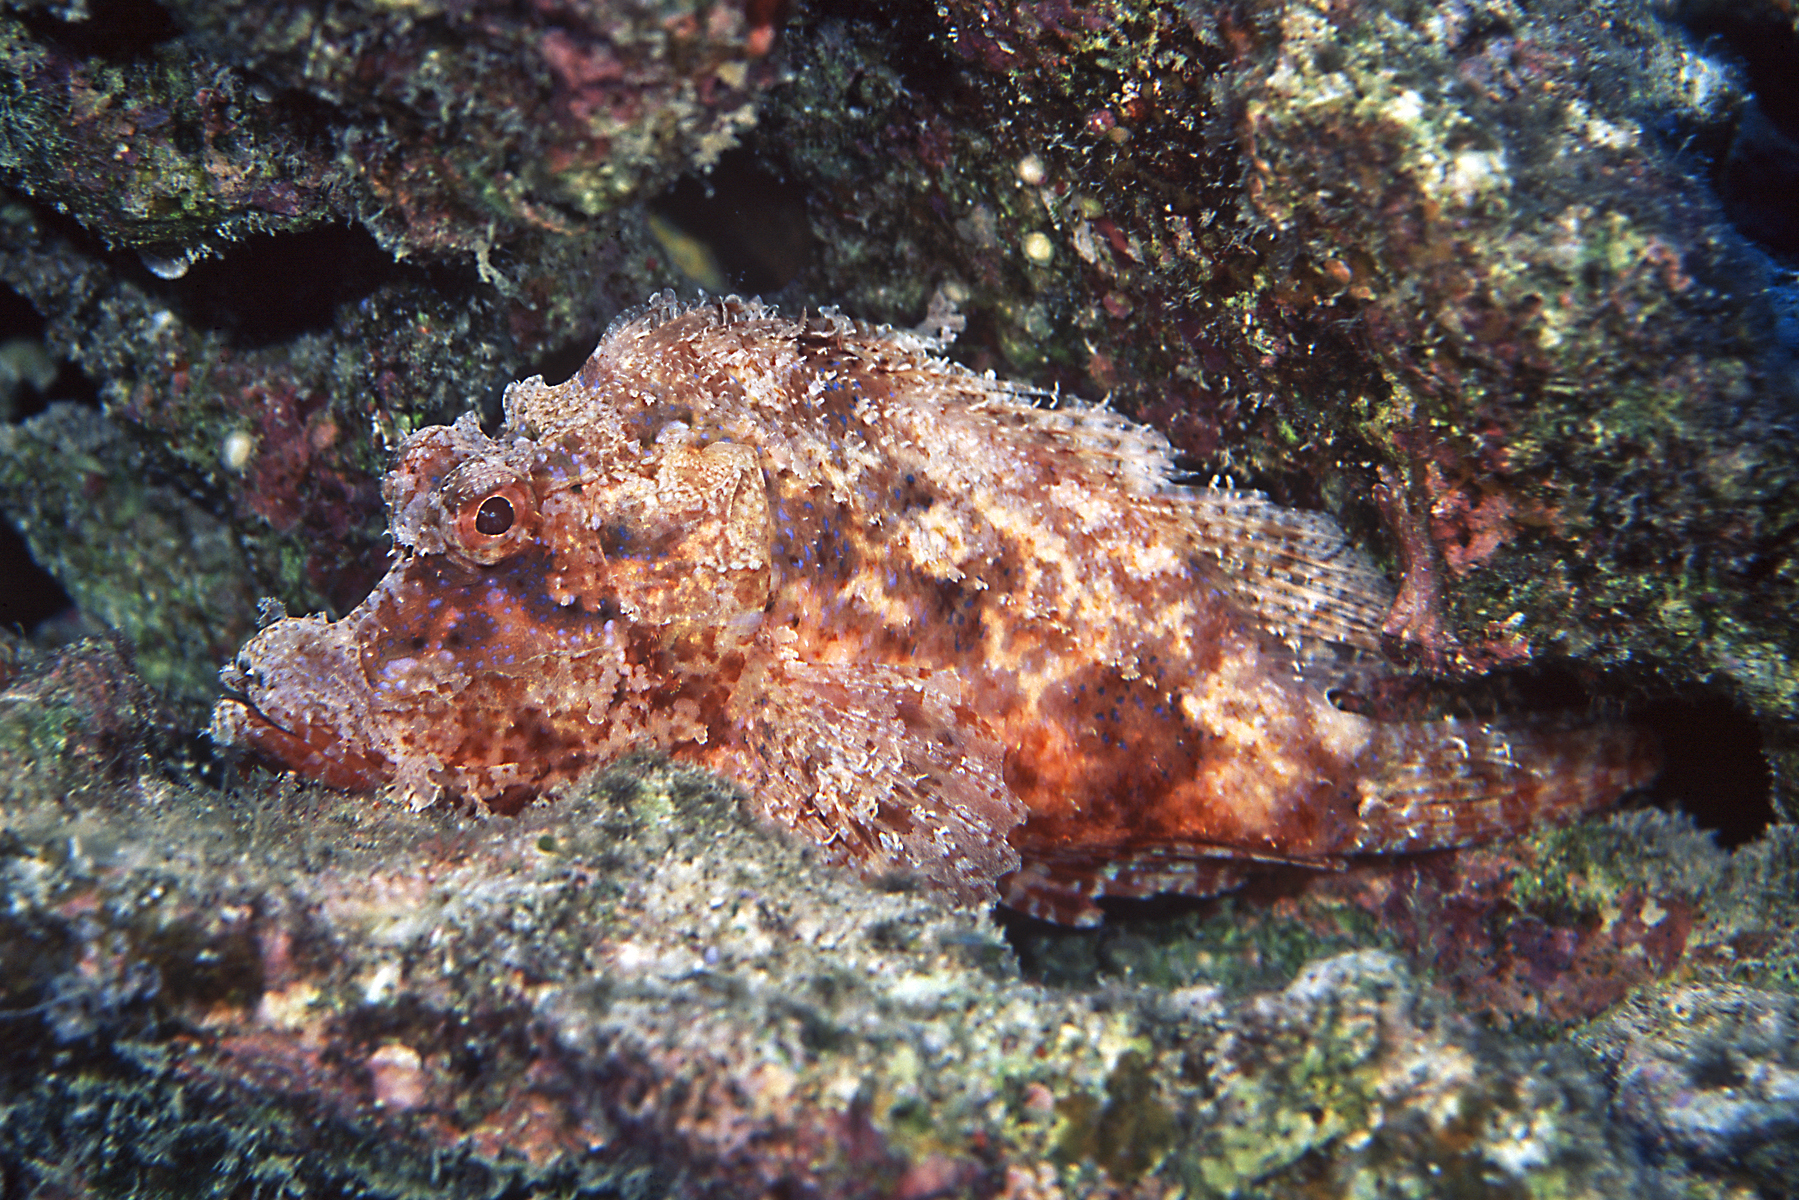
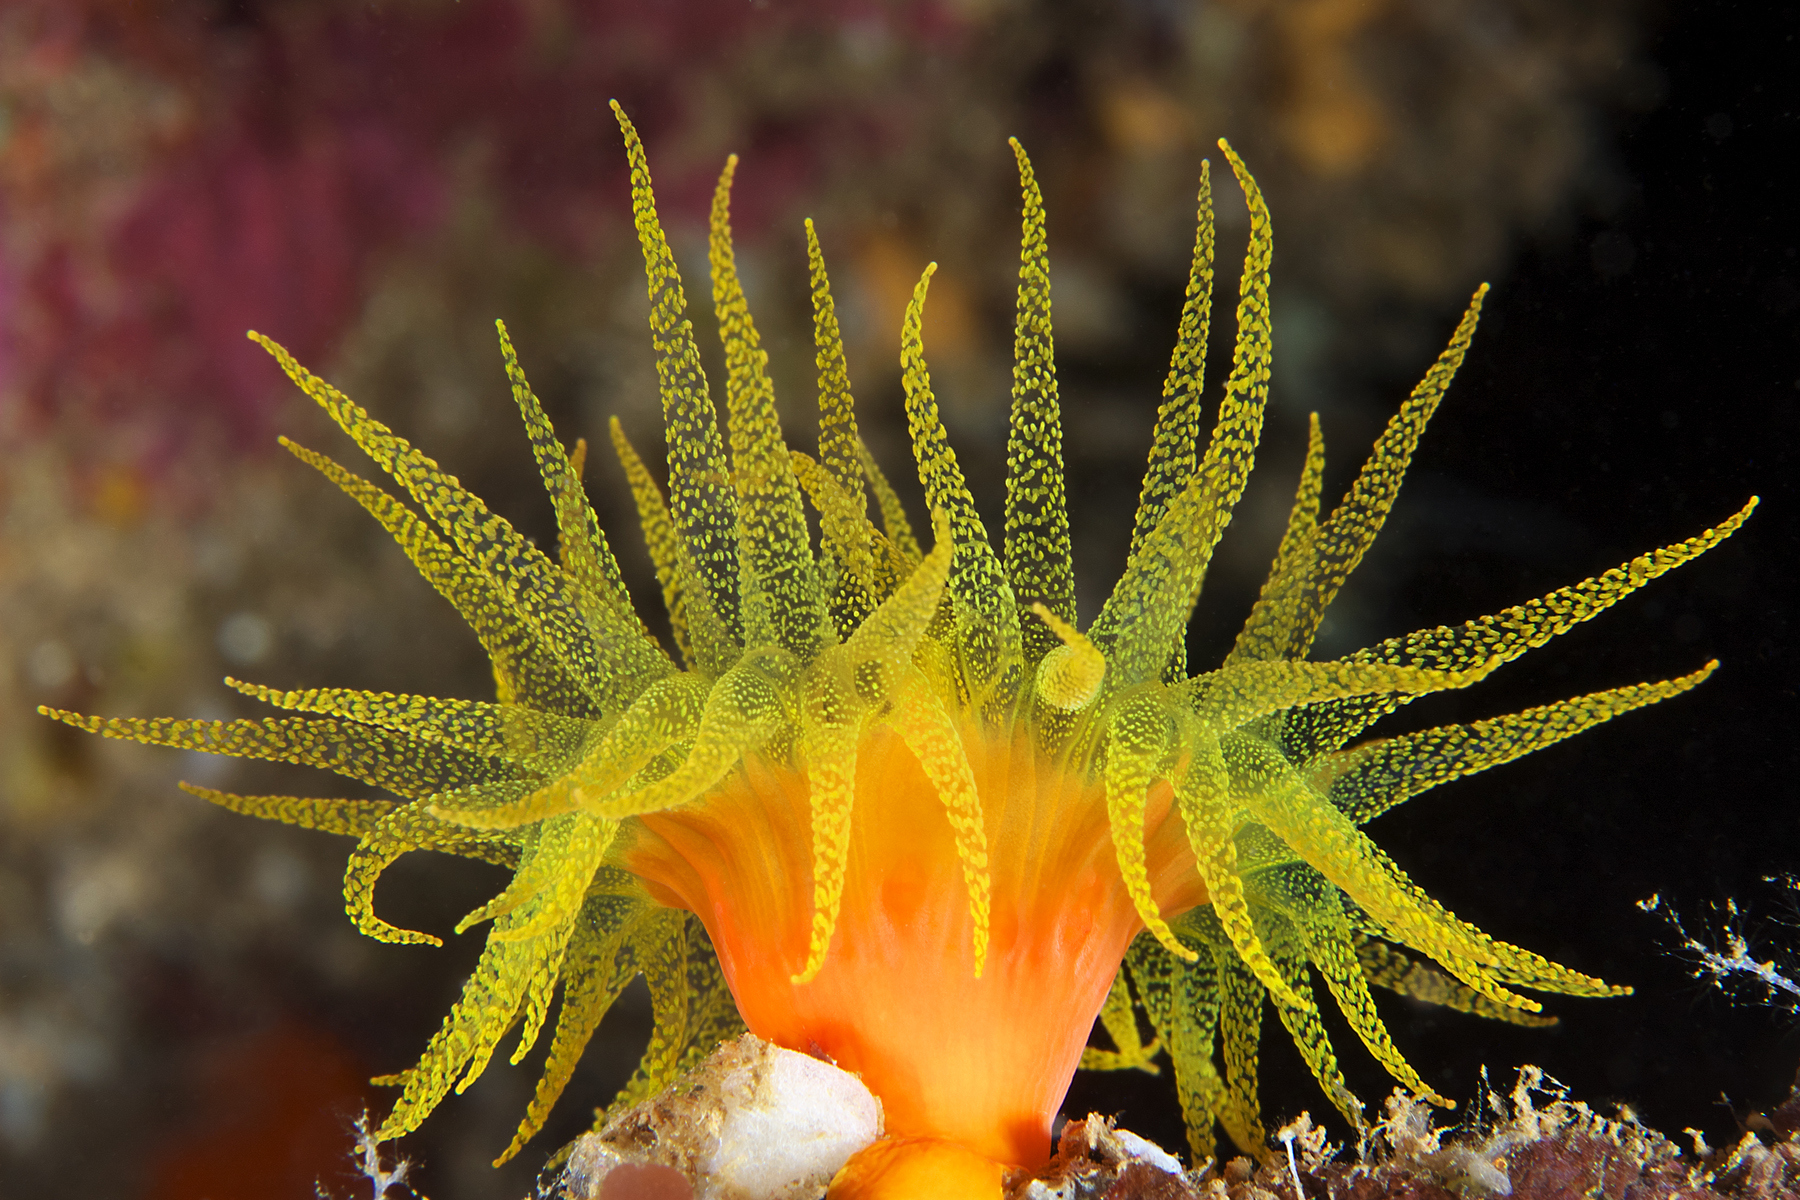
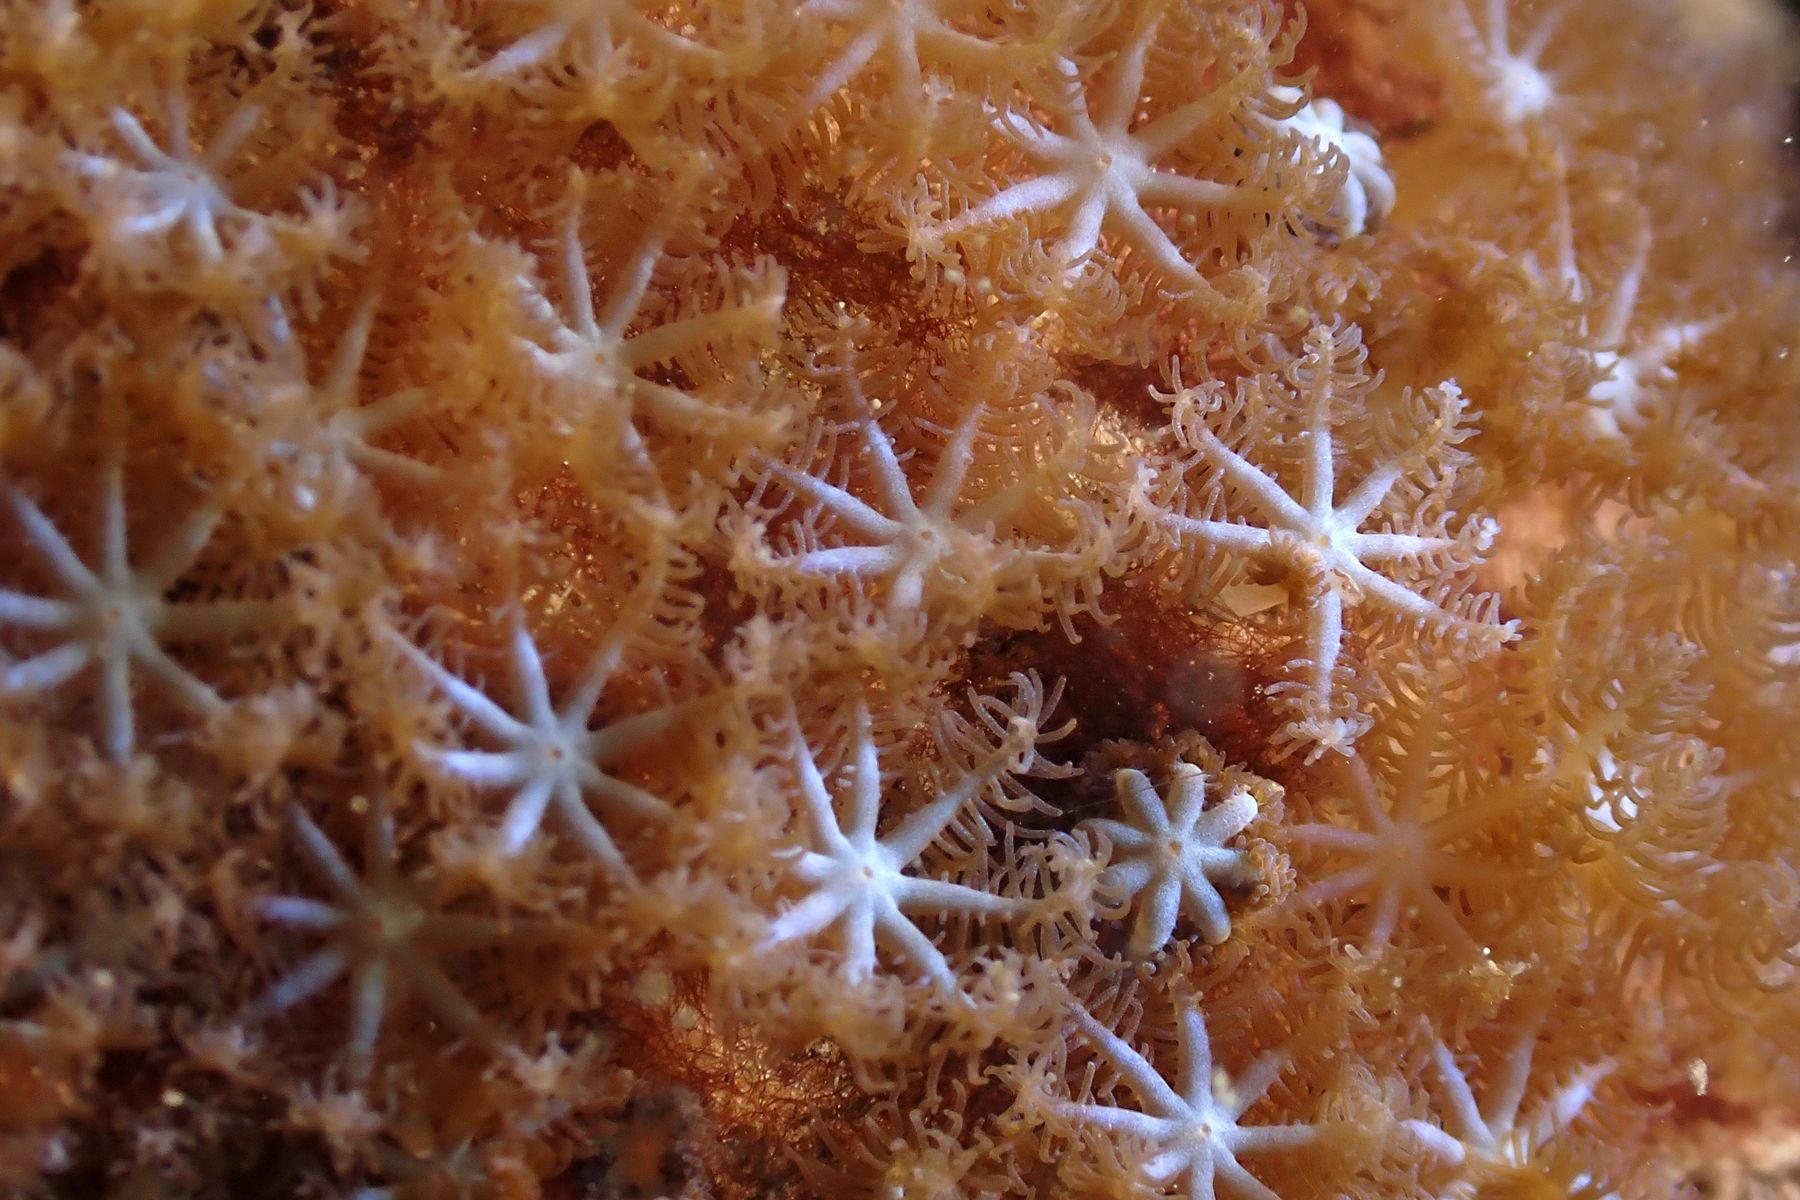
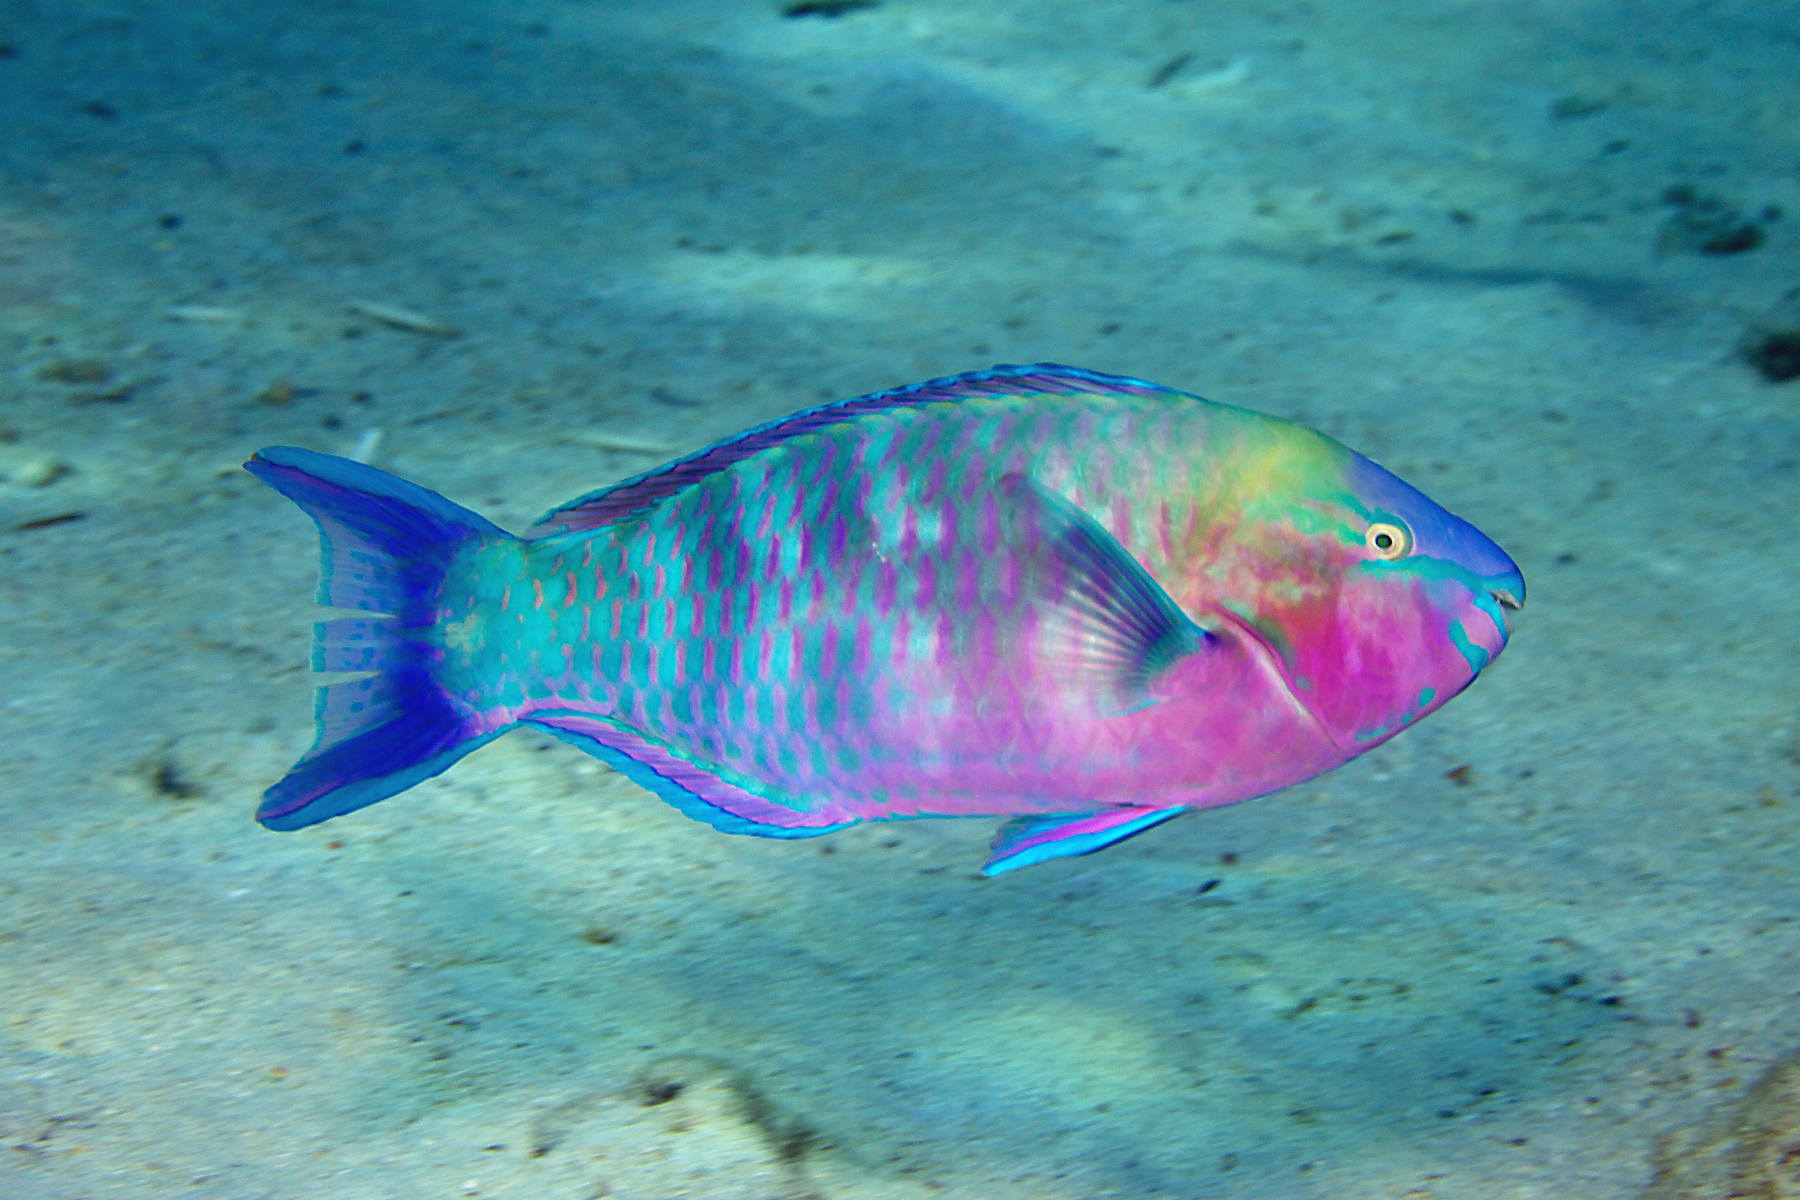
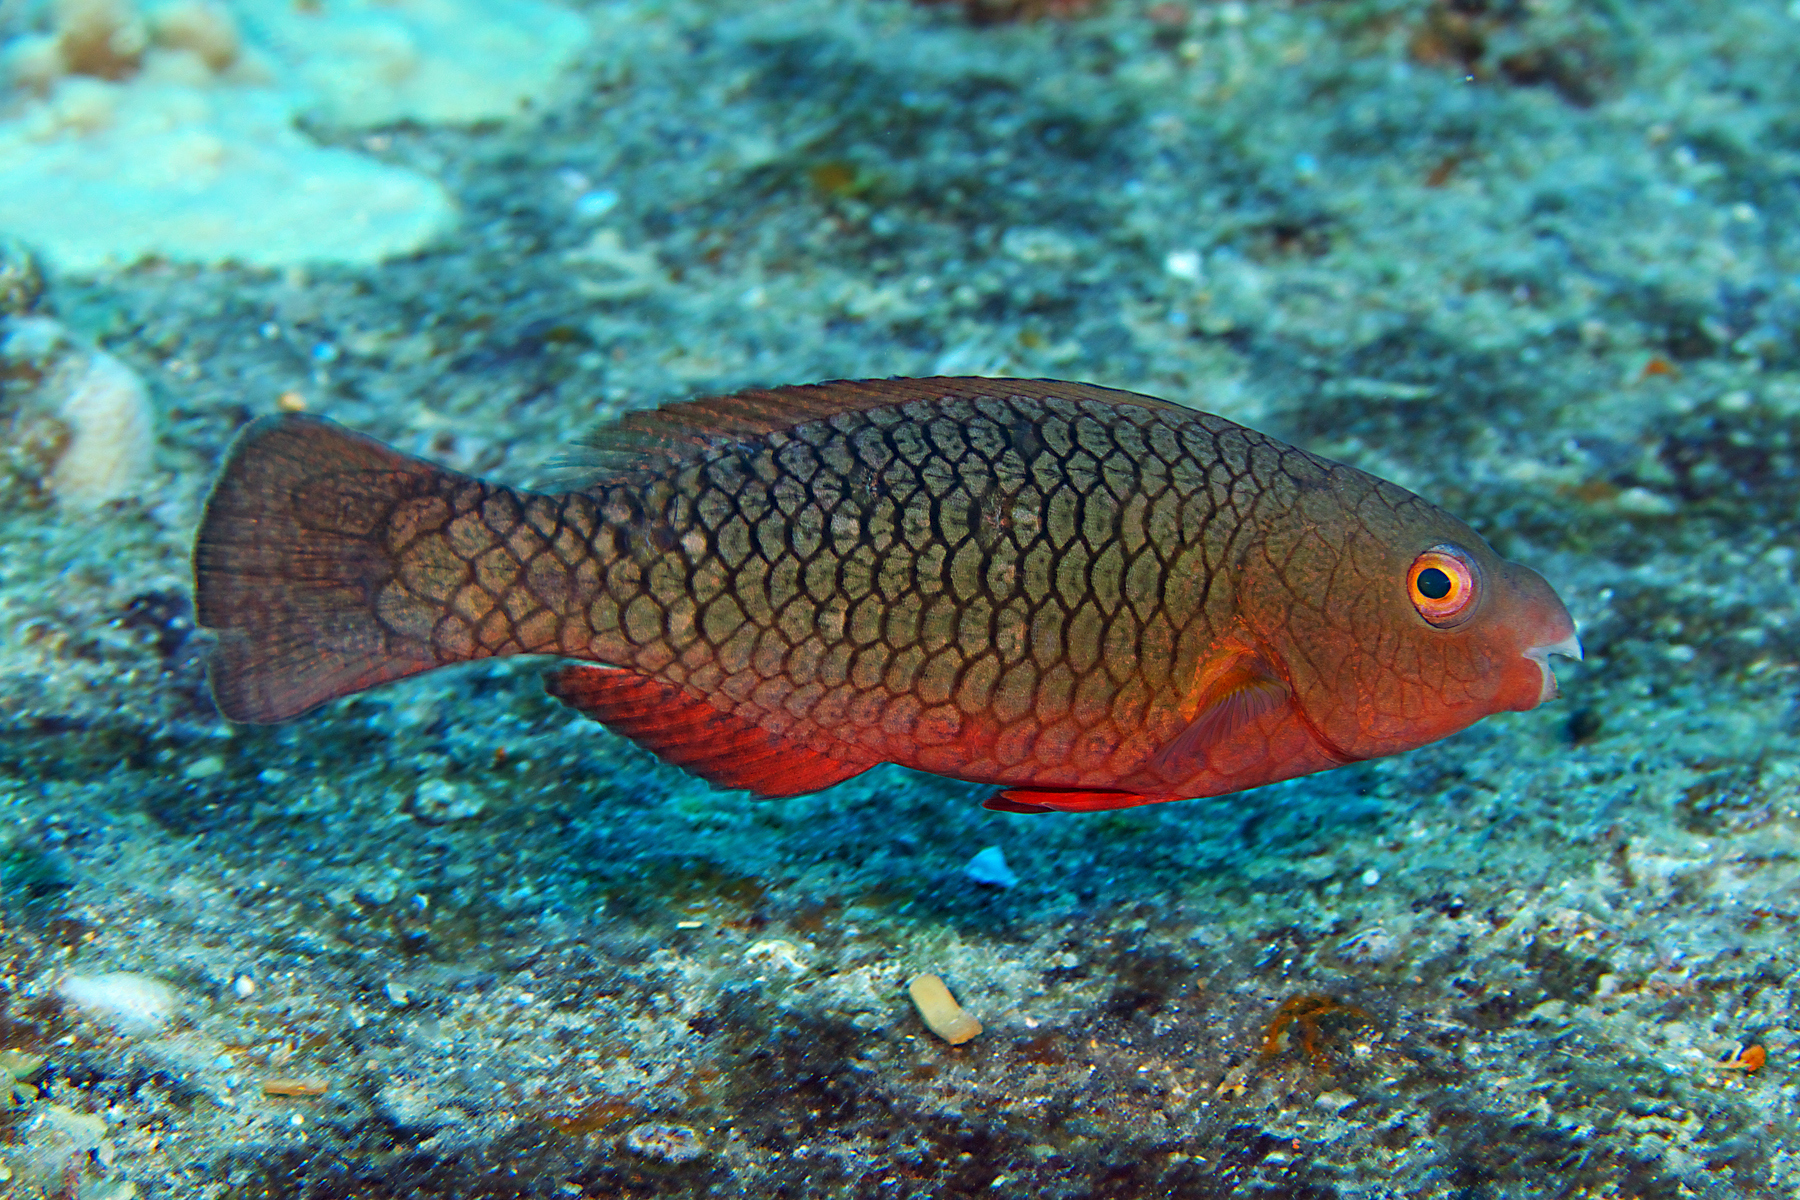
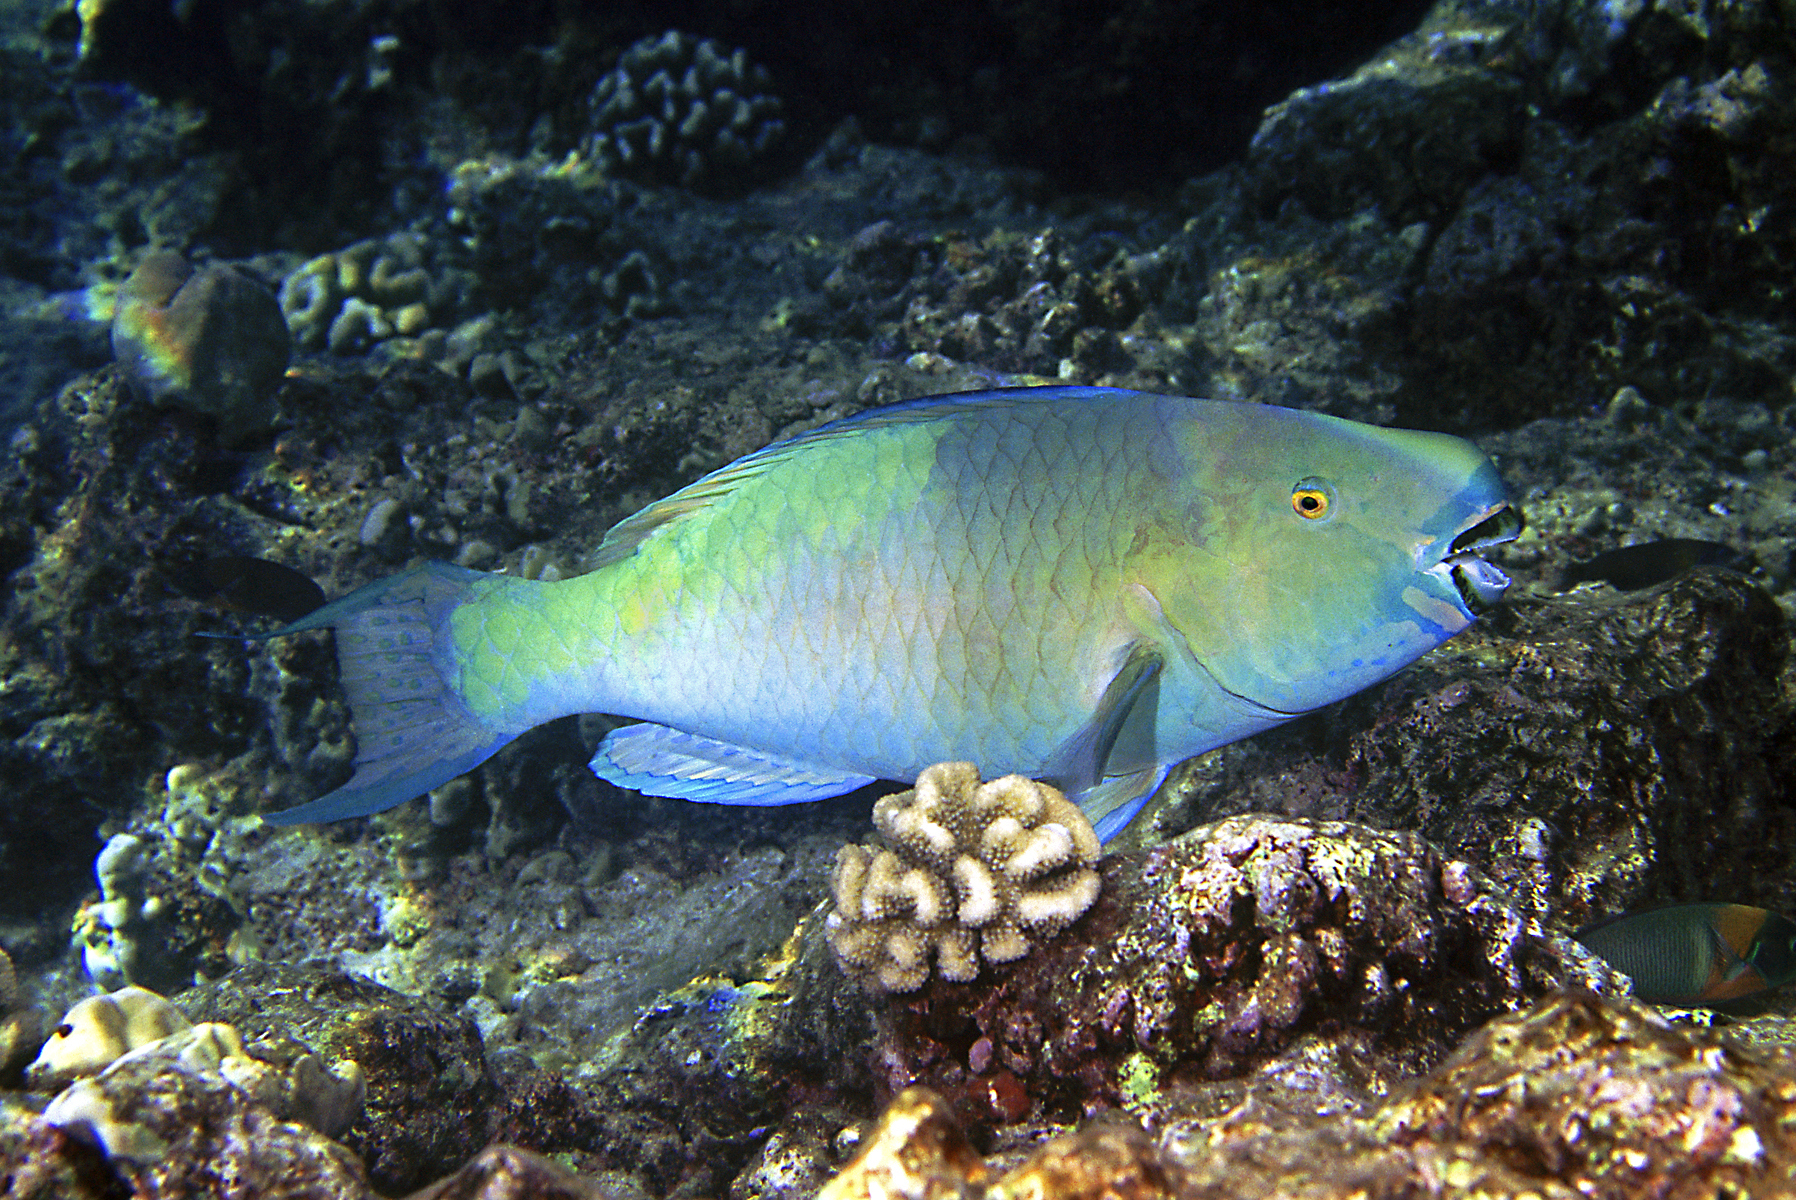
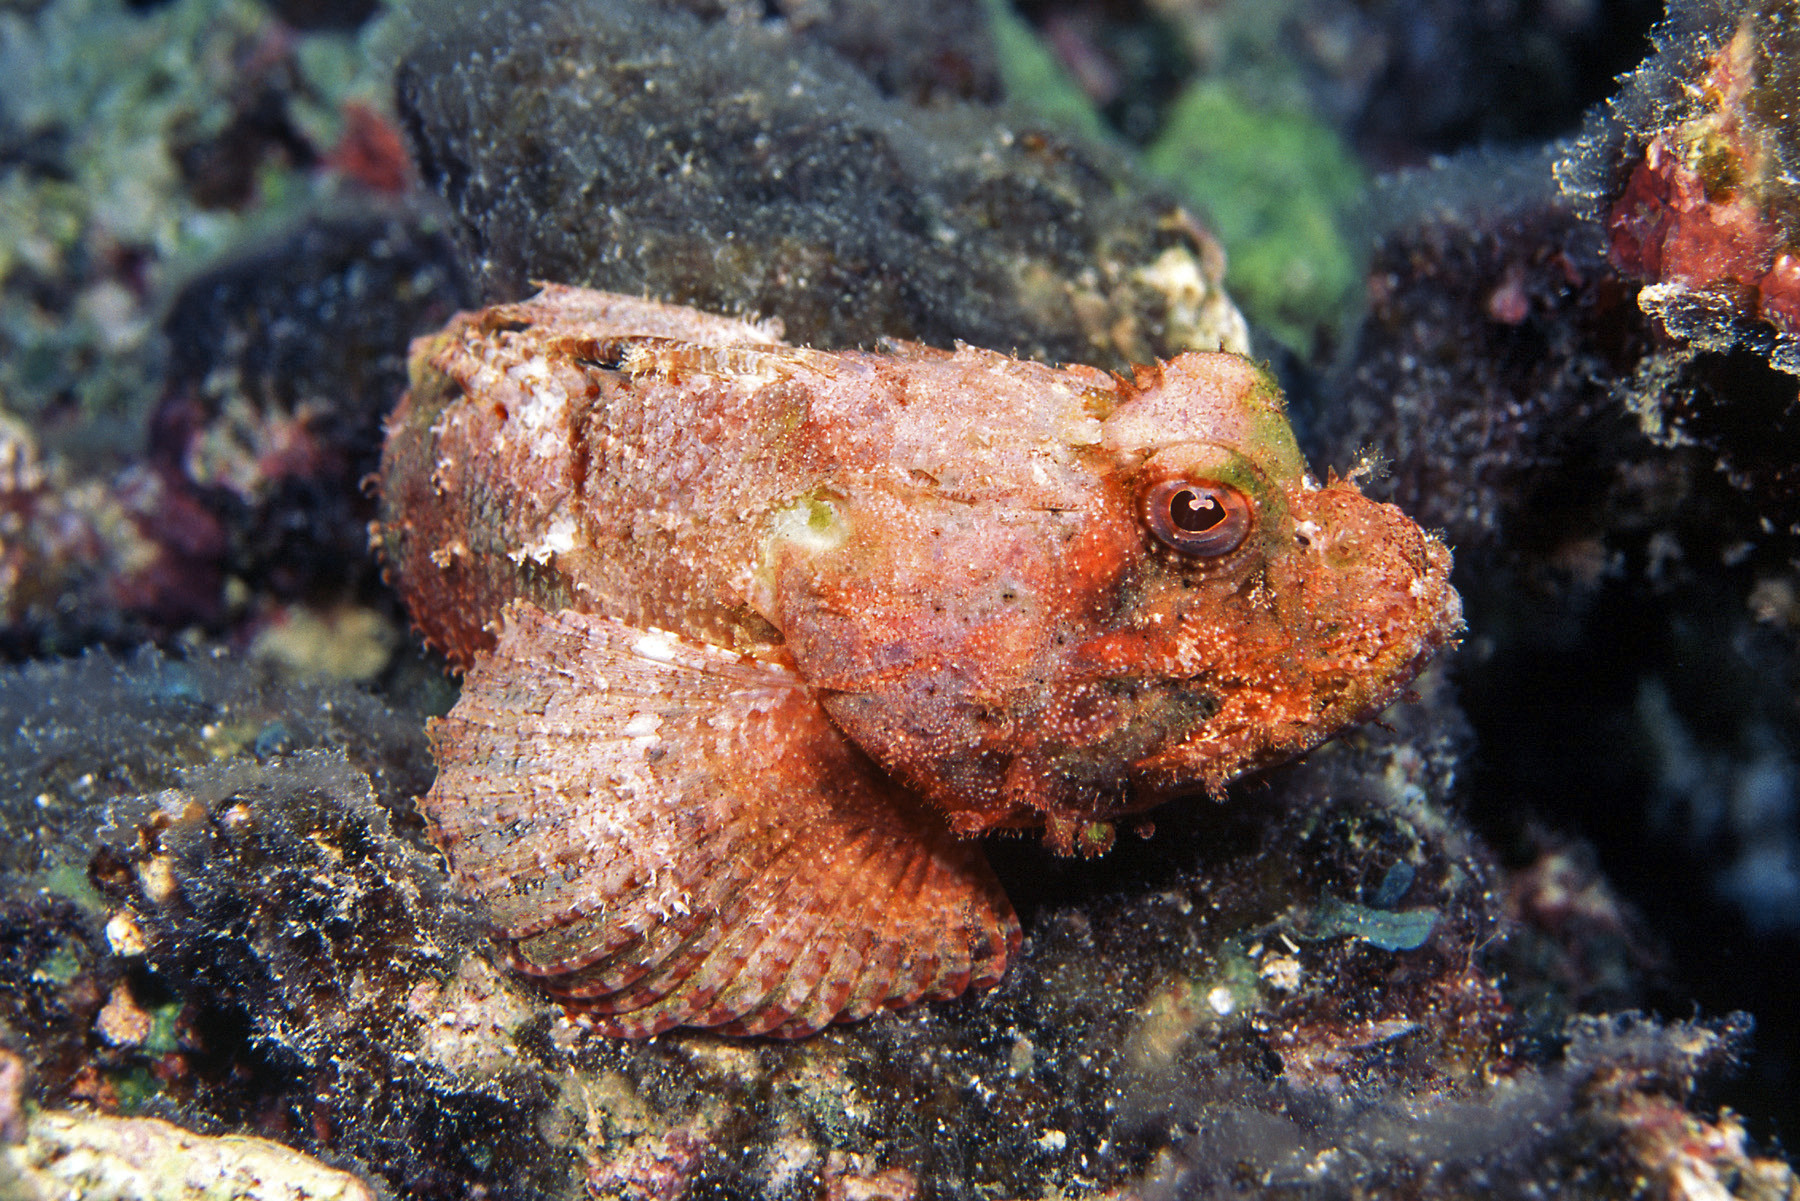
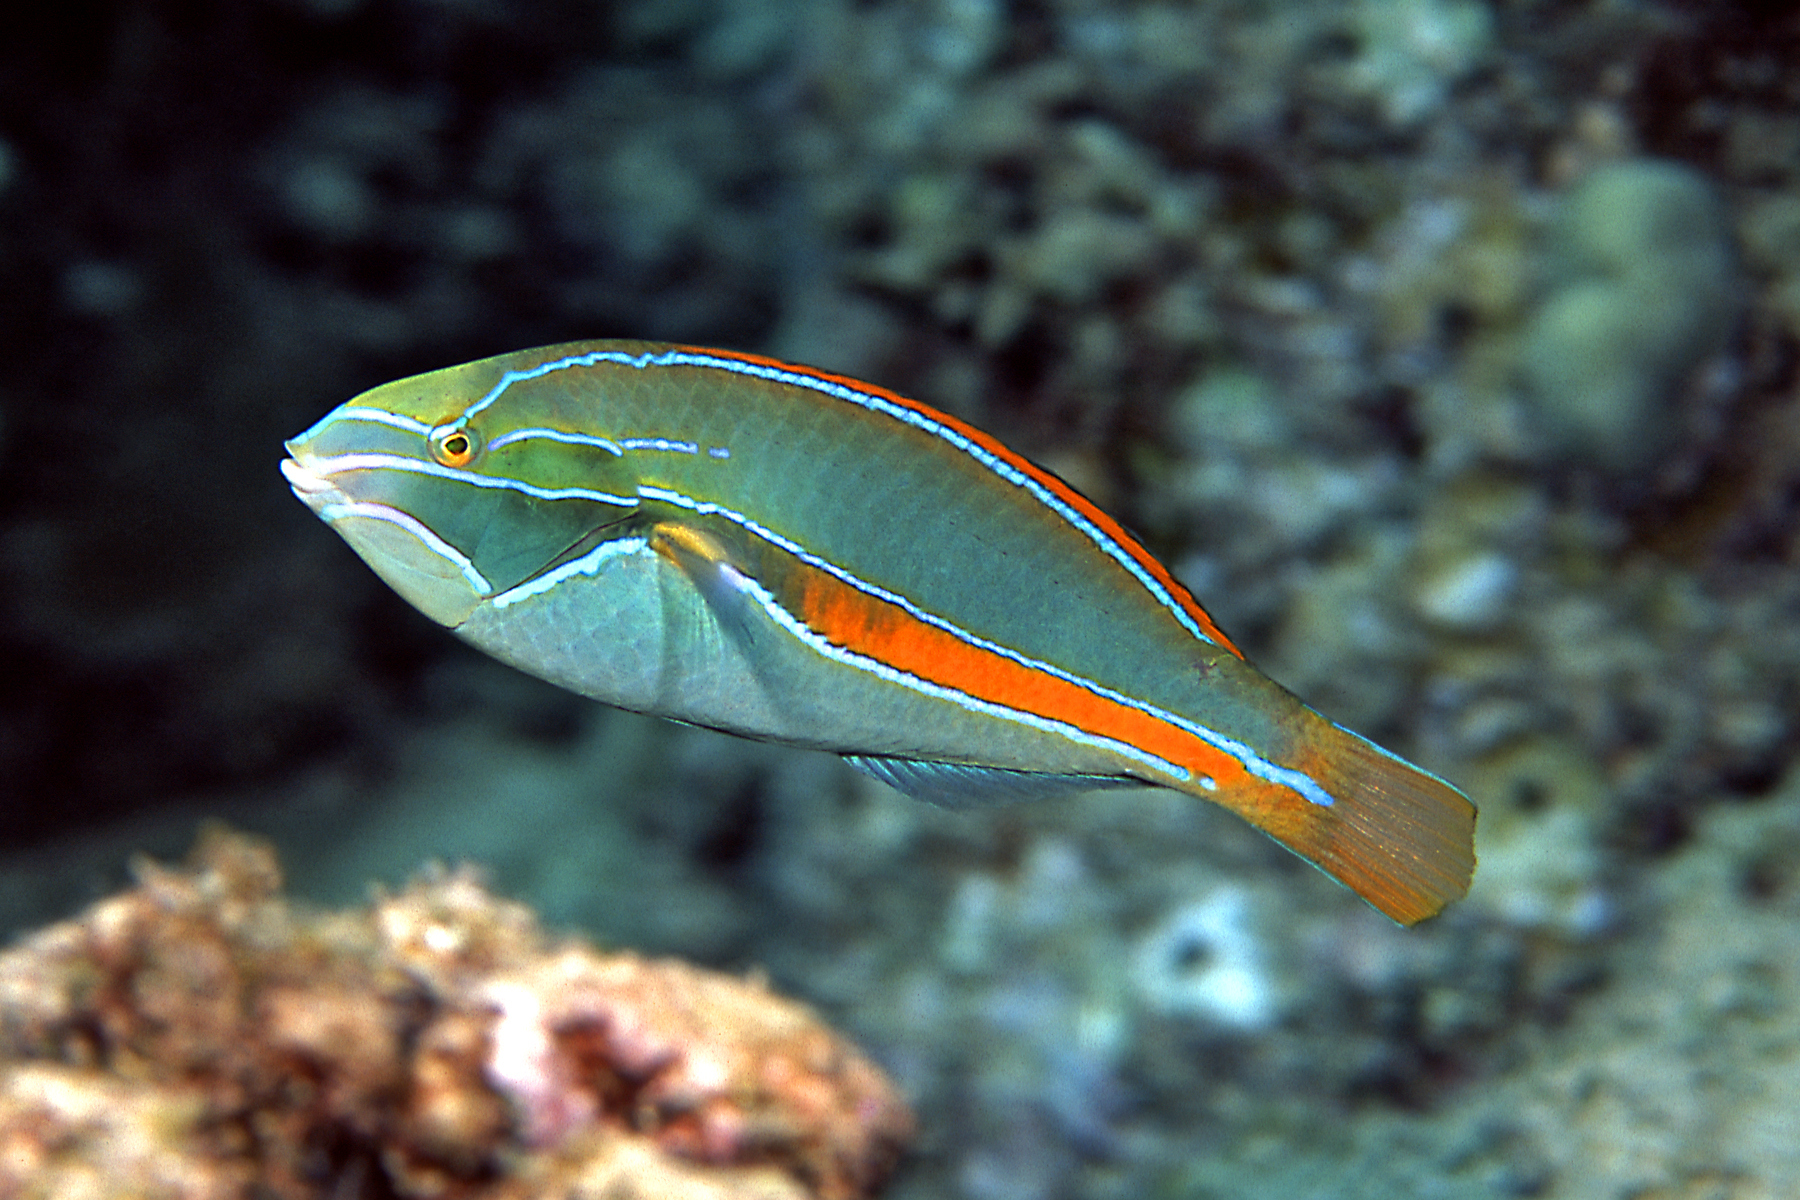
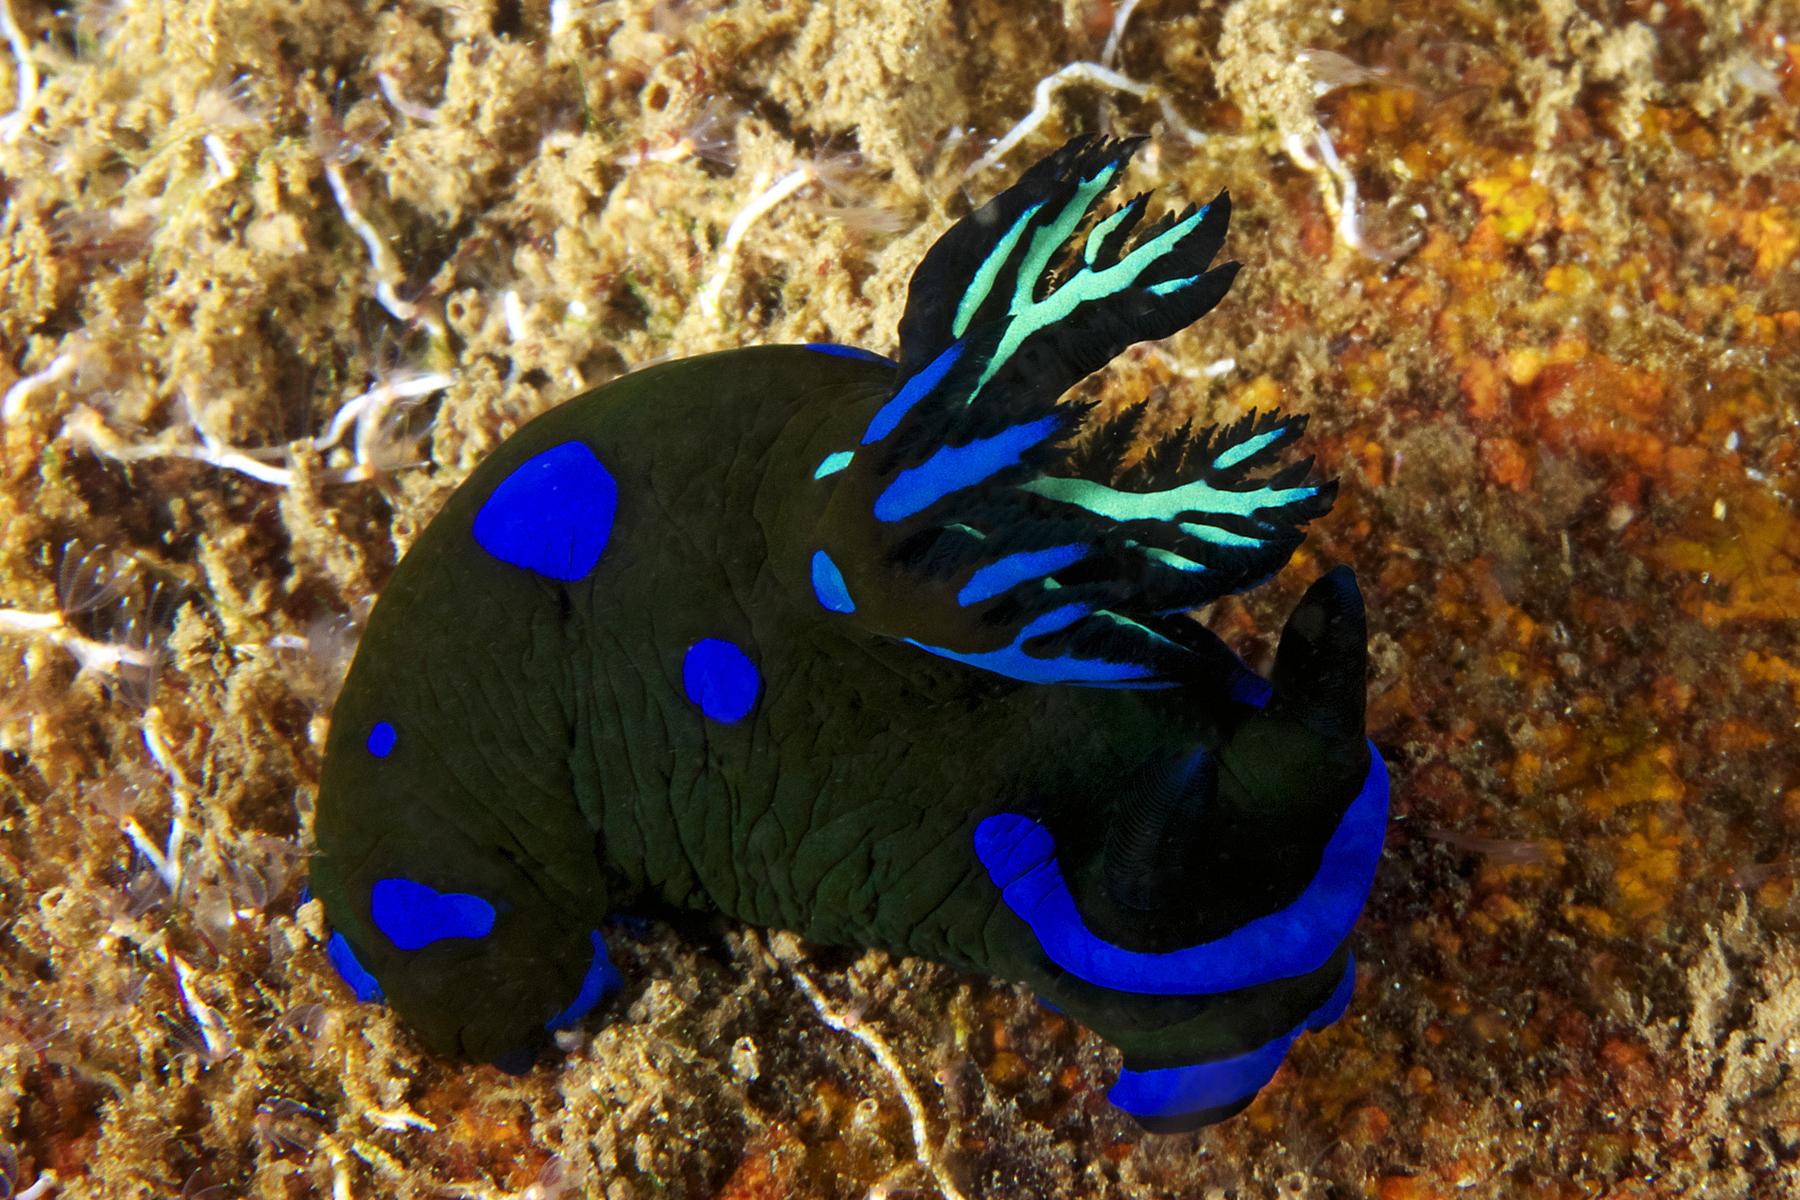
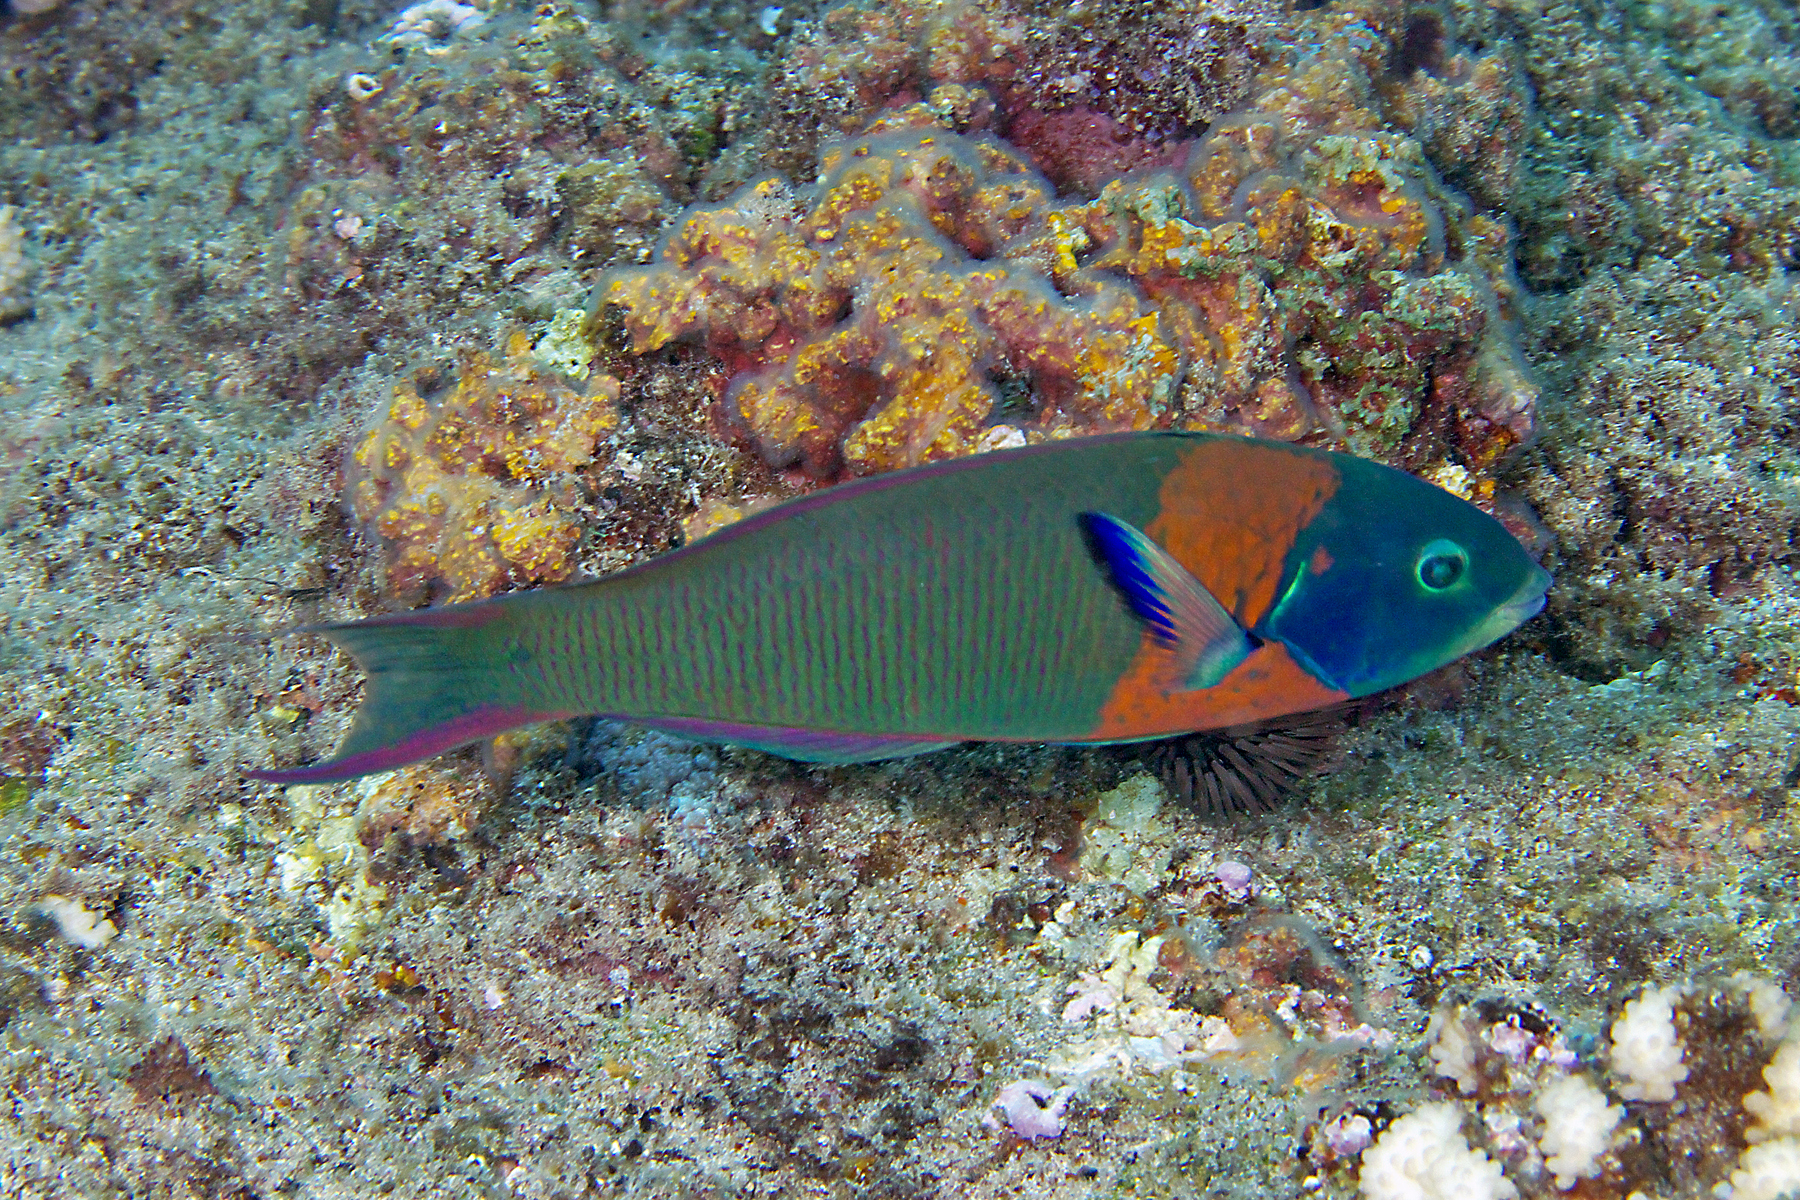
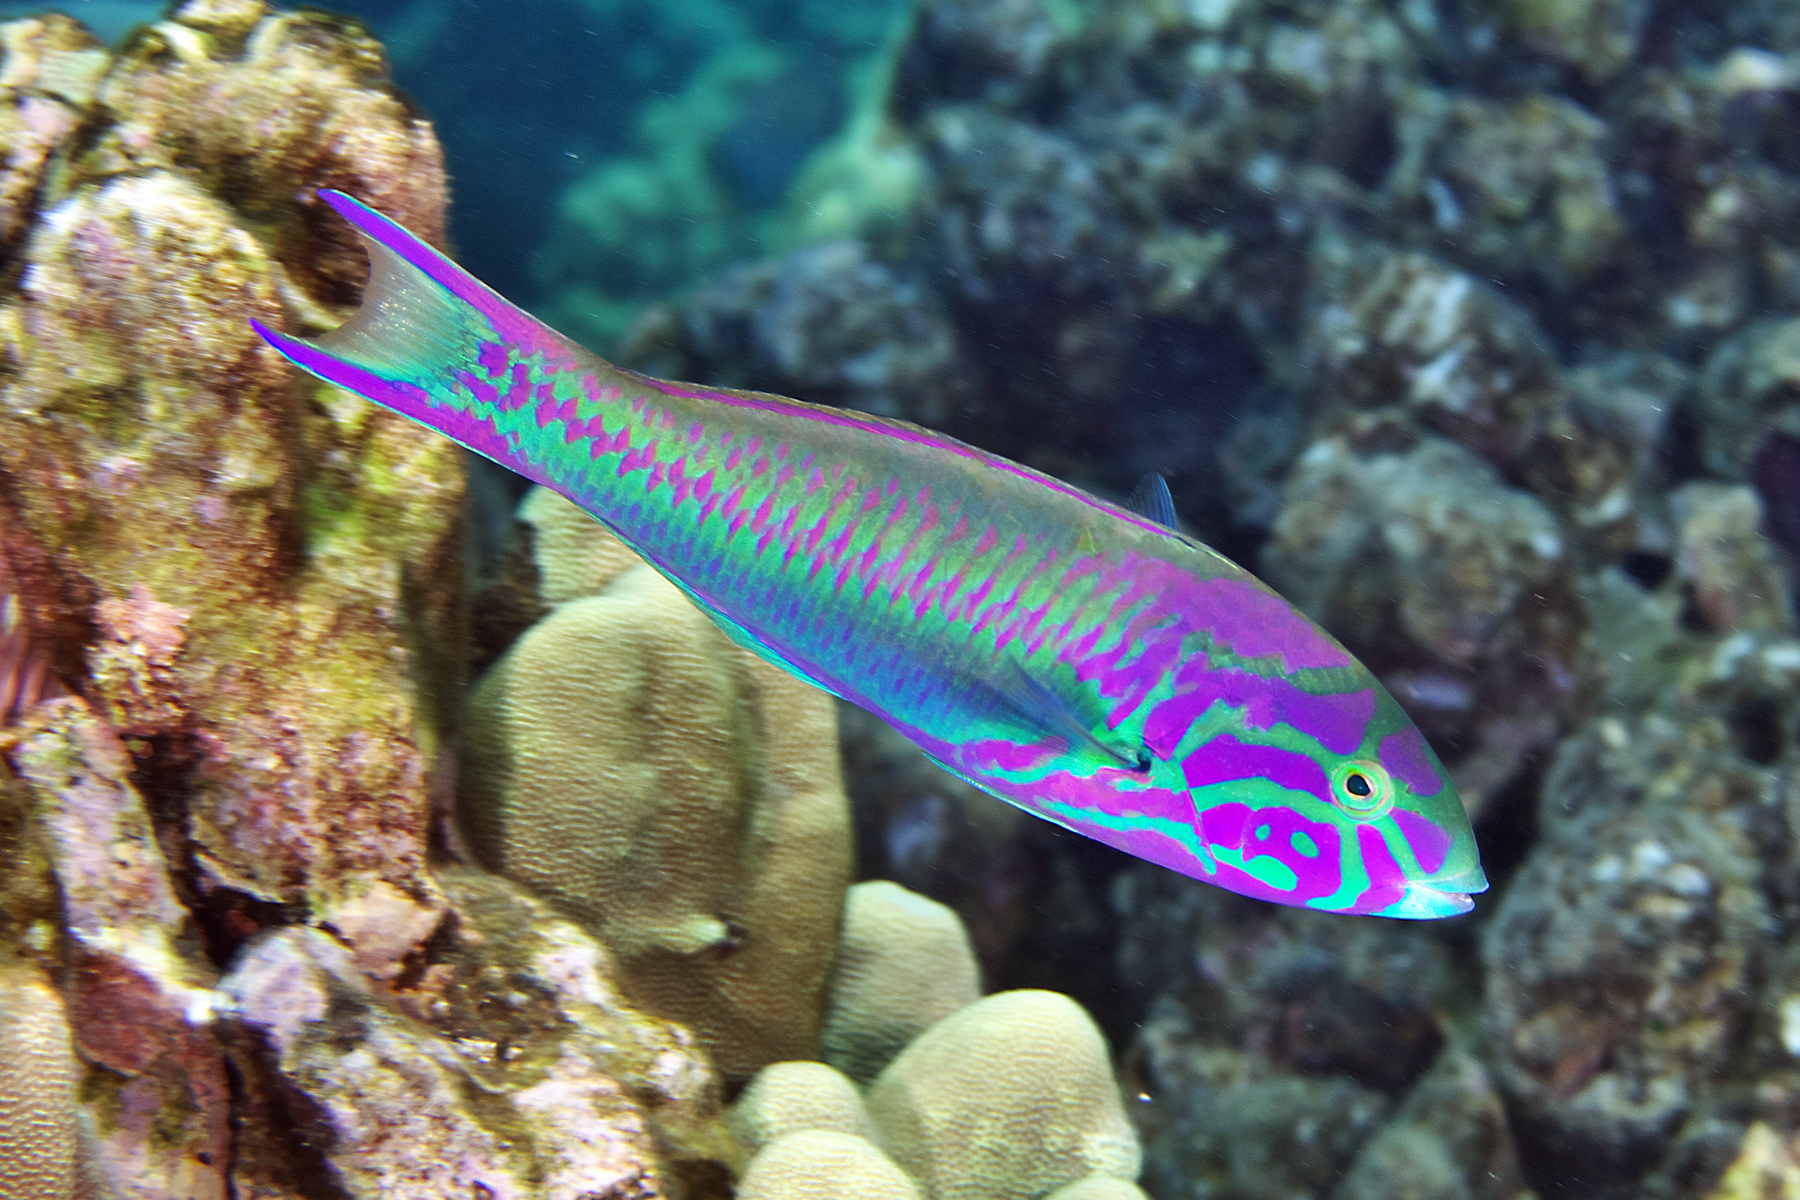
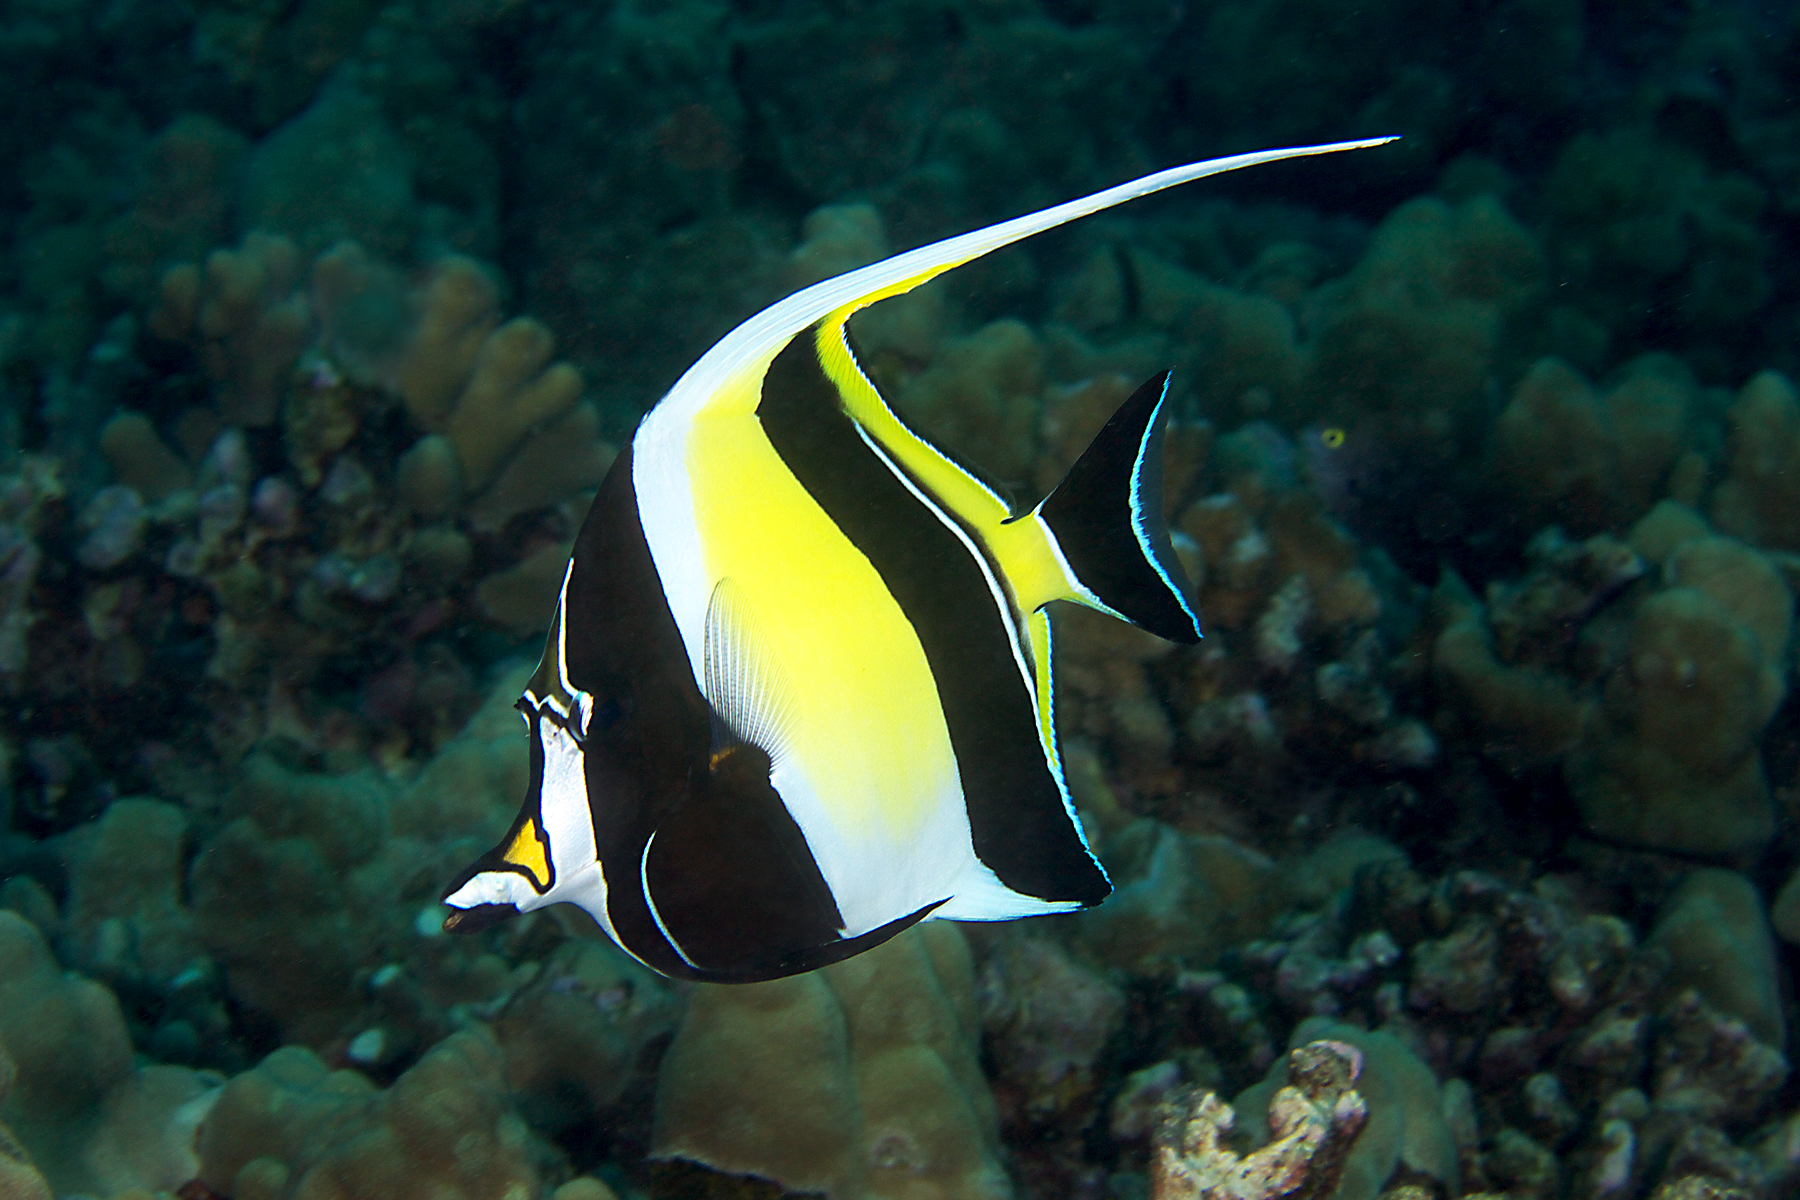
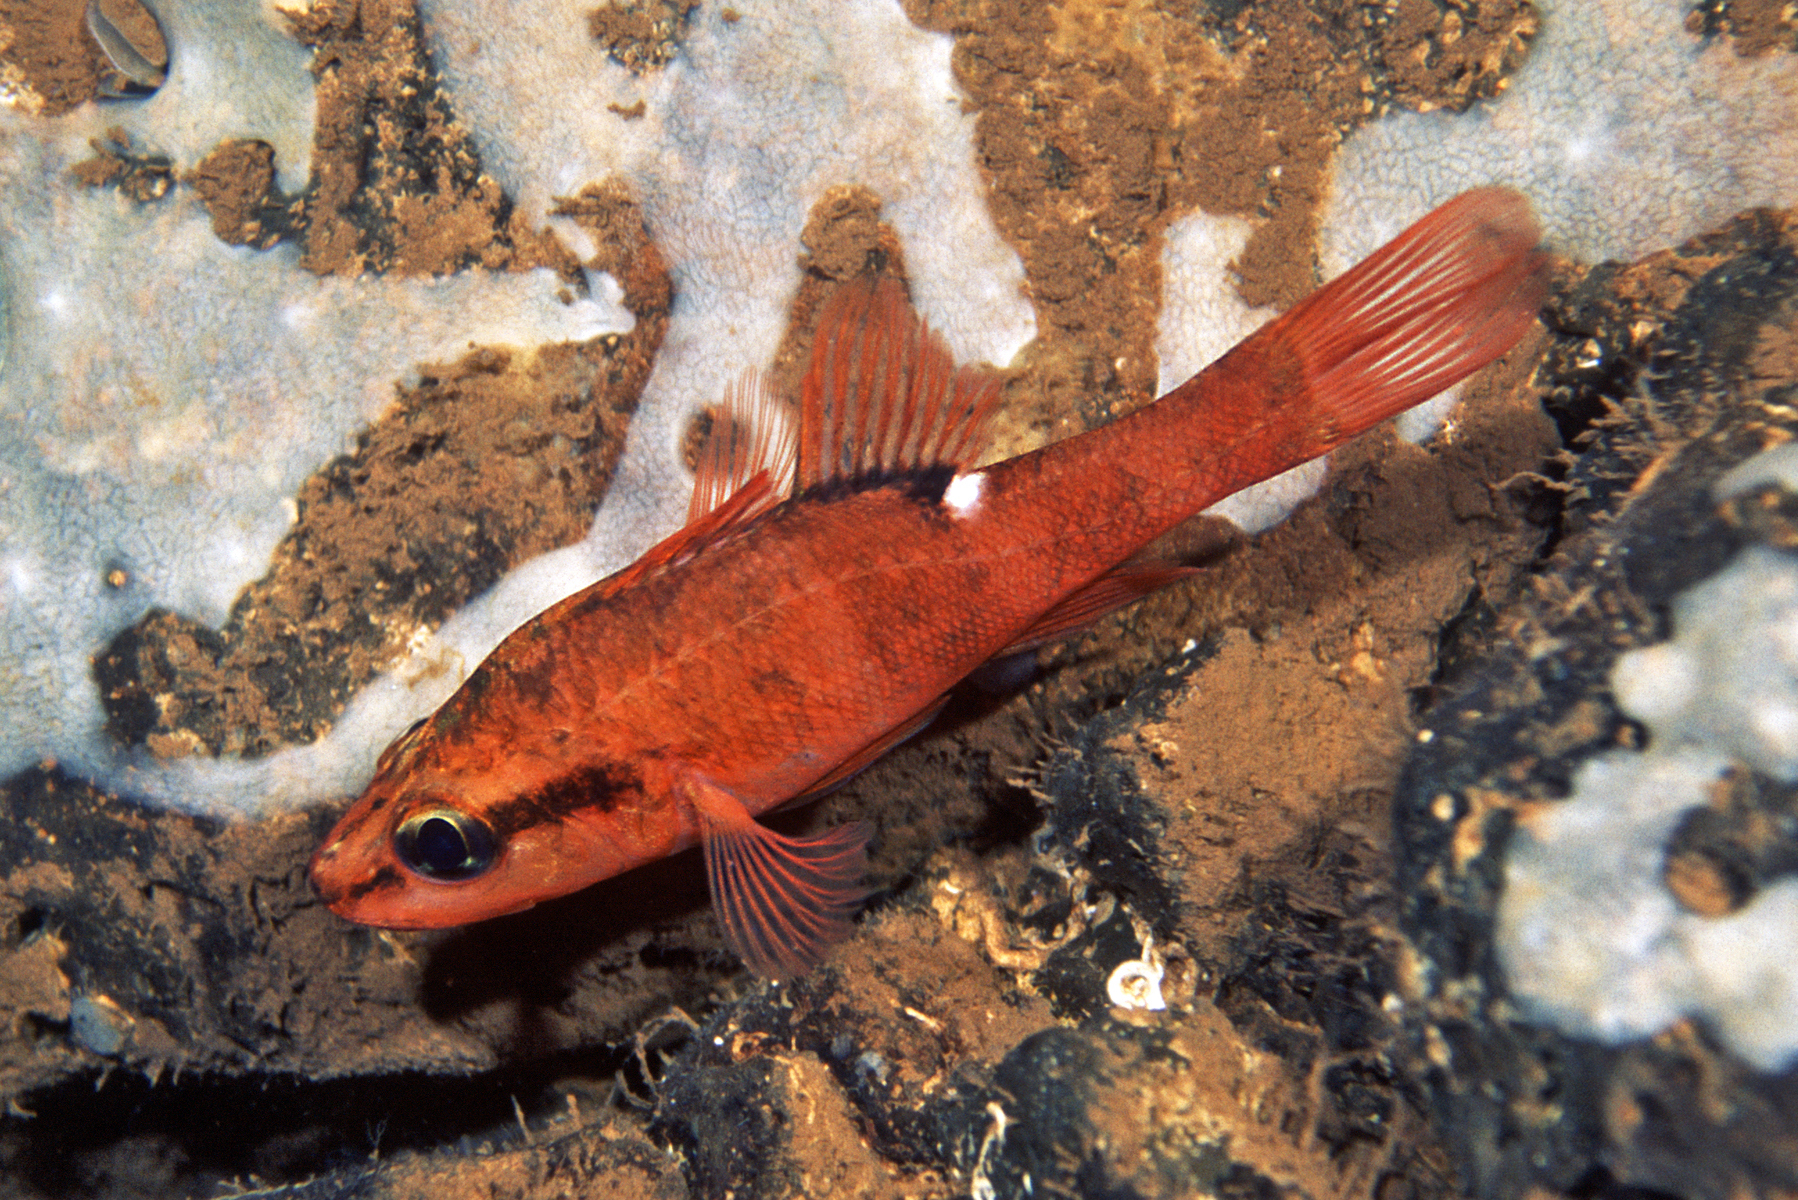
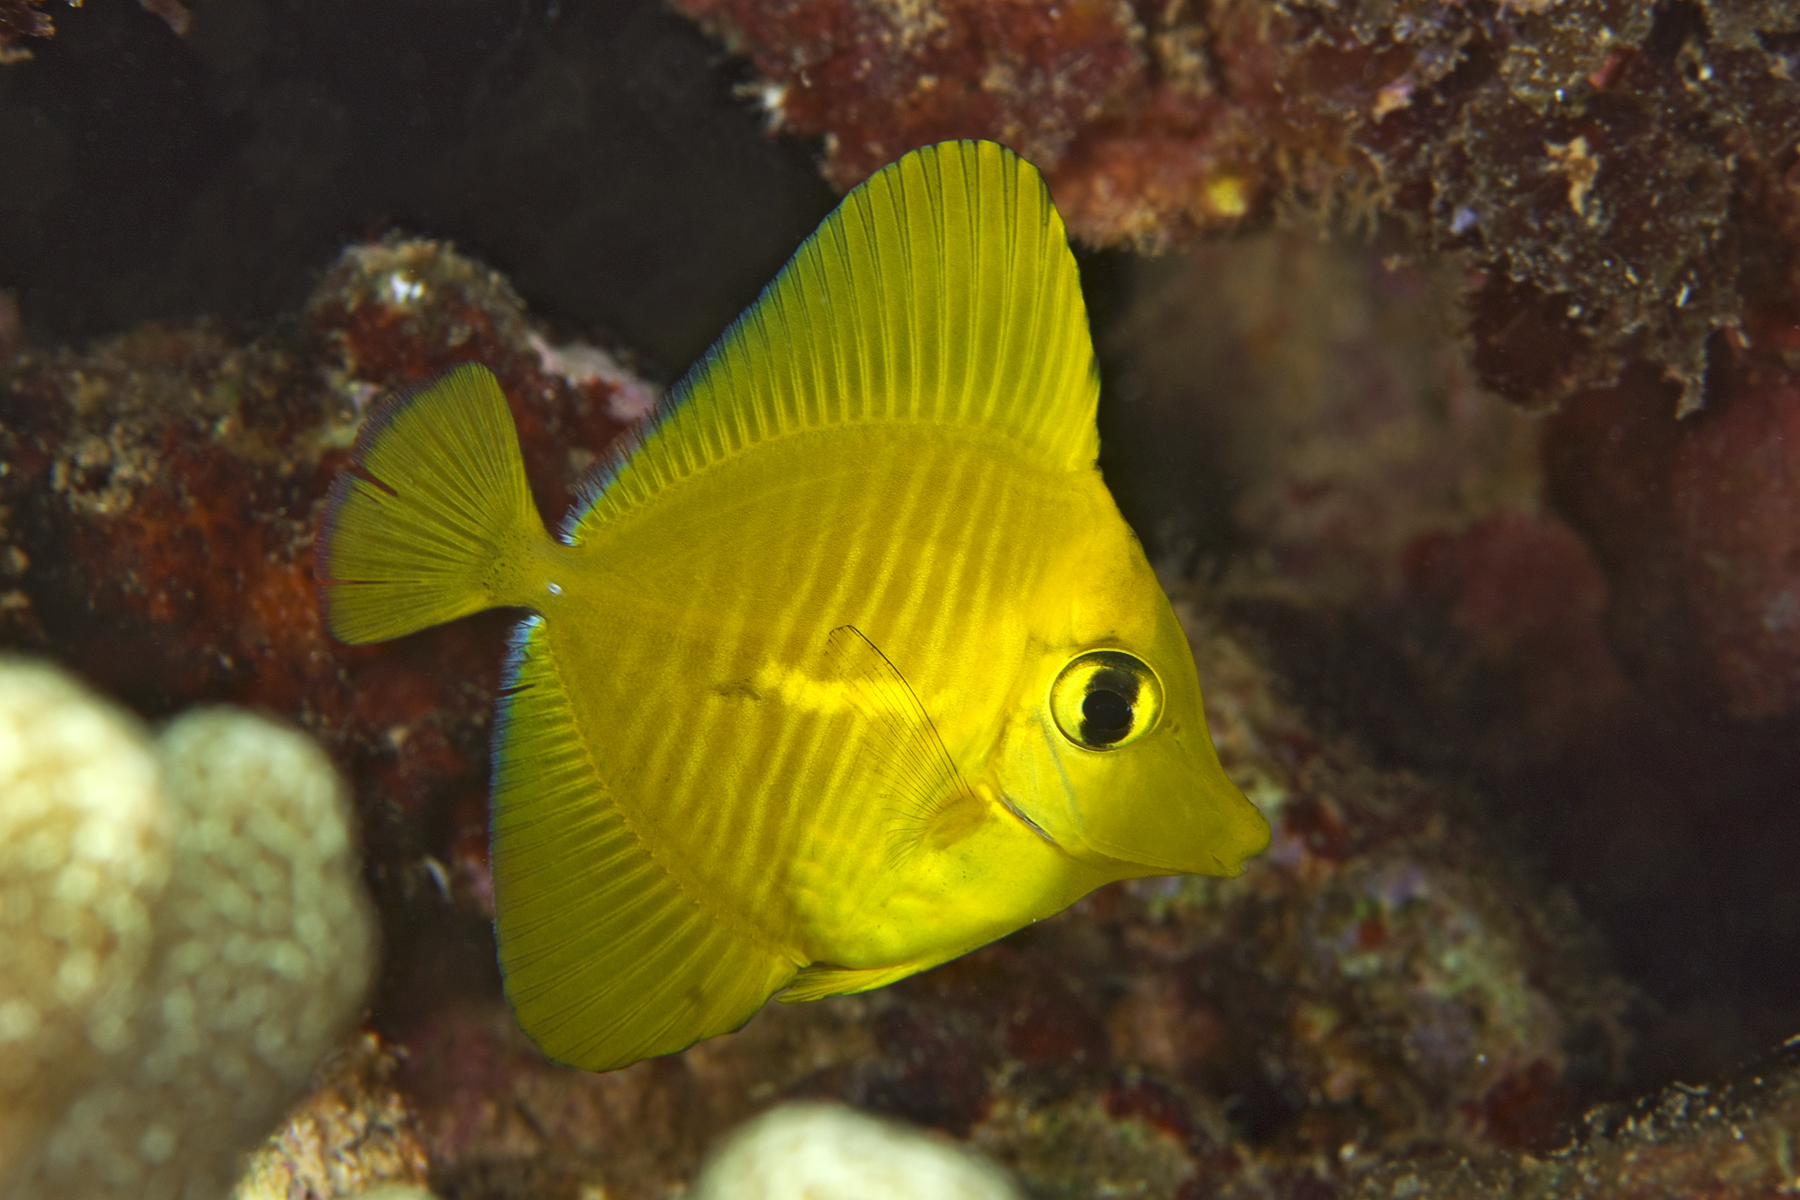
Do you know what species live downstream from your flushes in nearshore reef ecosystems?
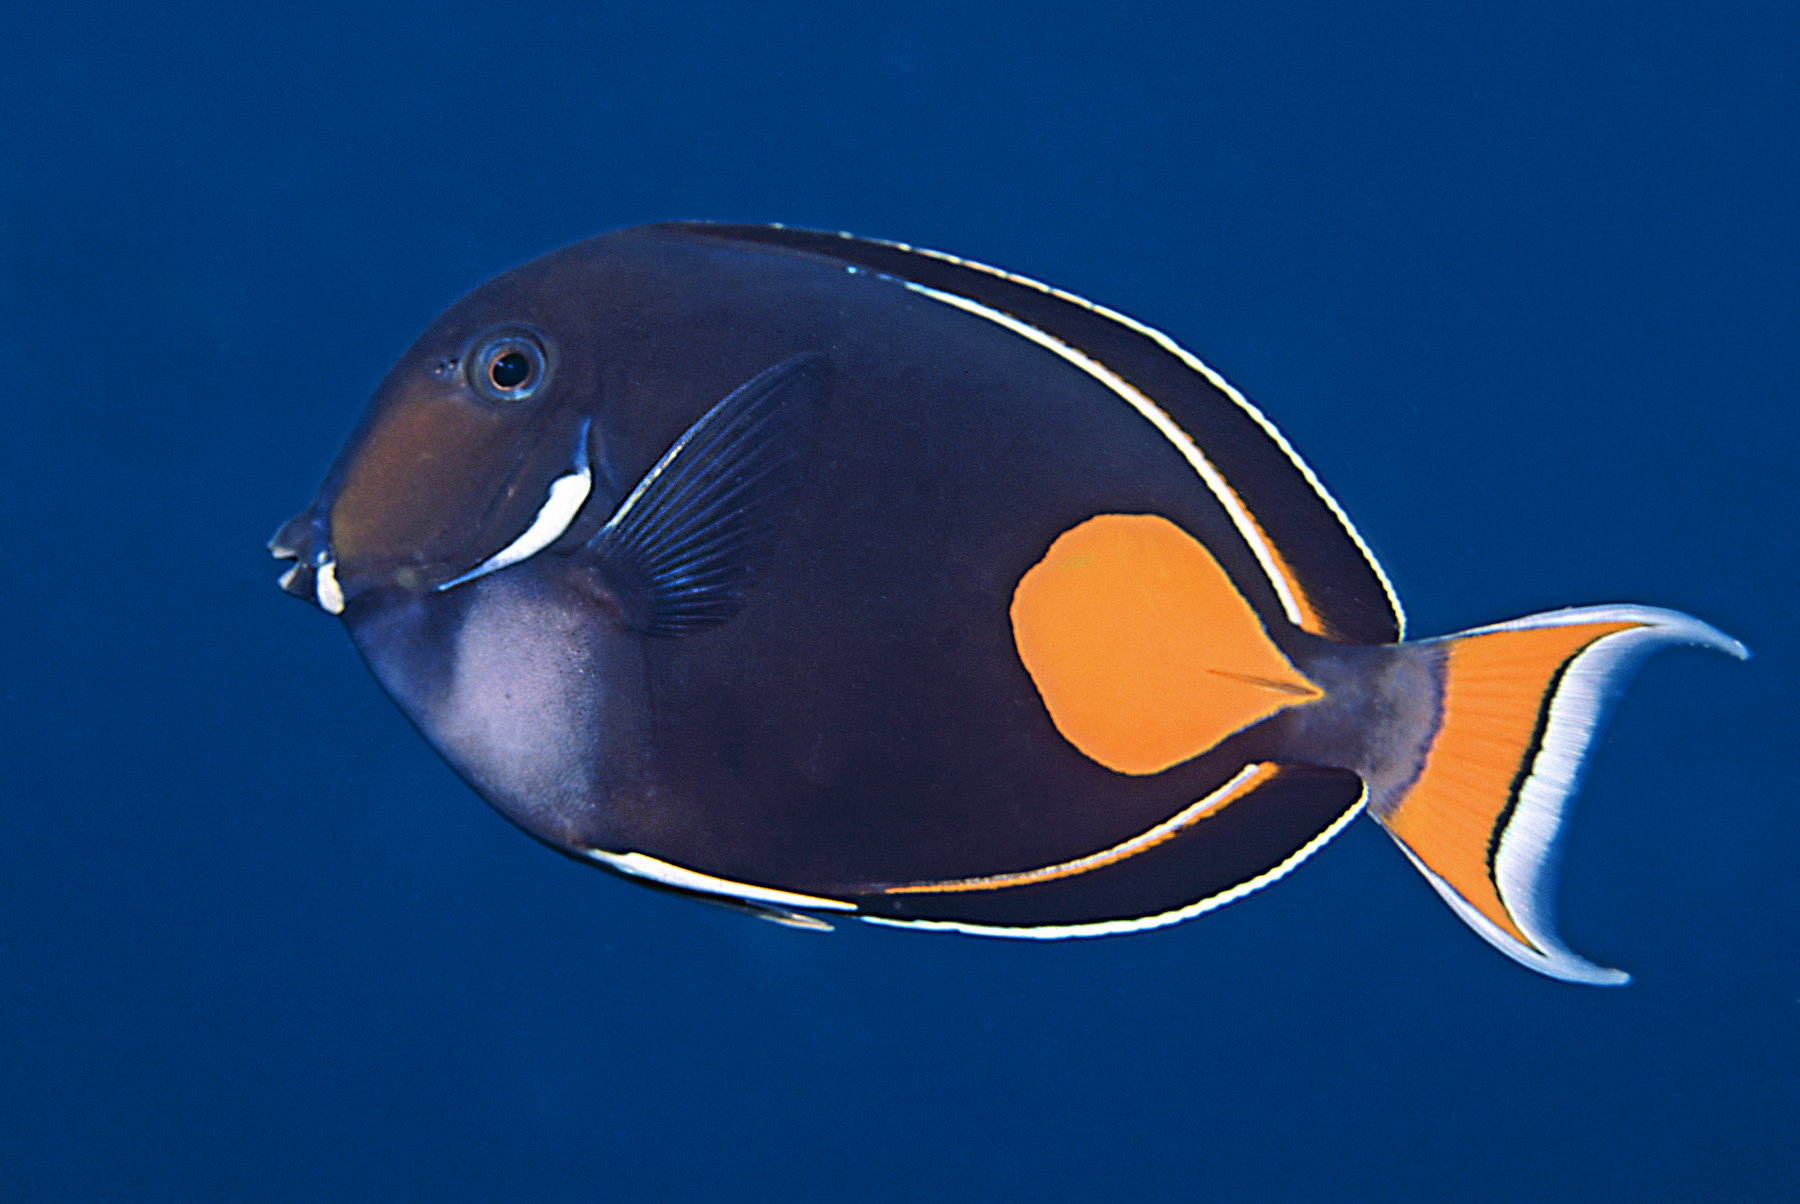
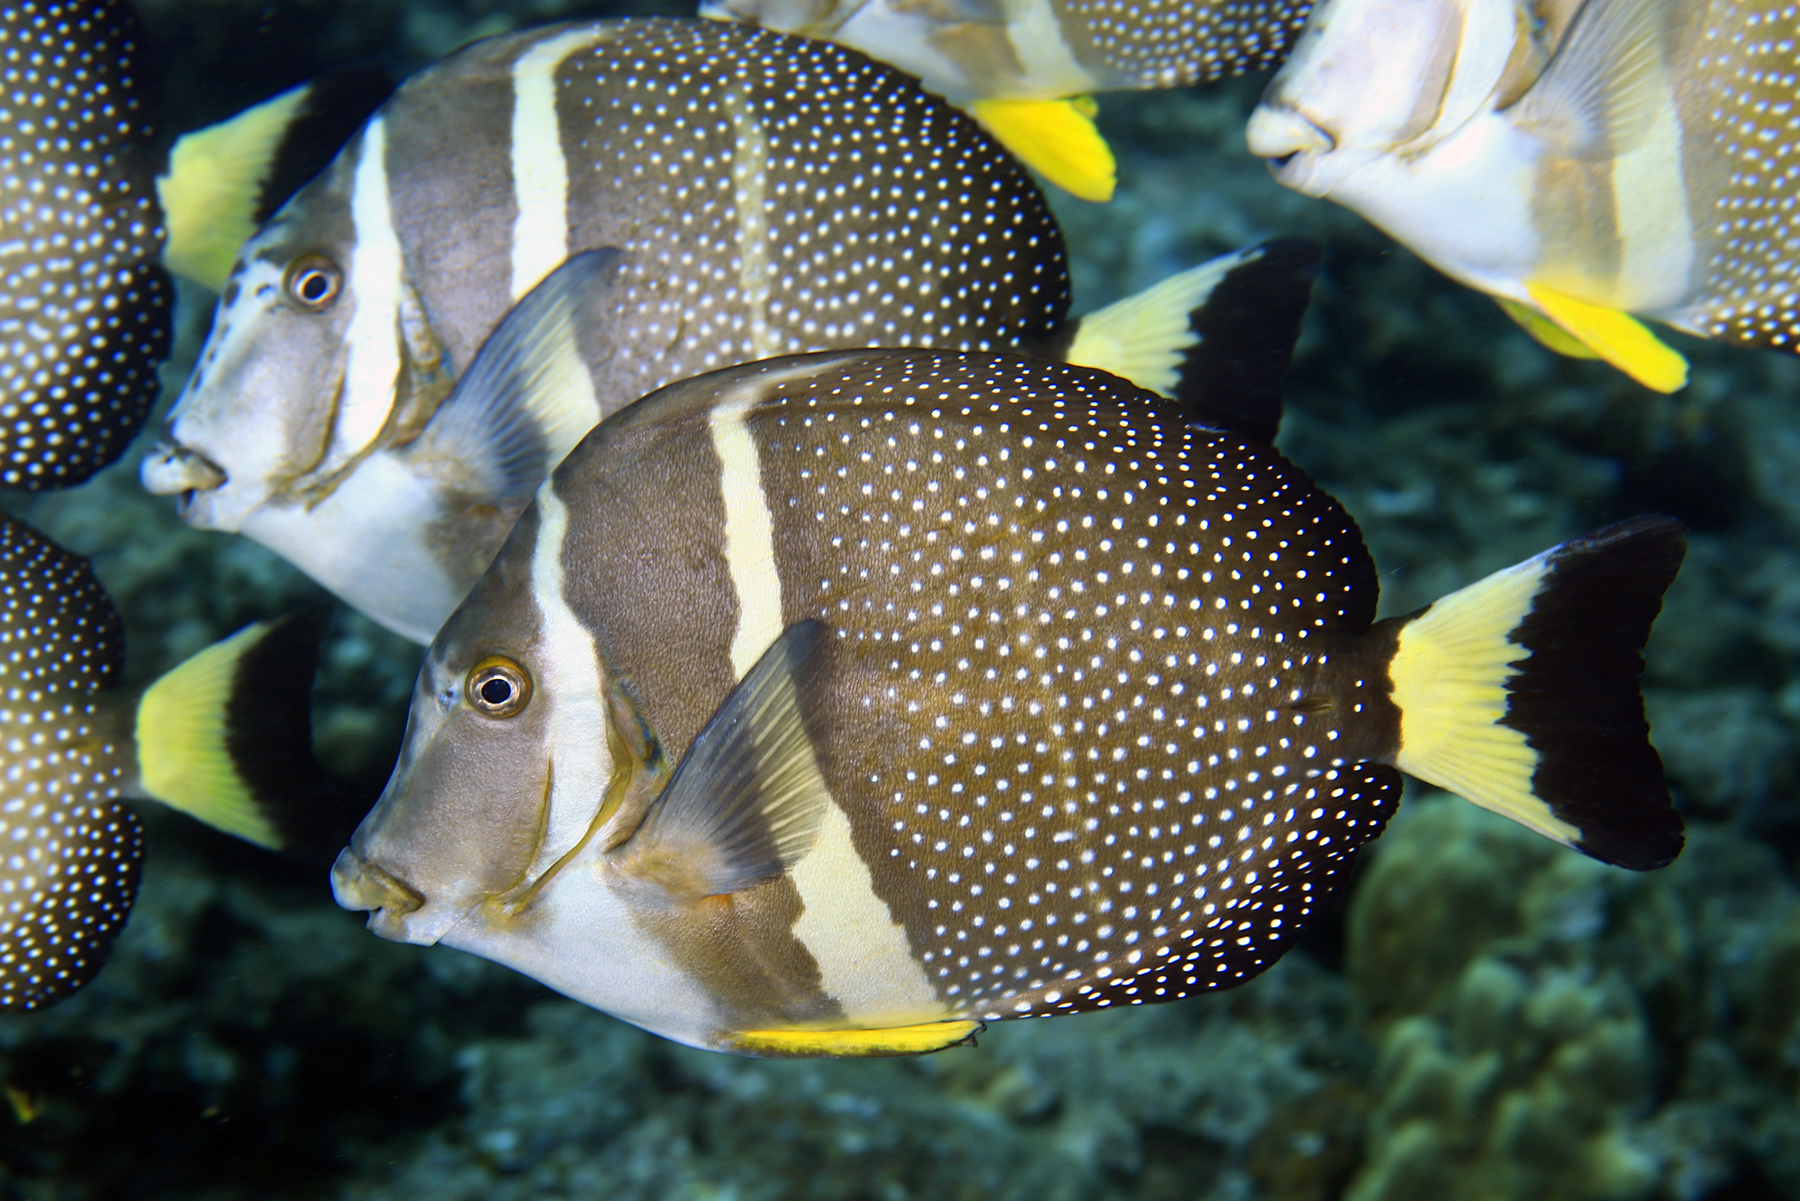
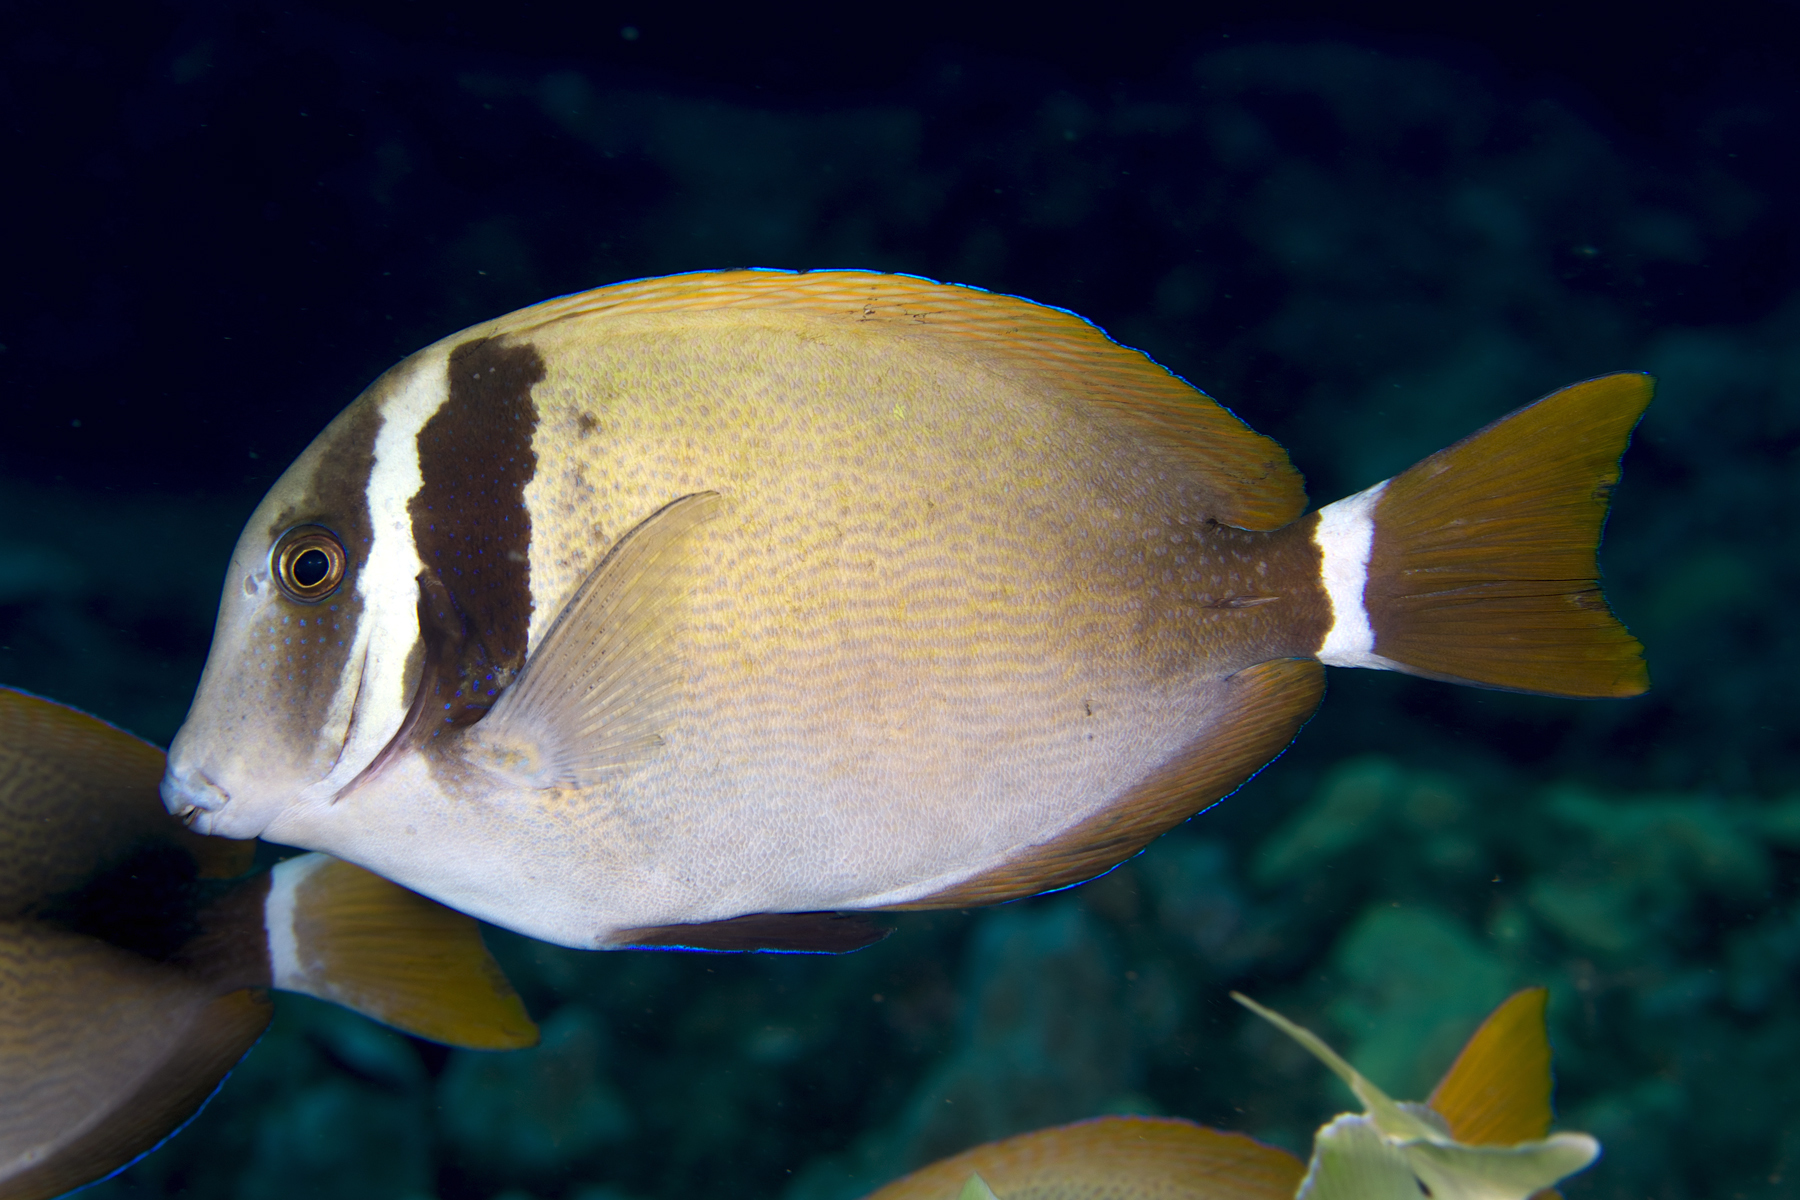
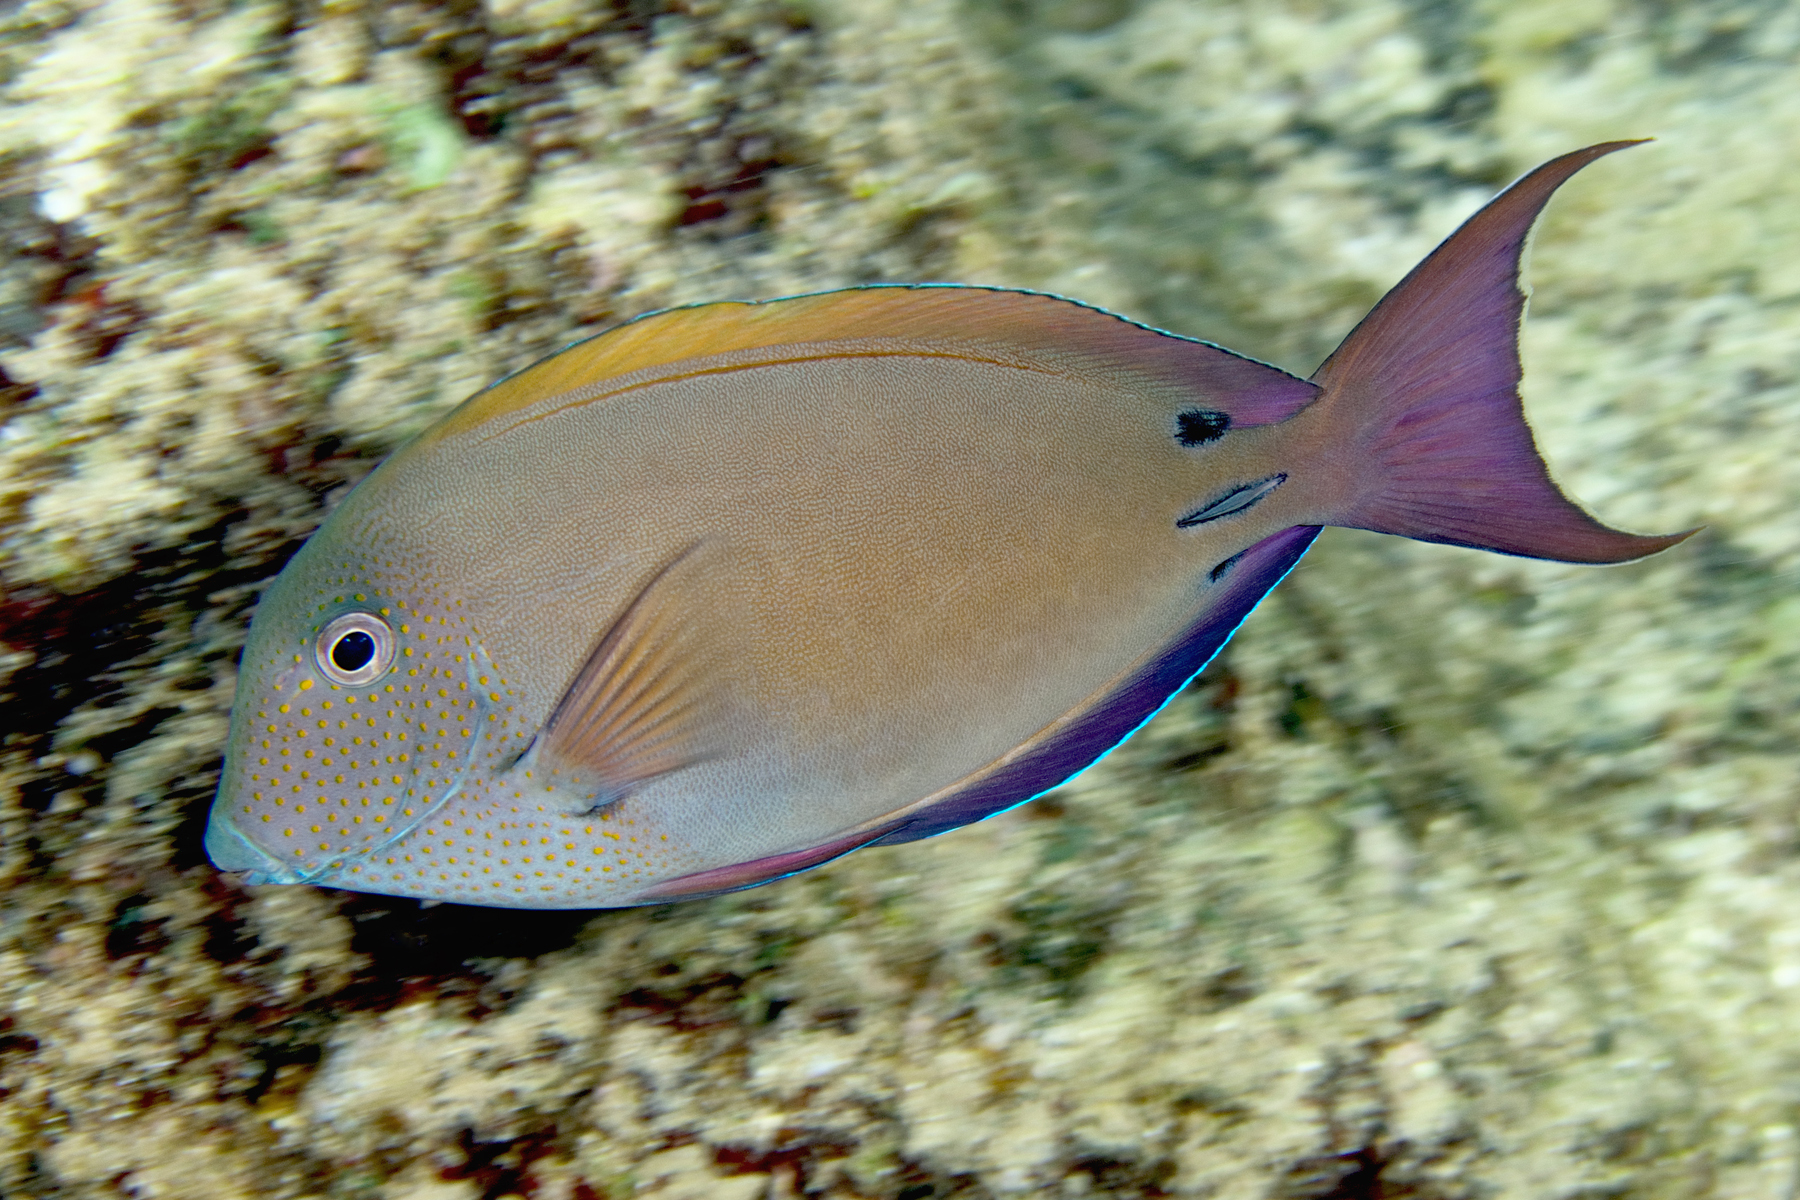
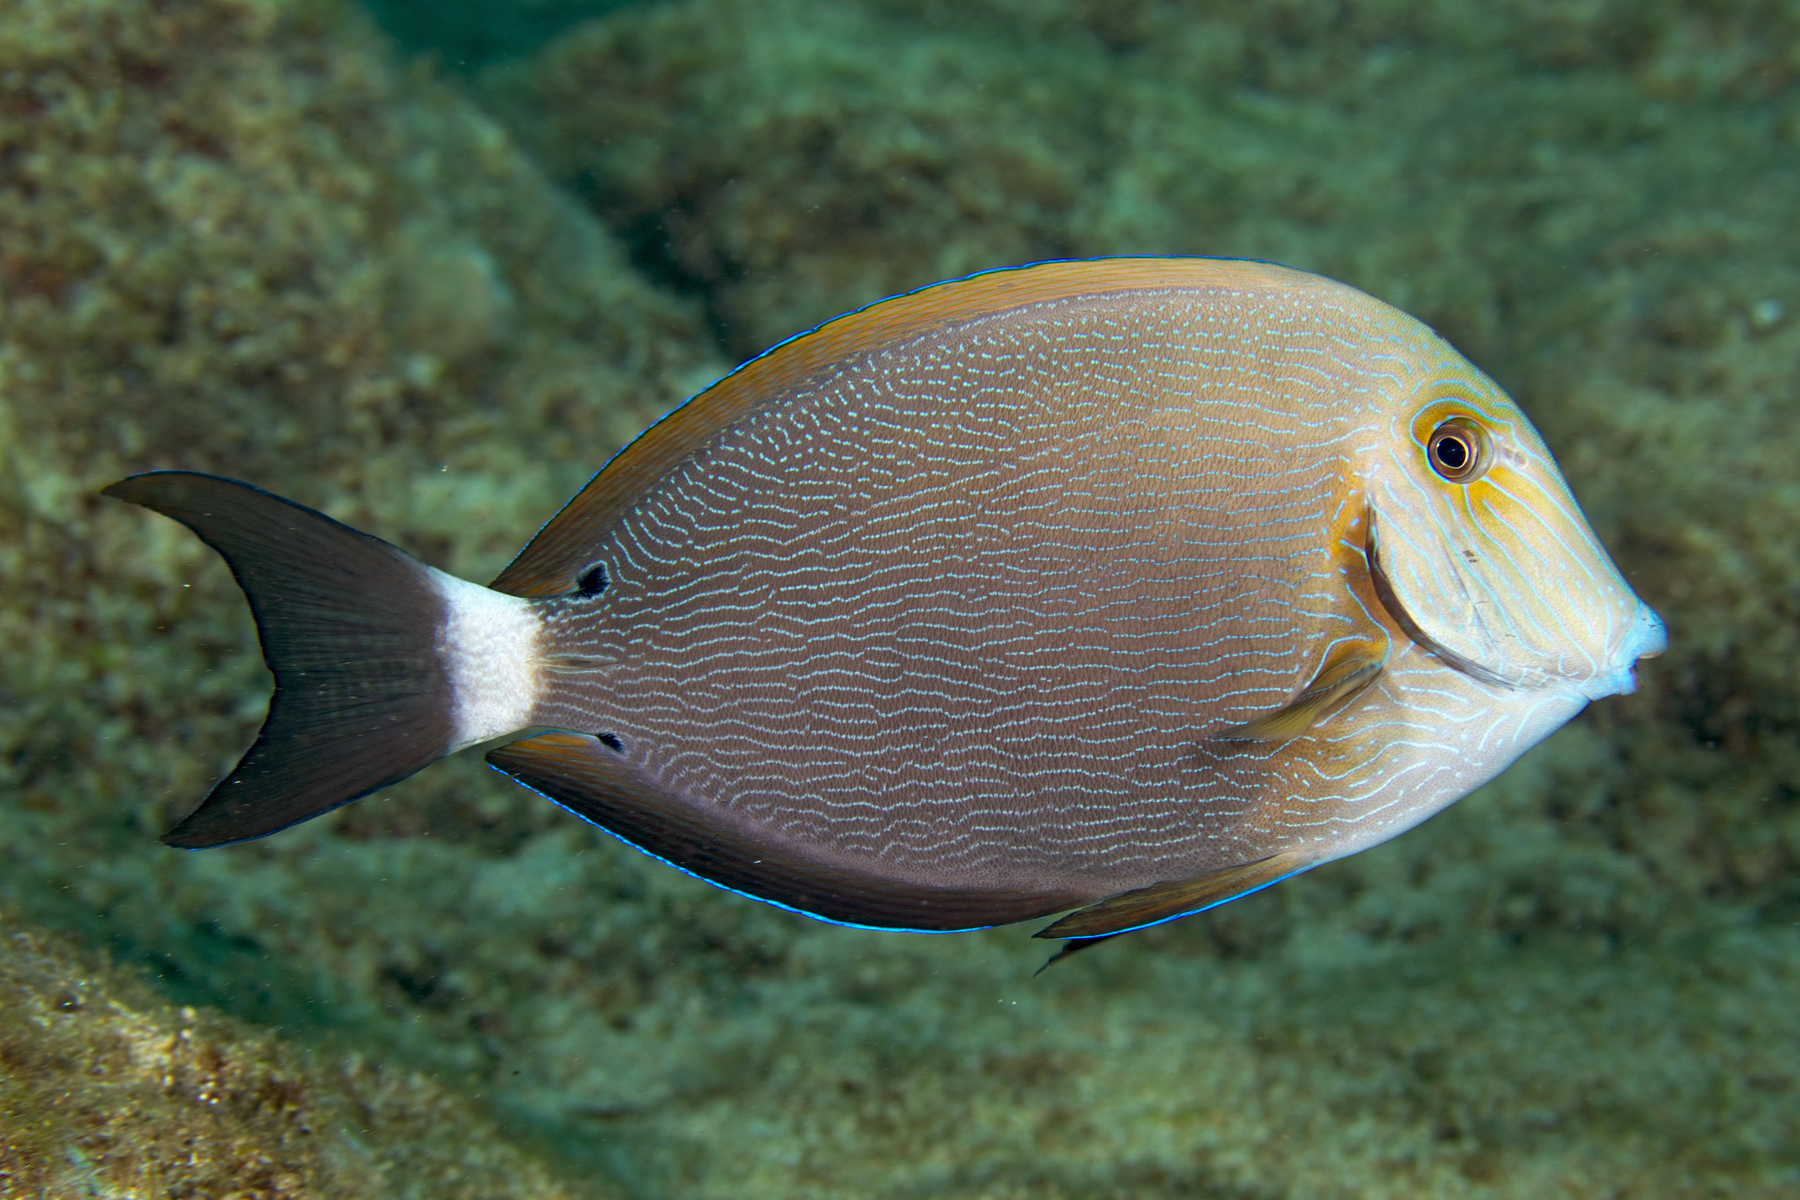
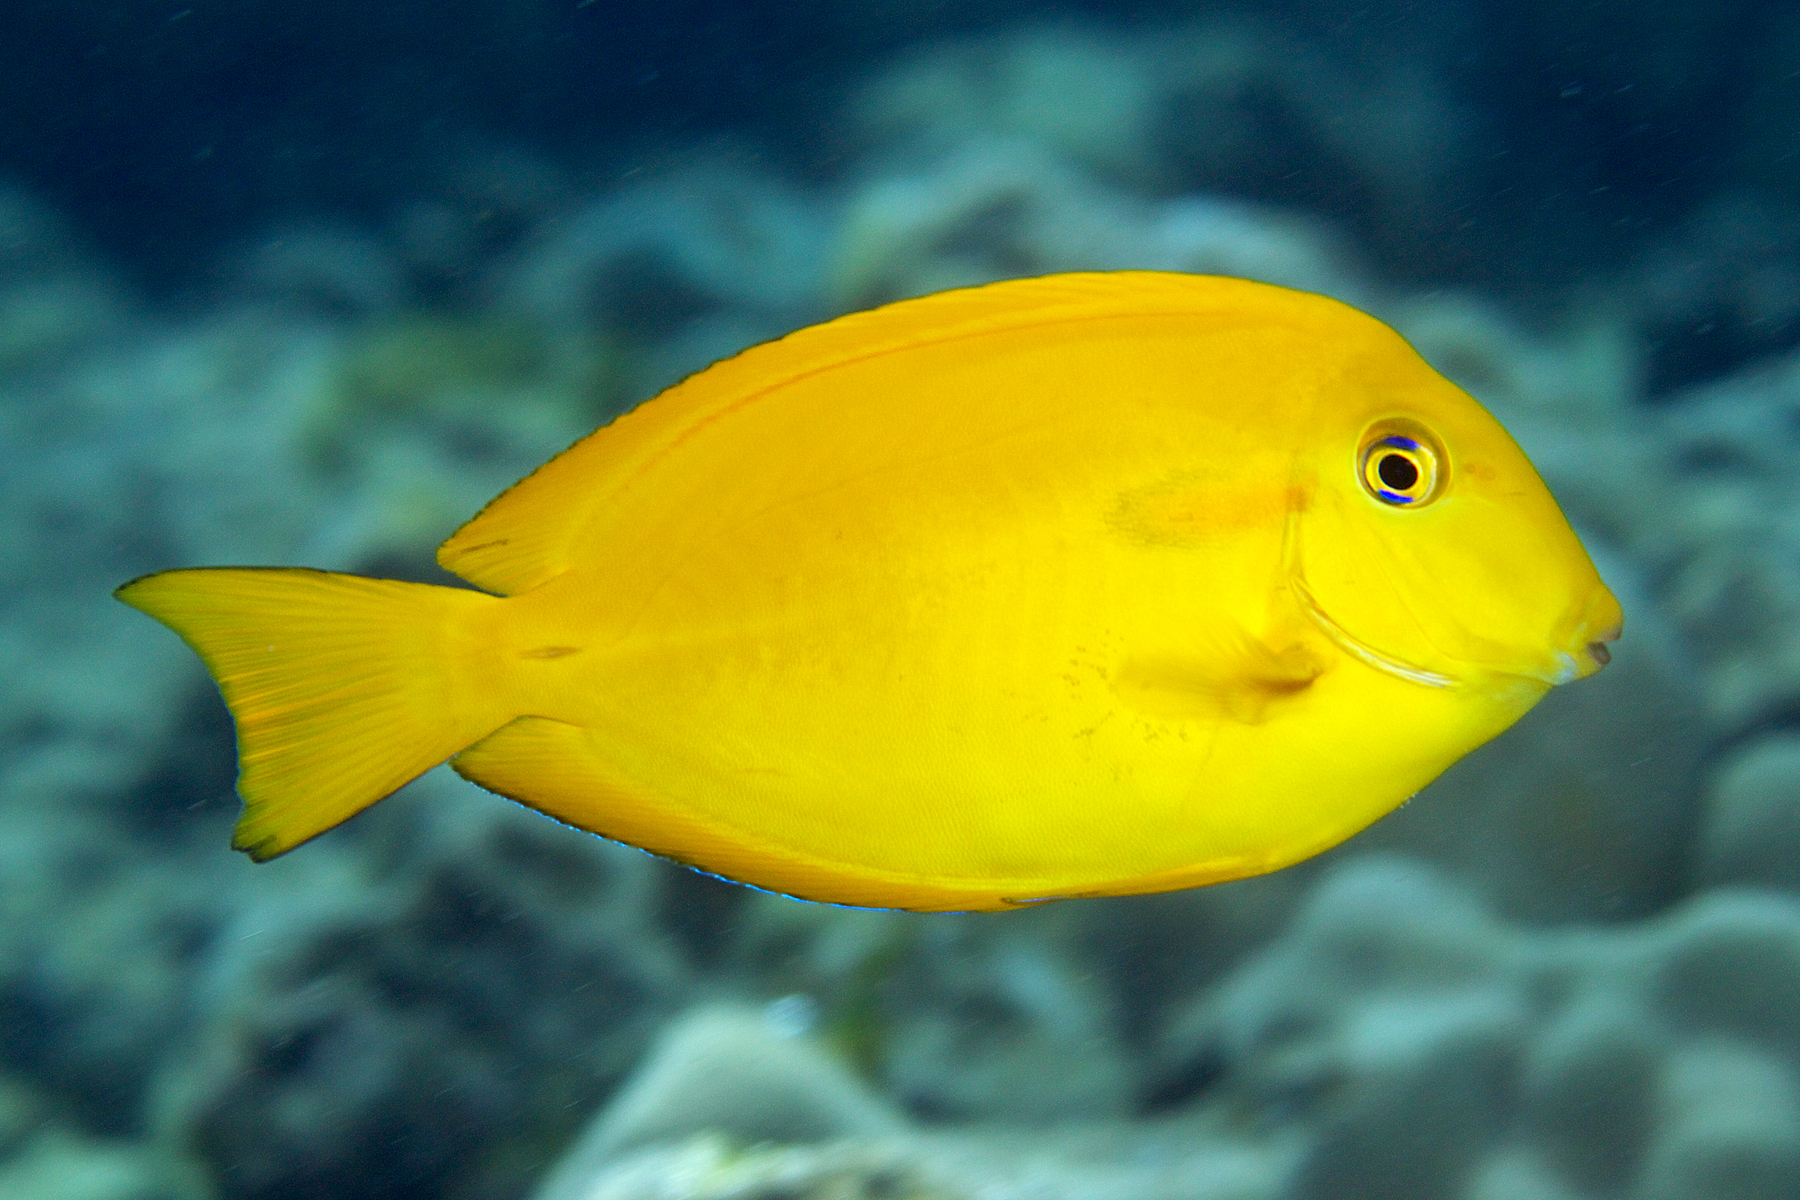
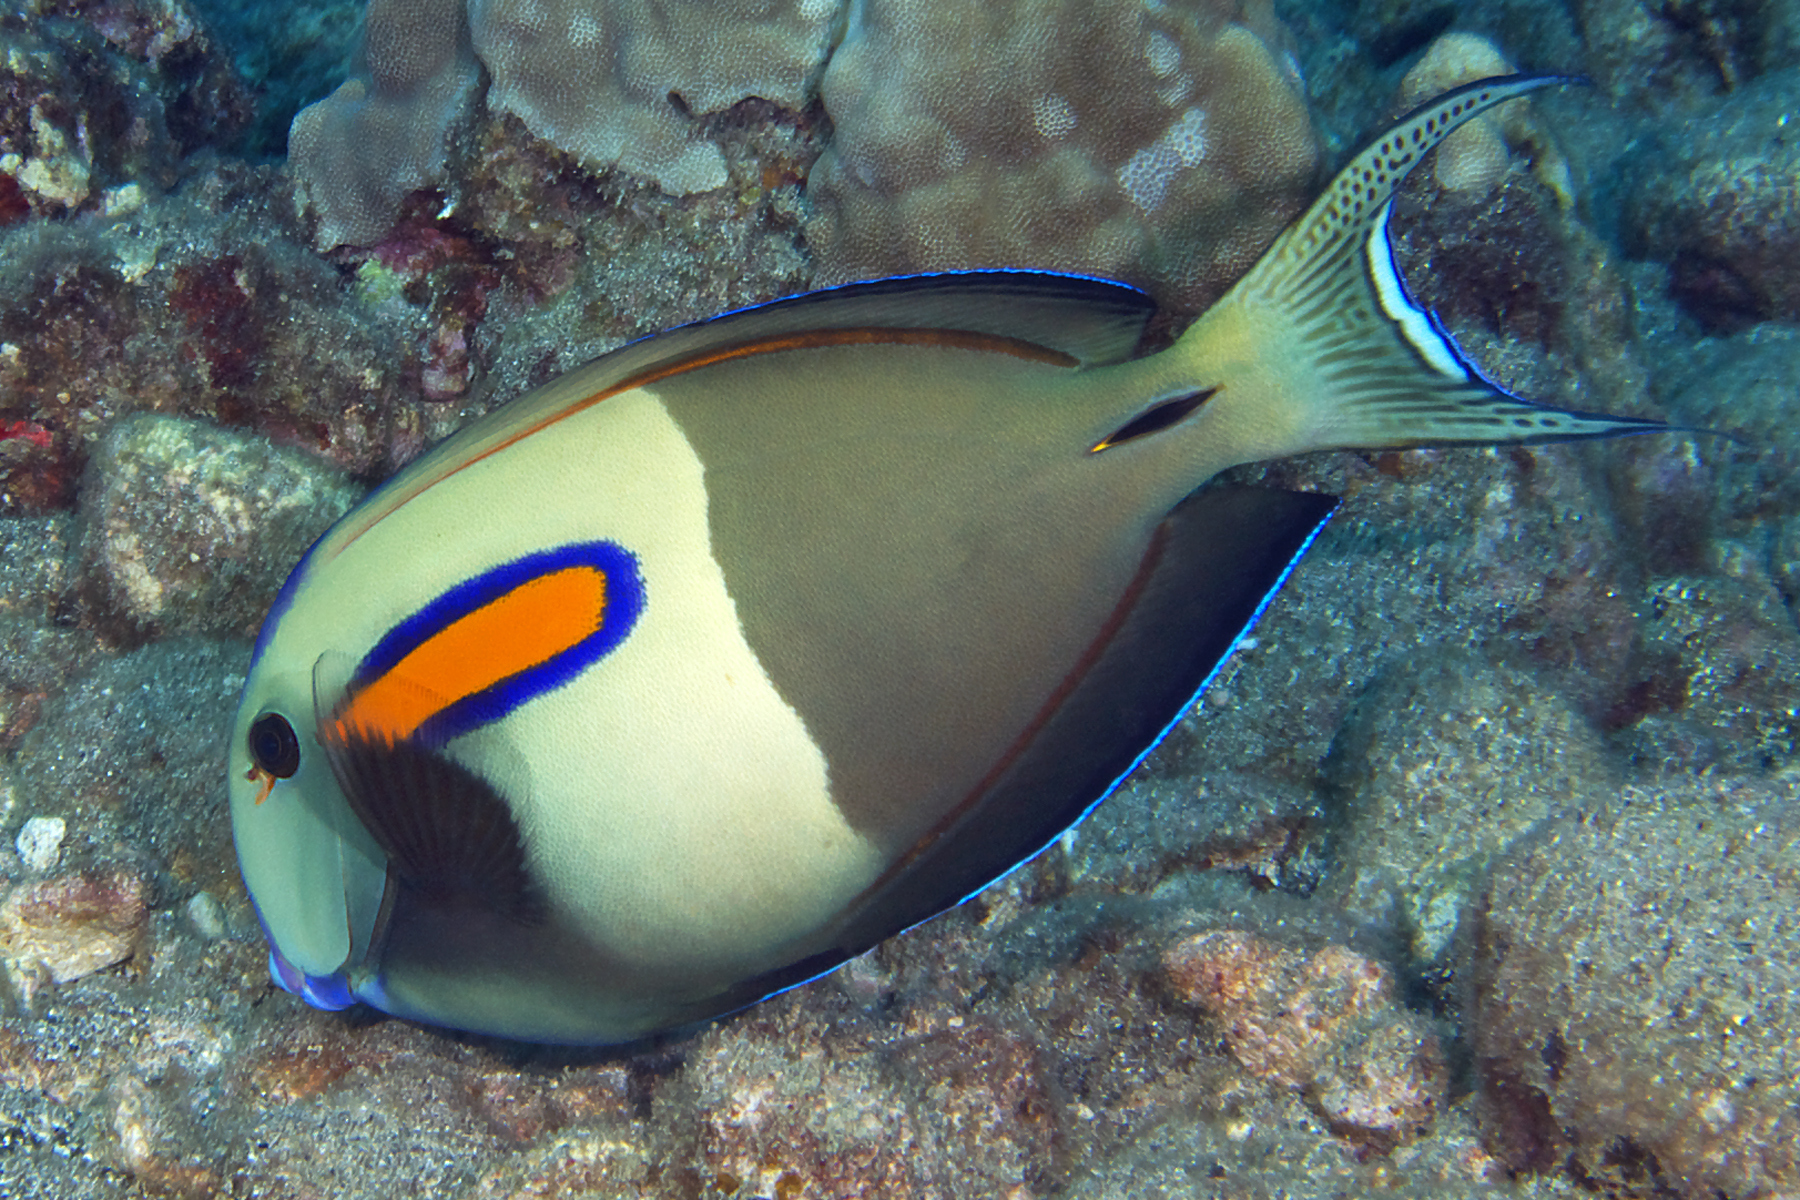
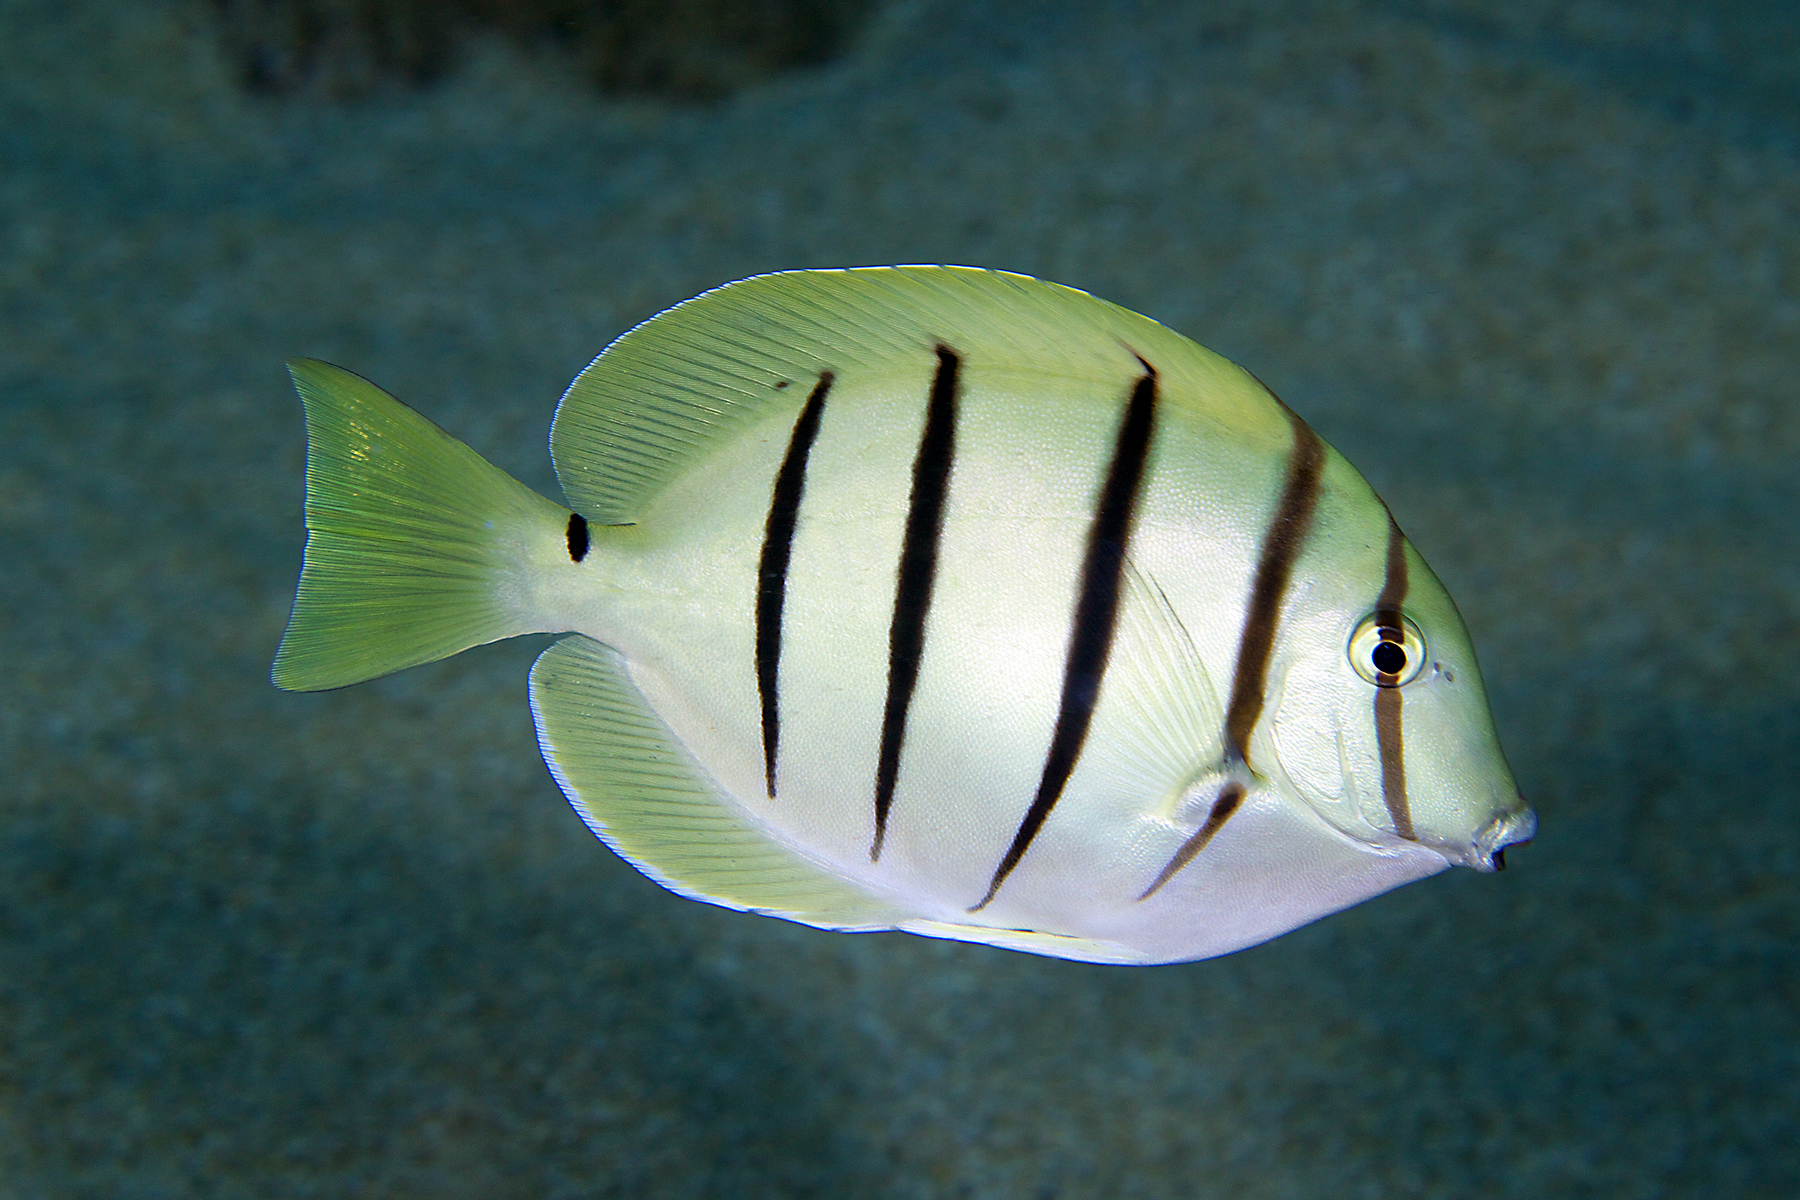
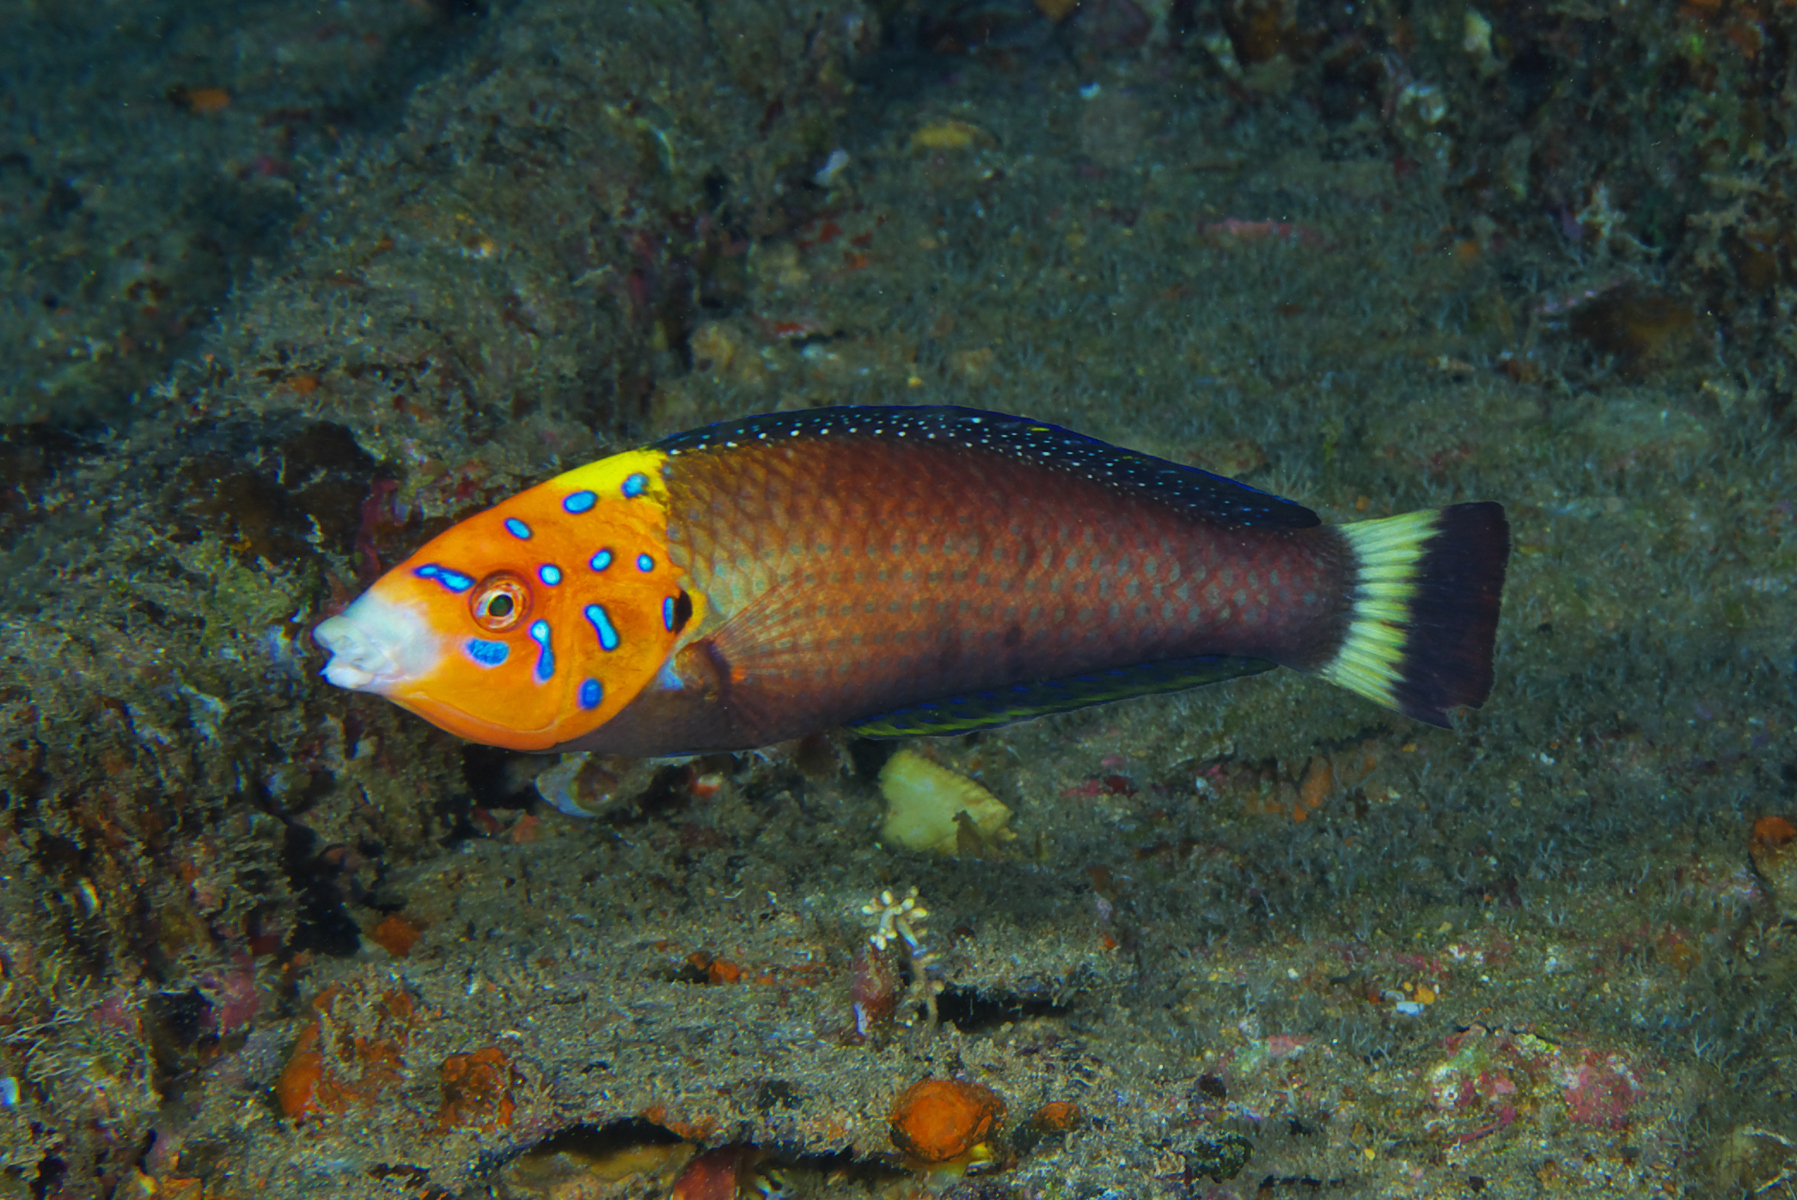
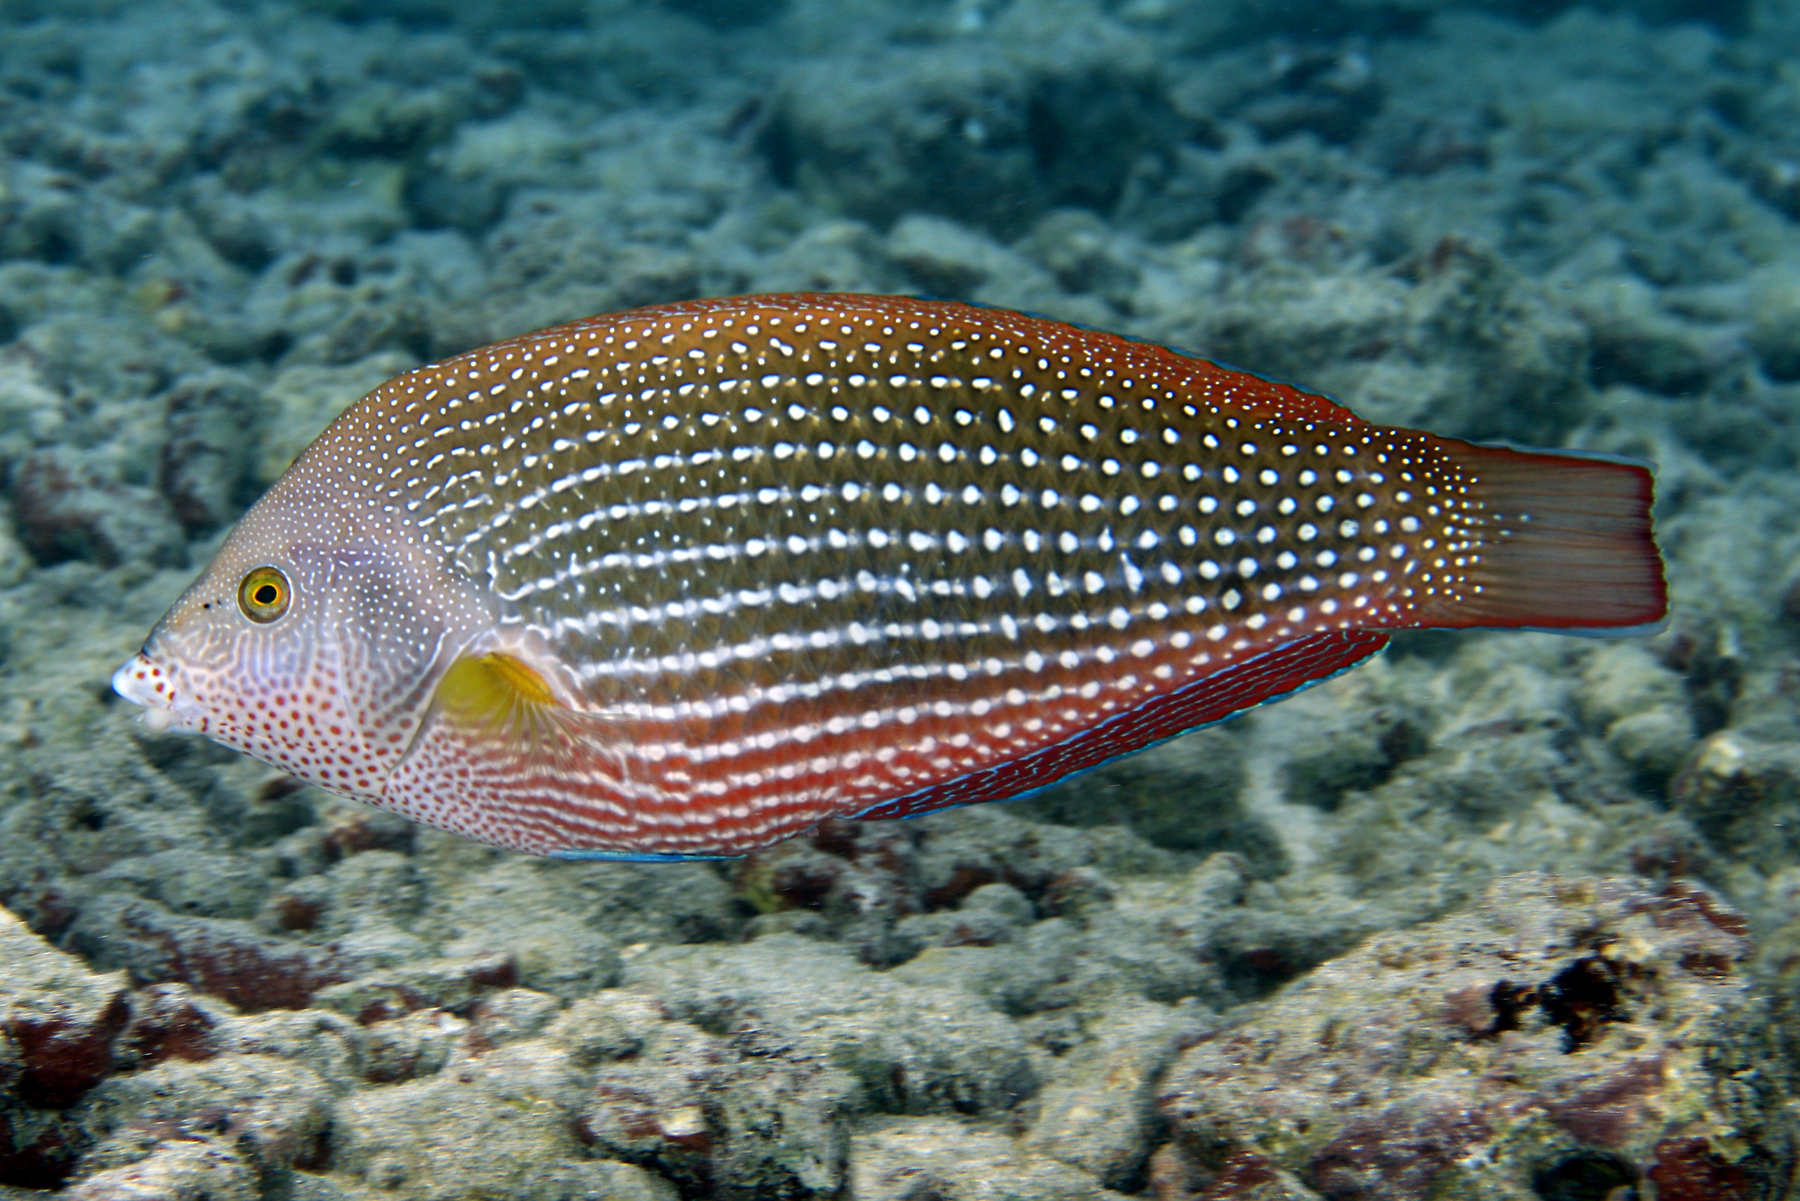
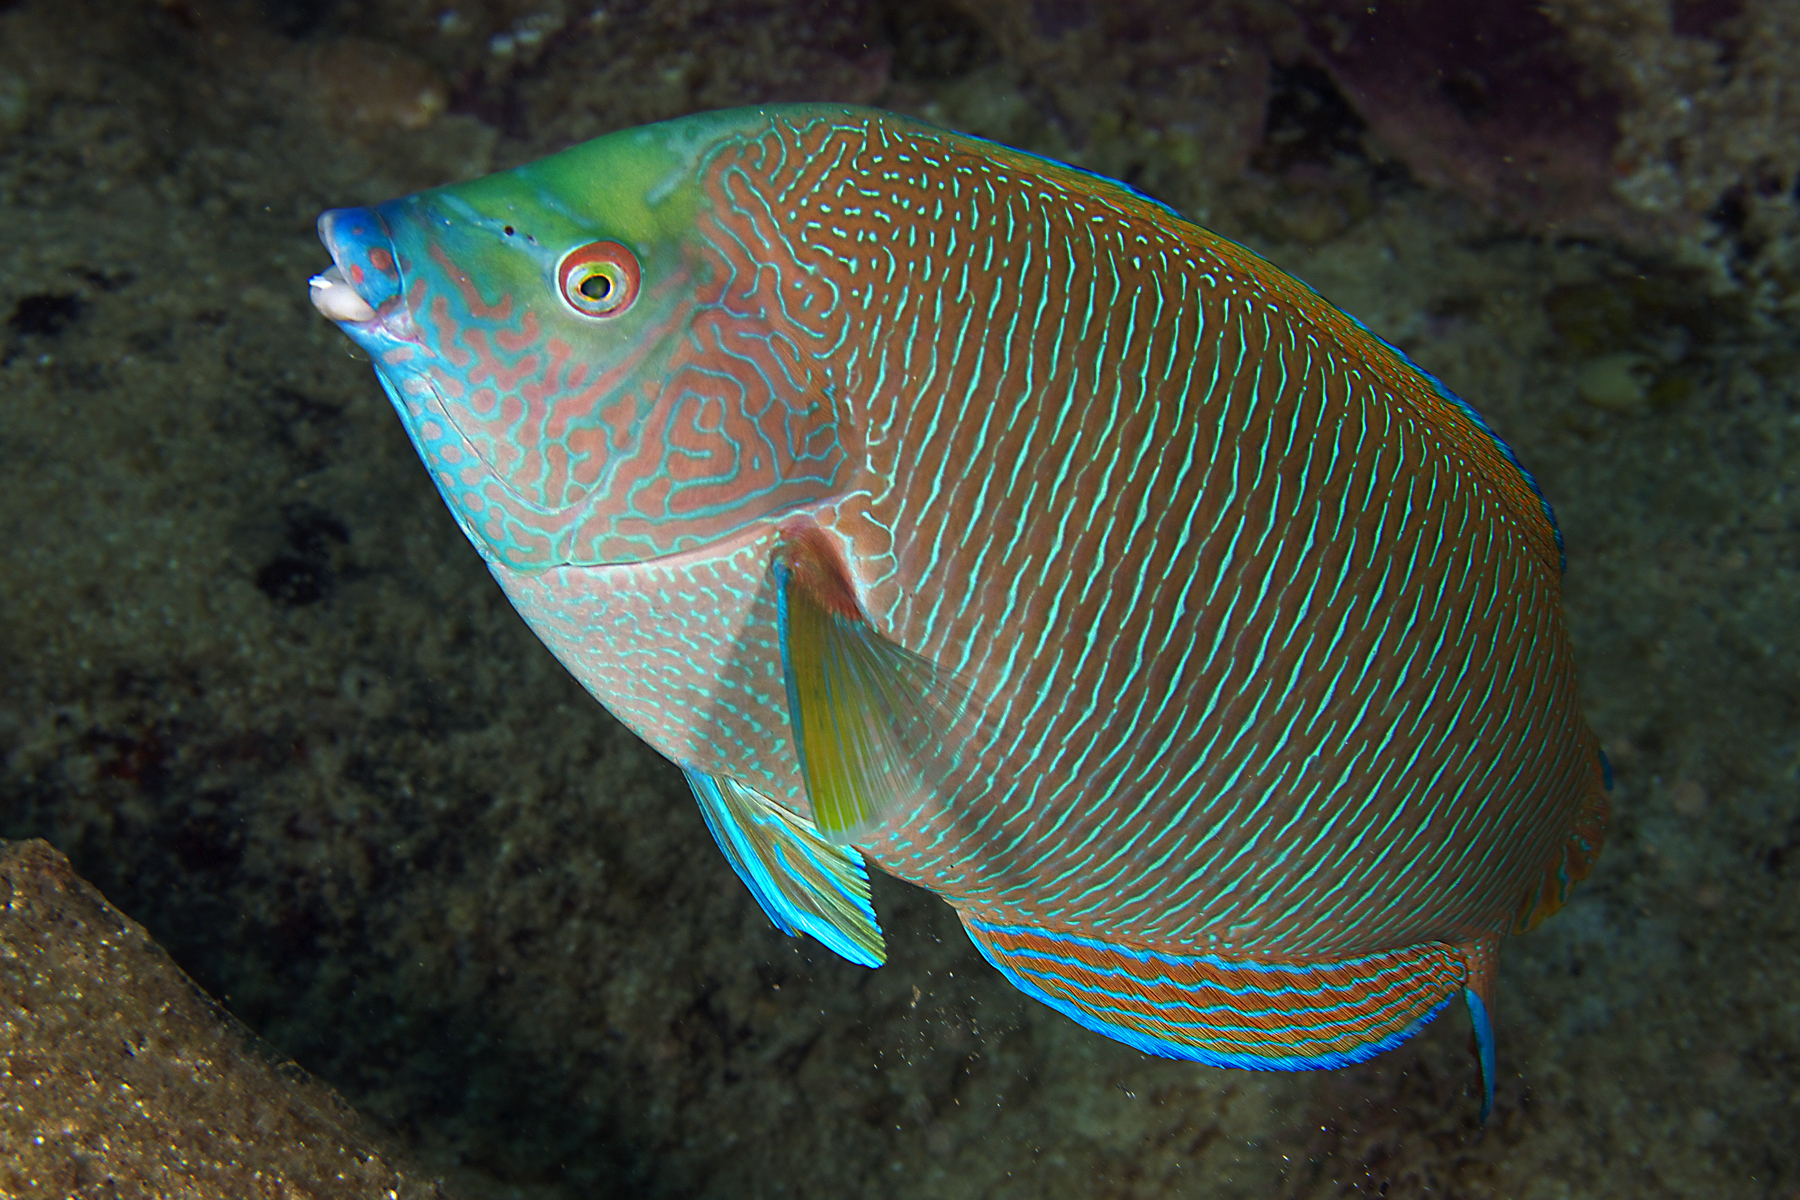
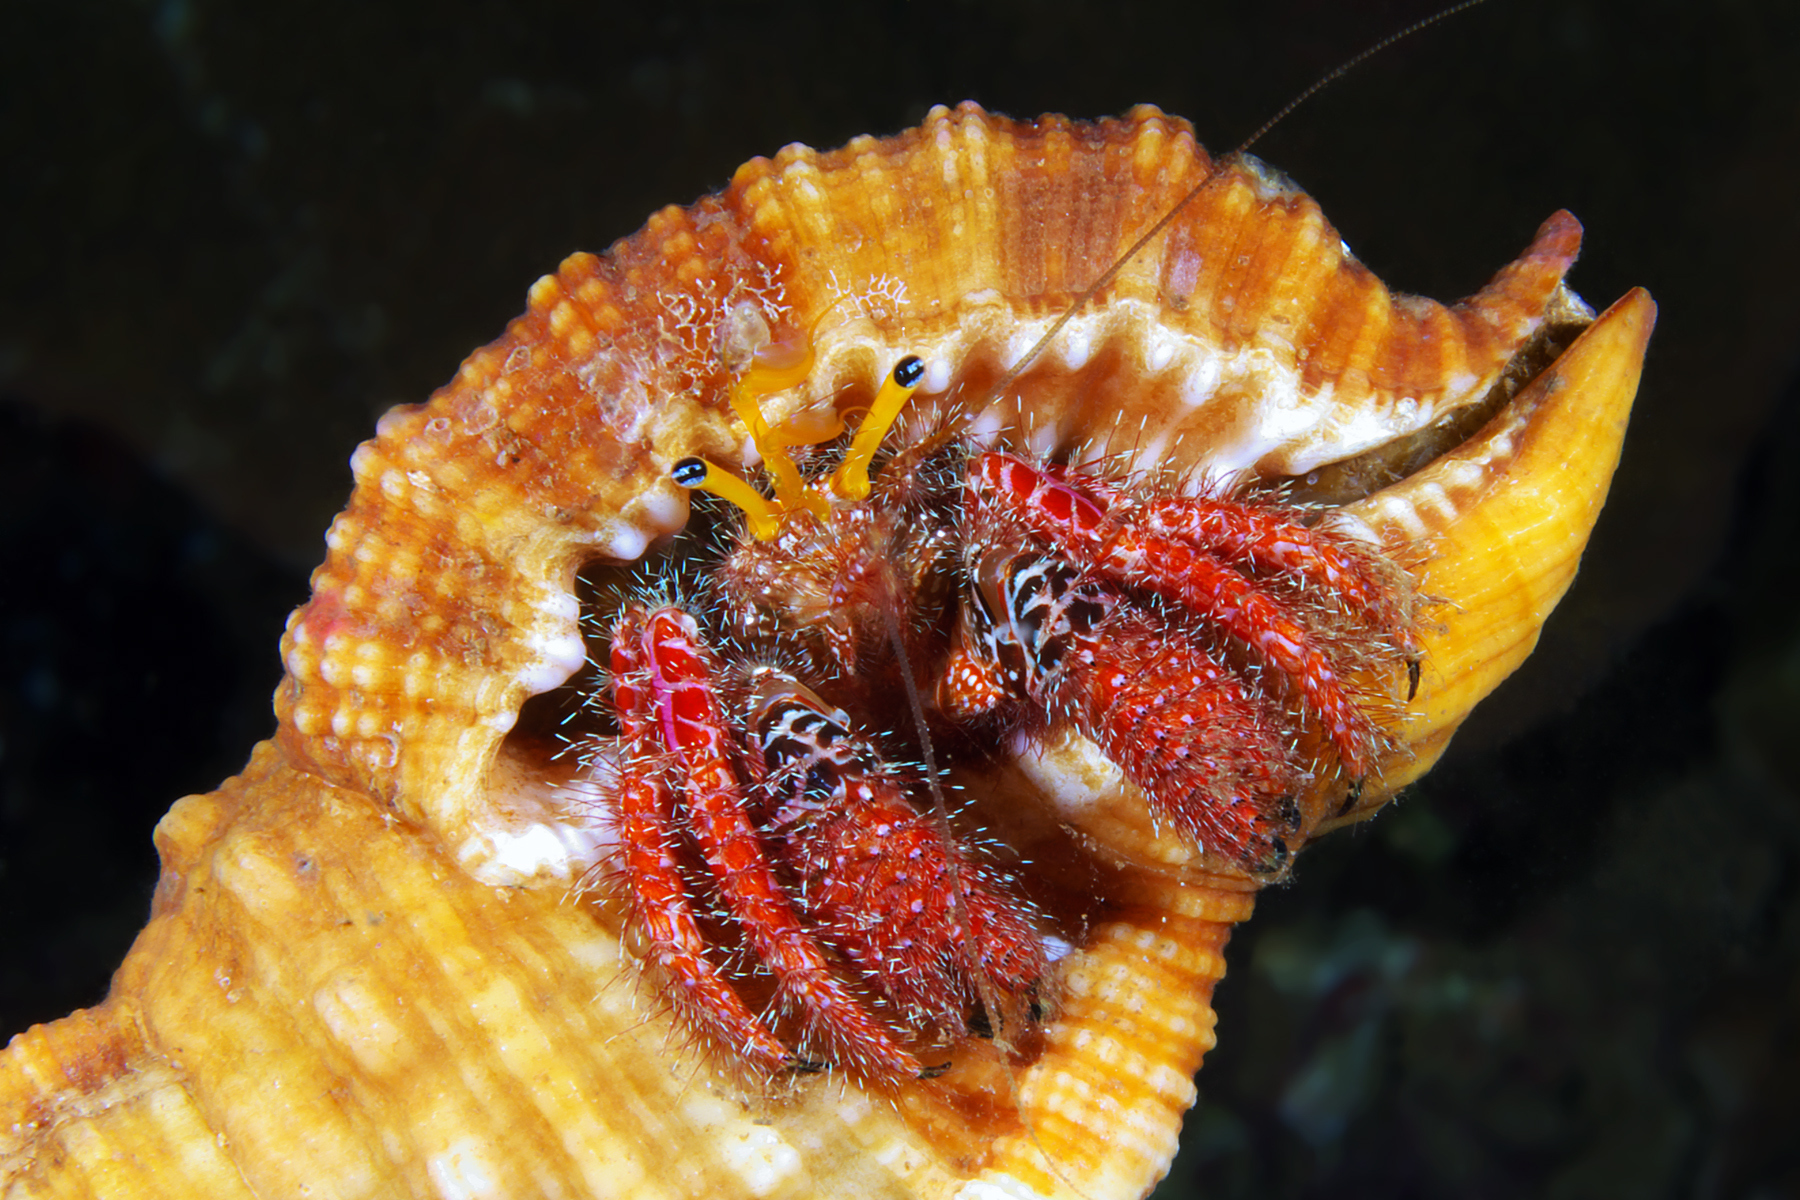
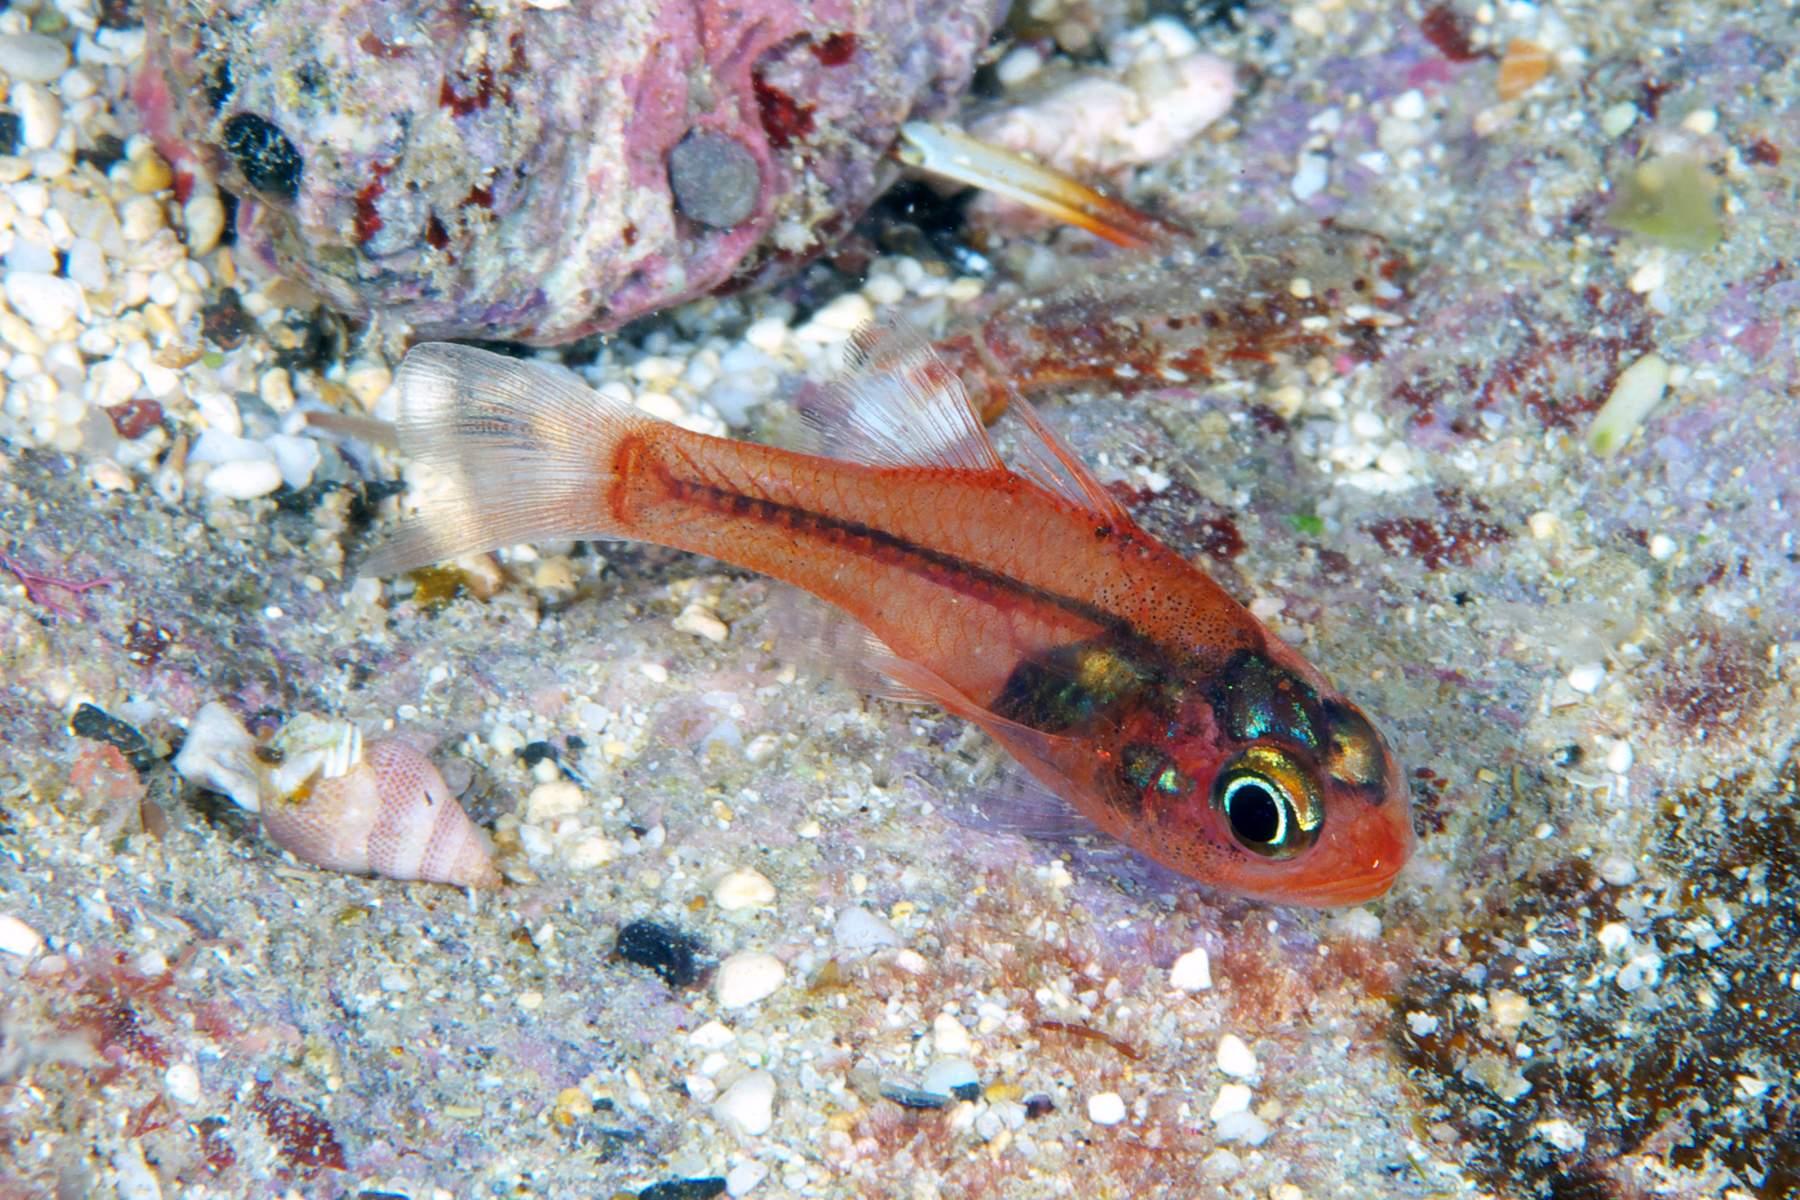
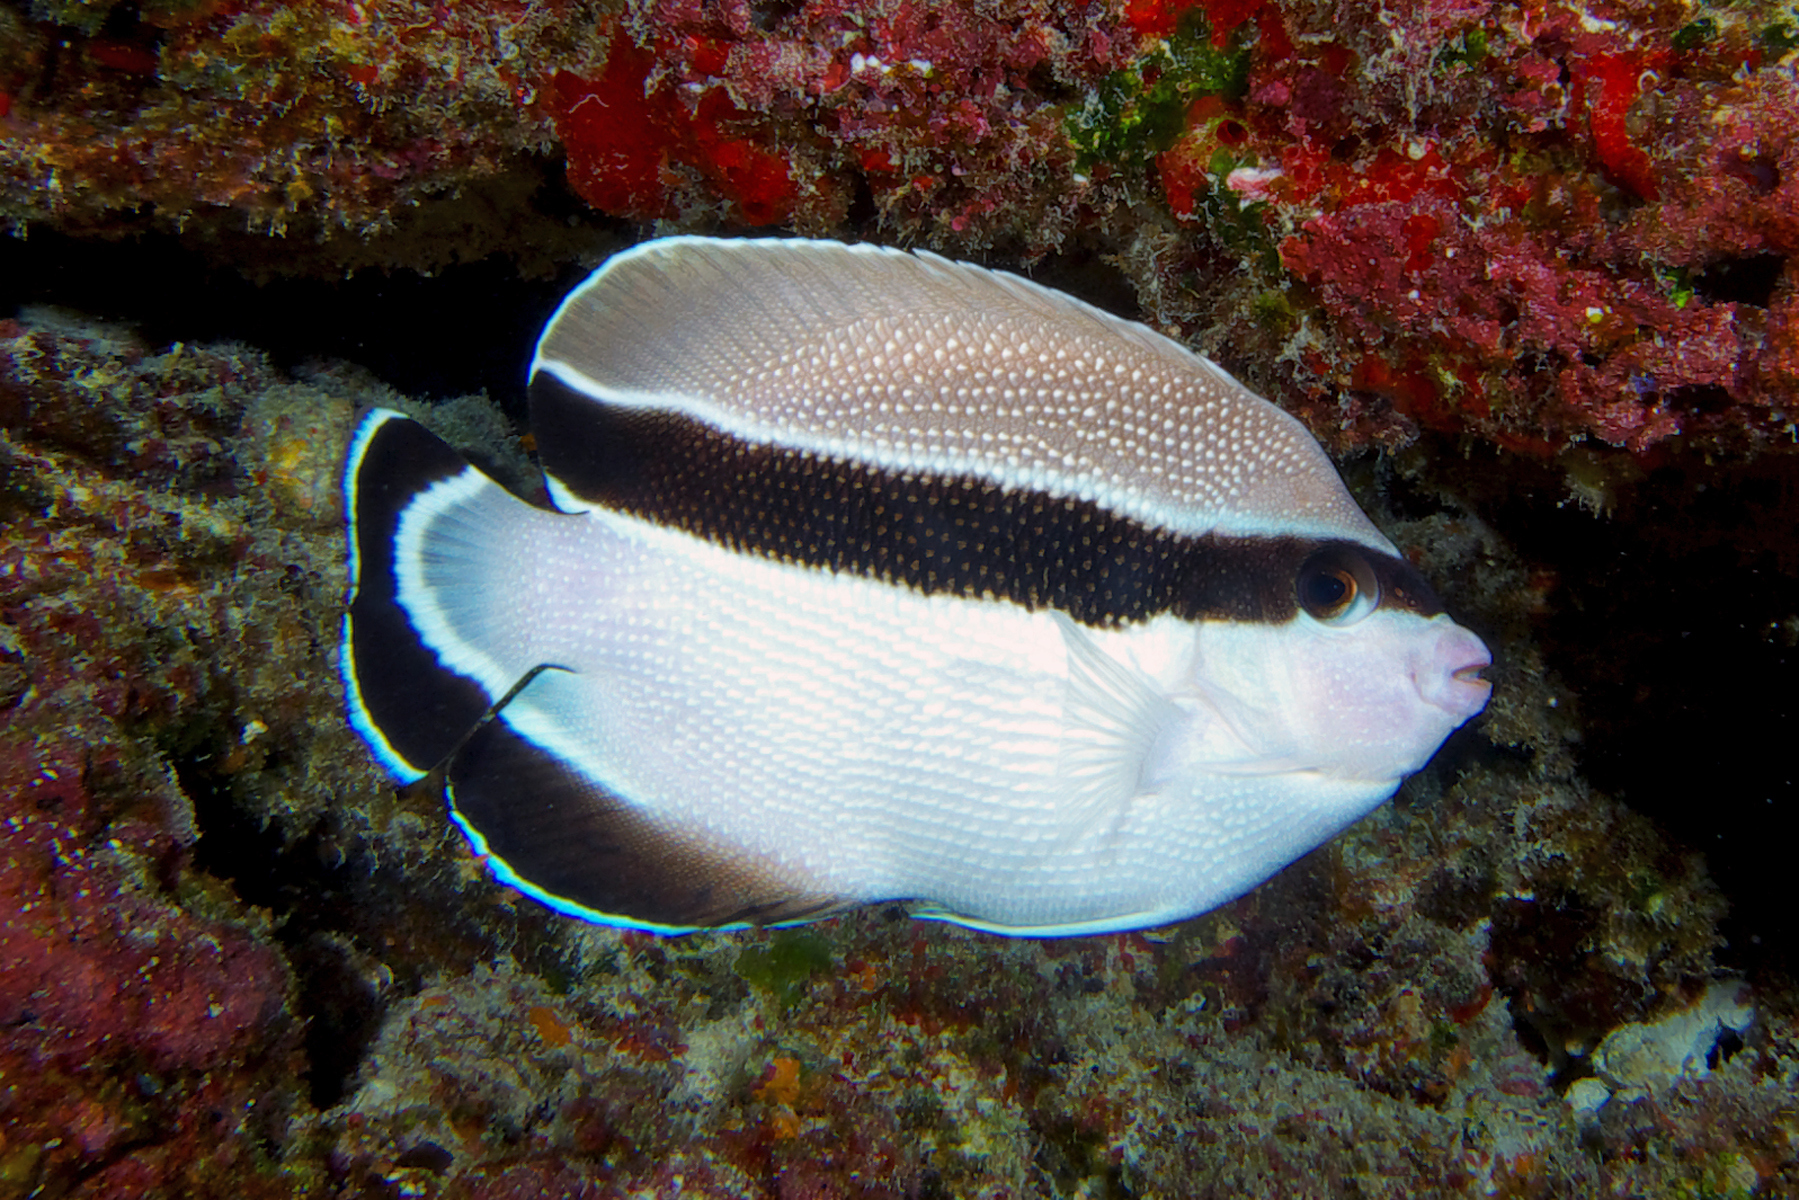
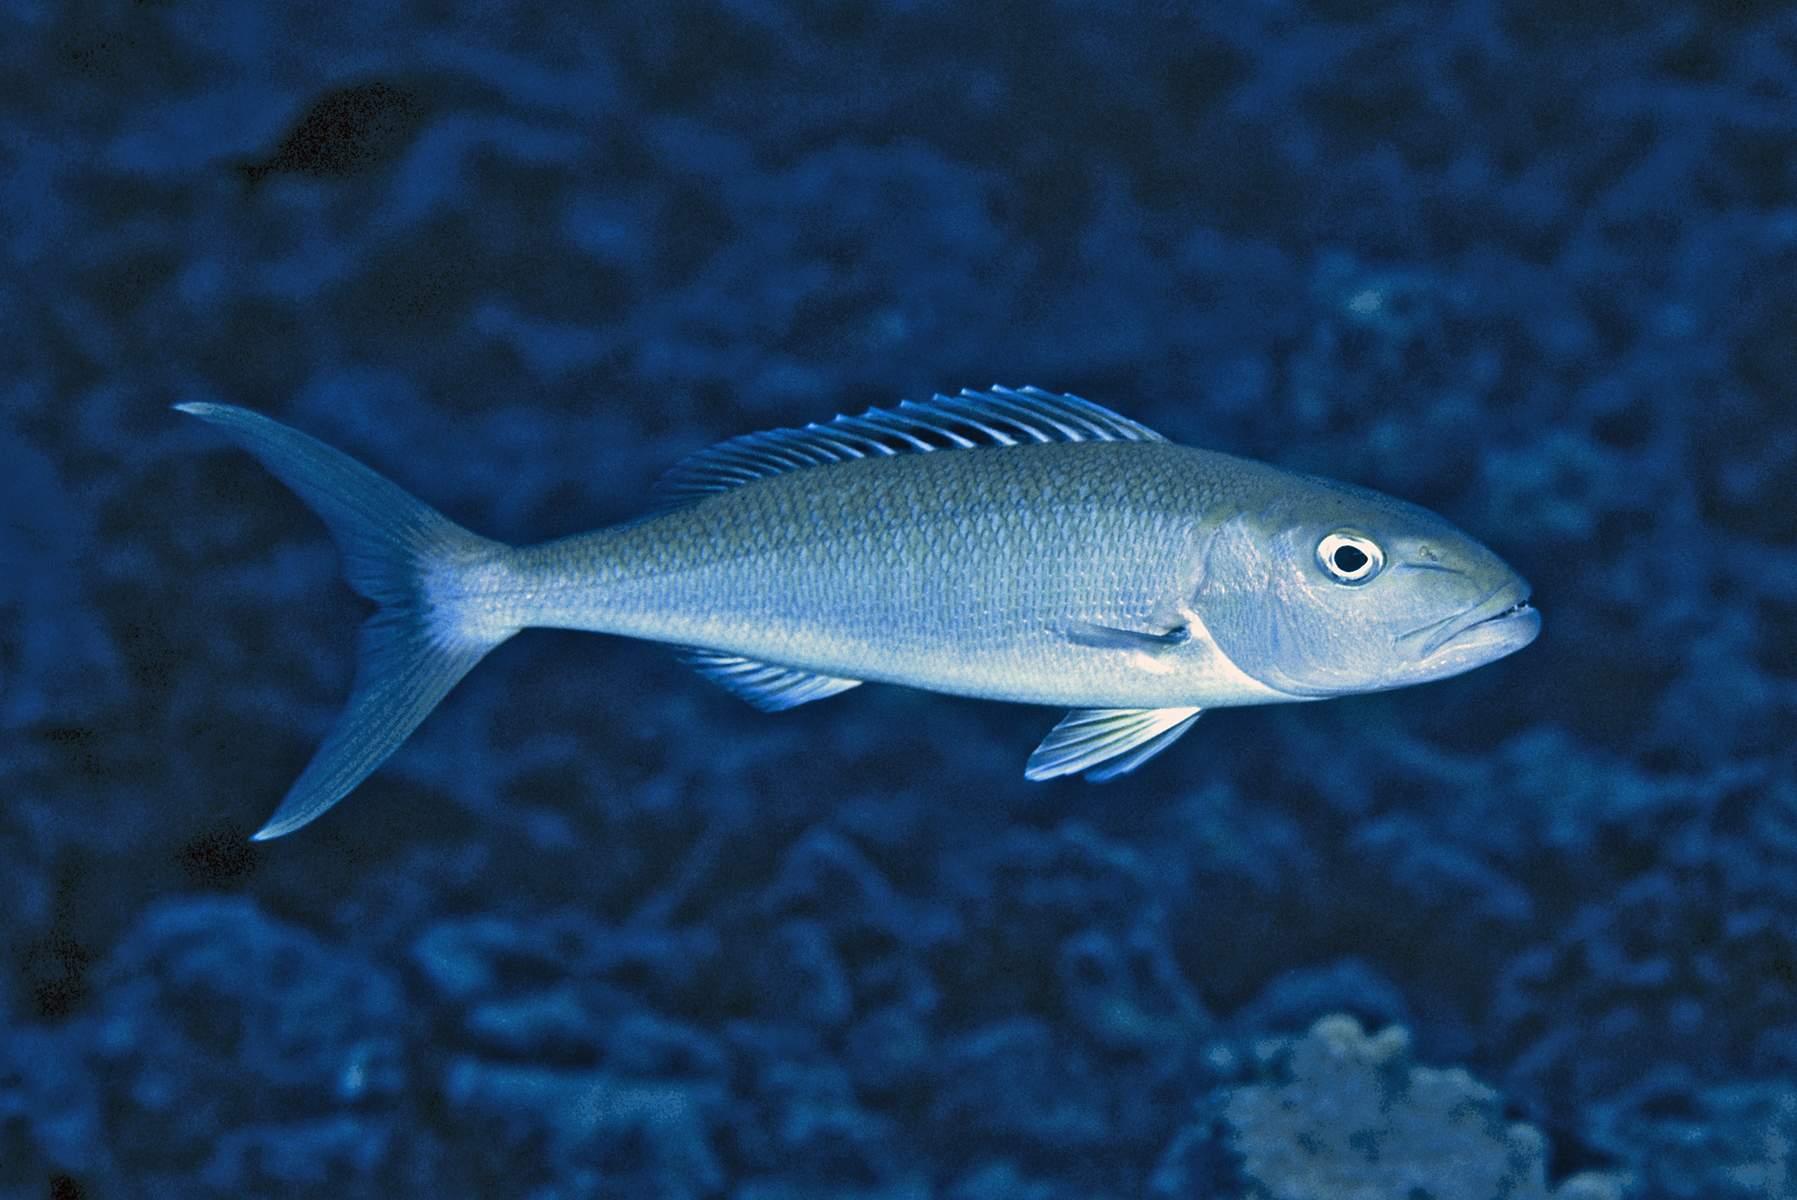
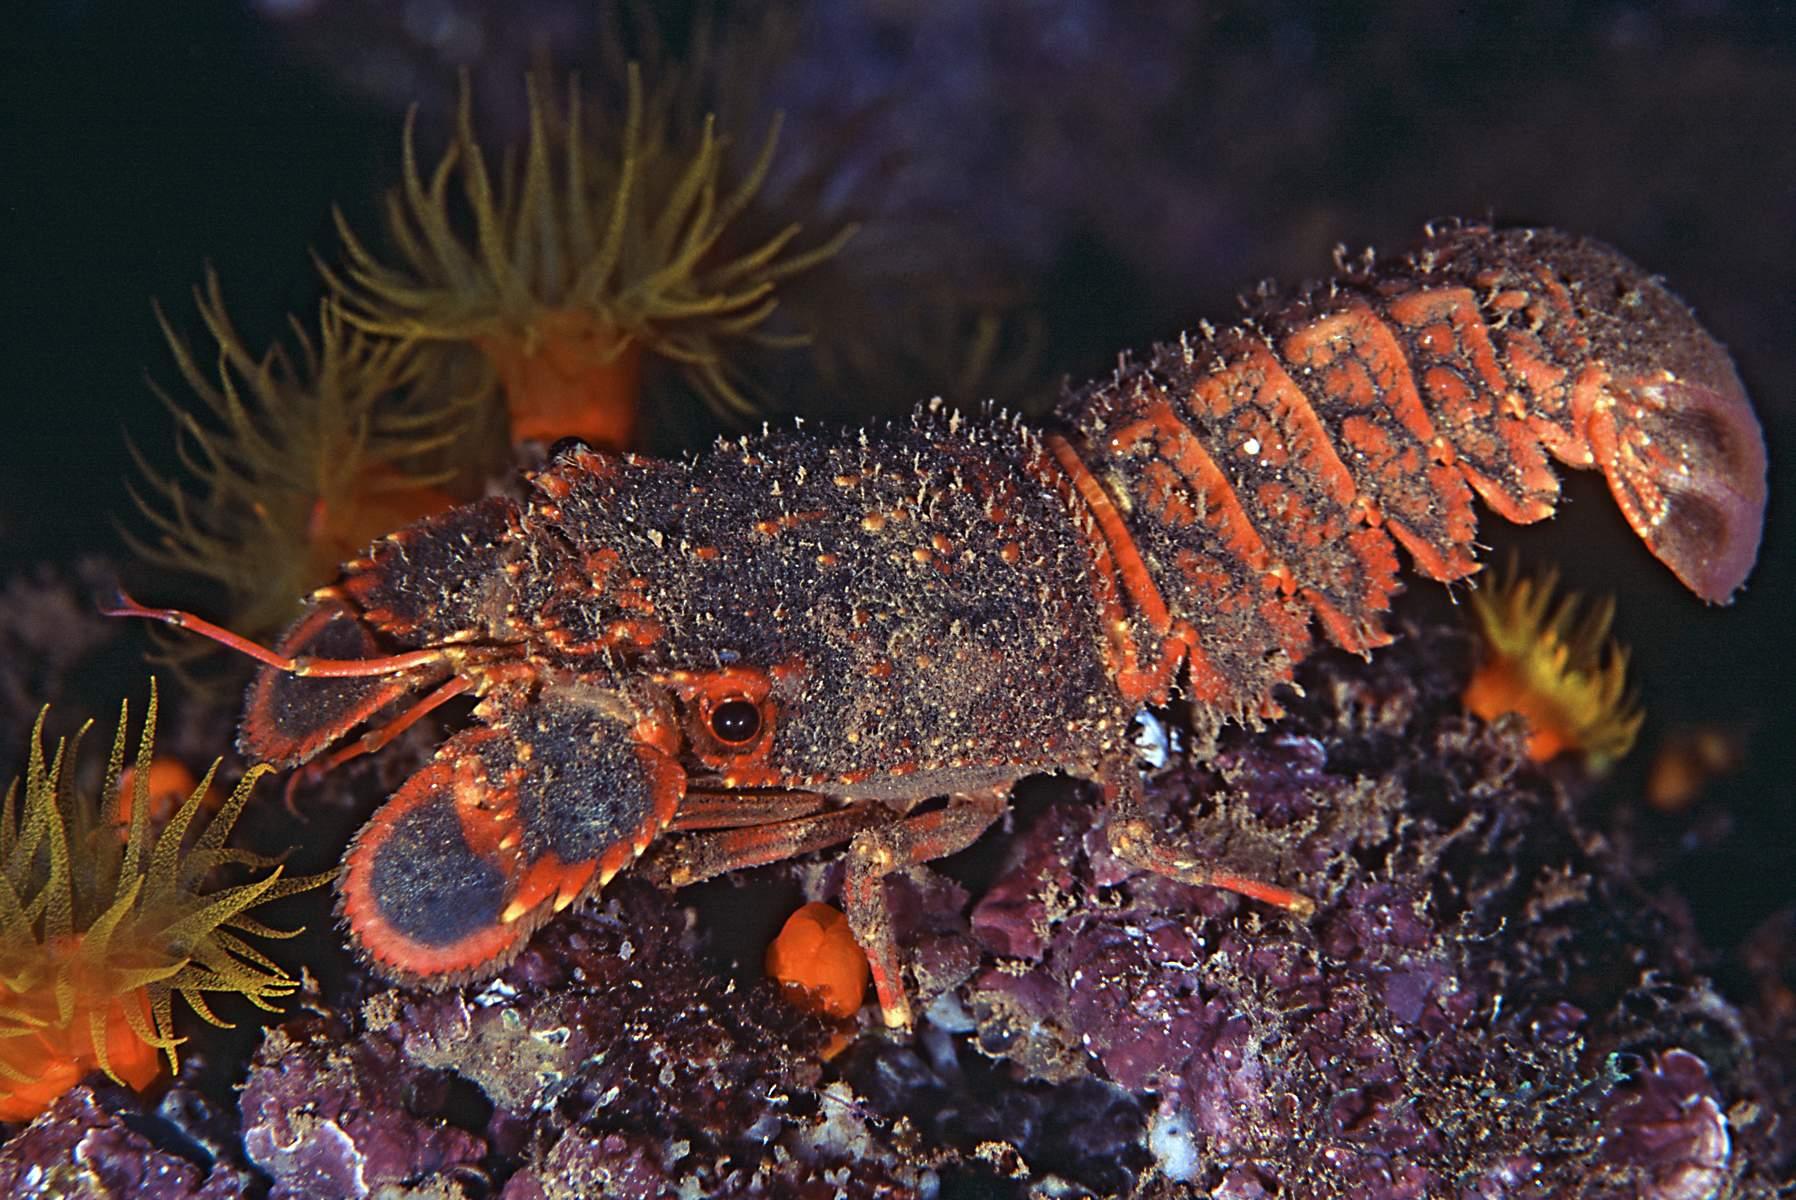
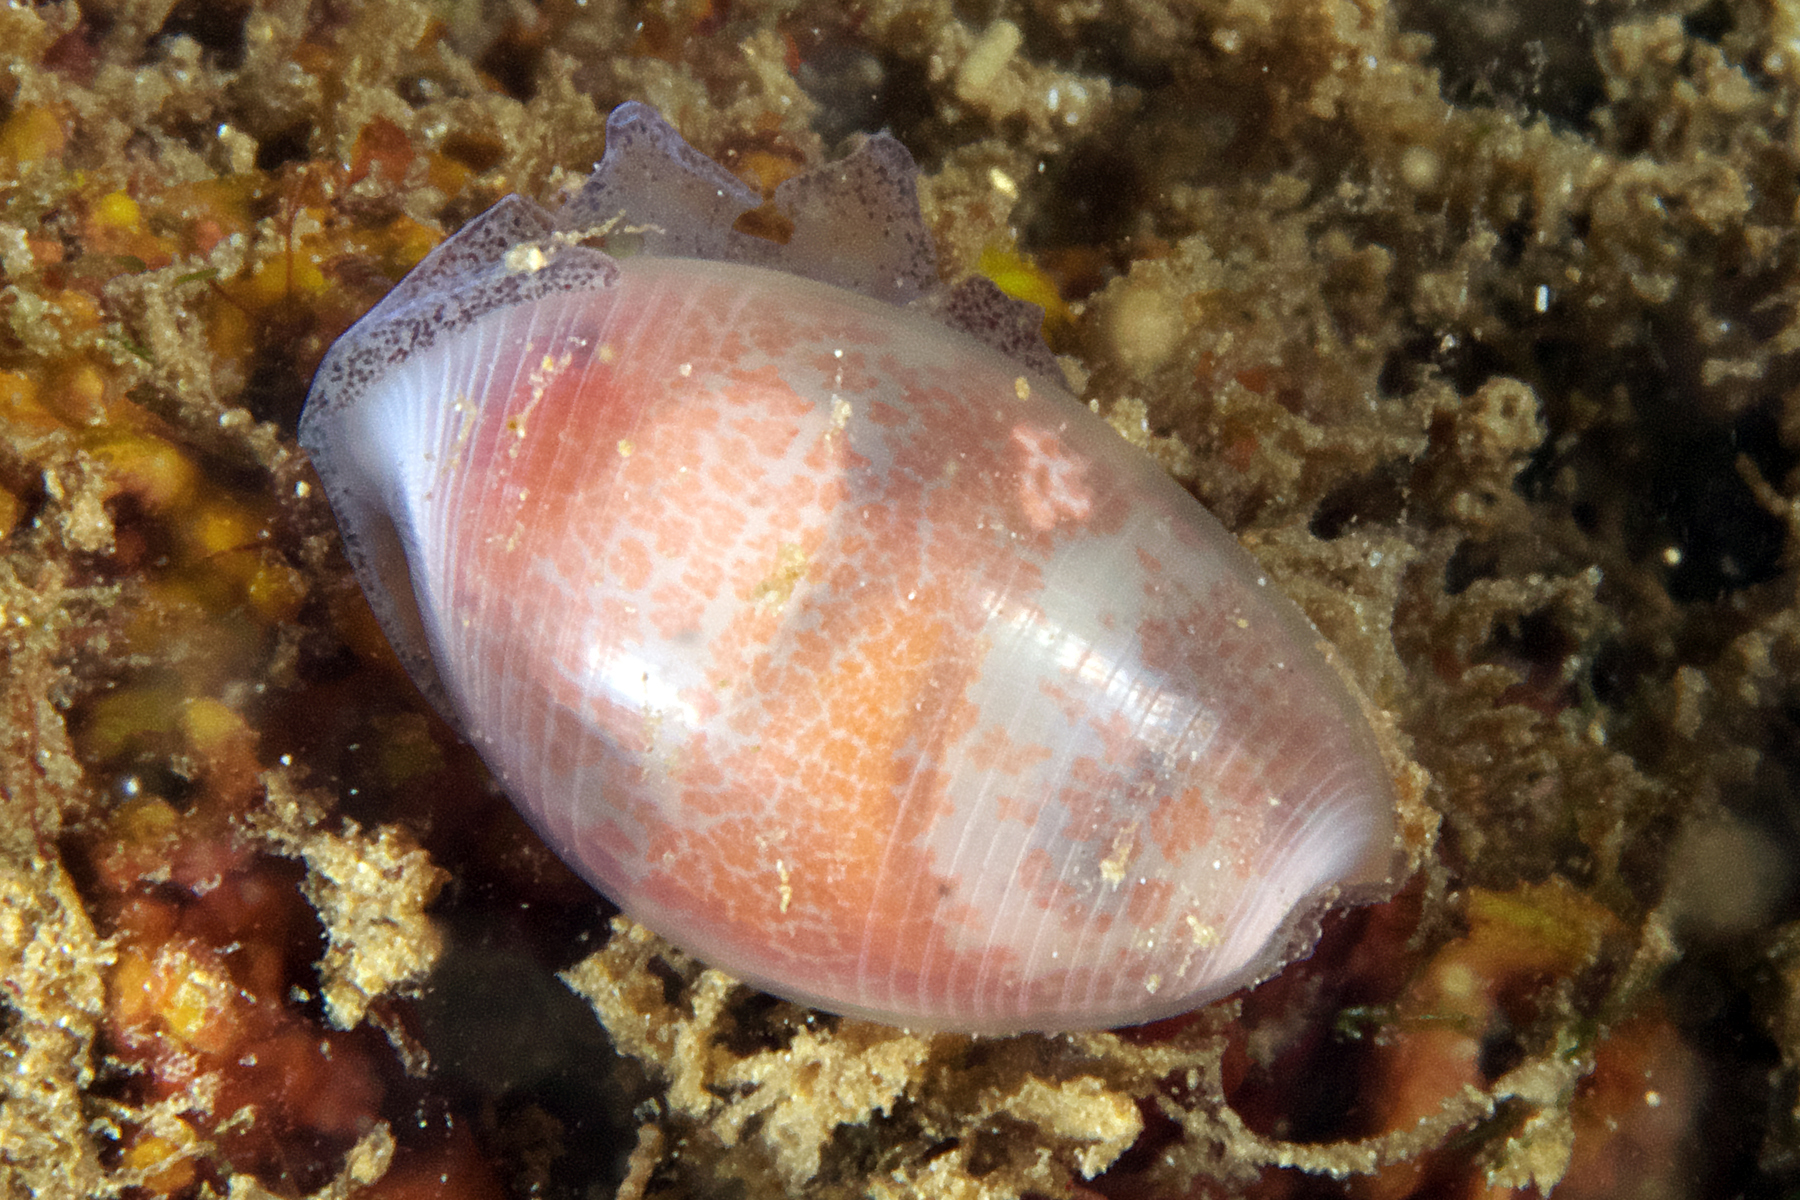
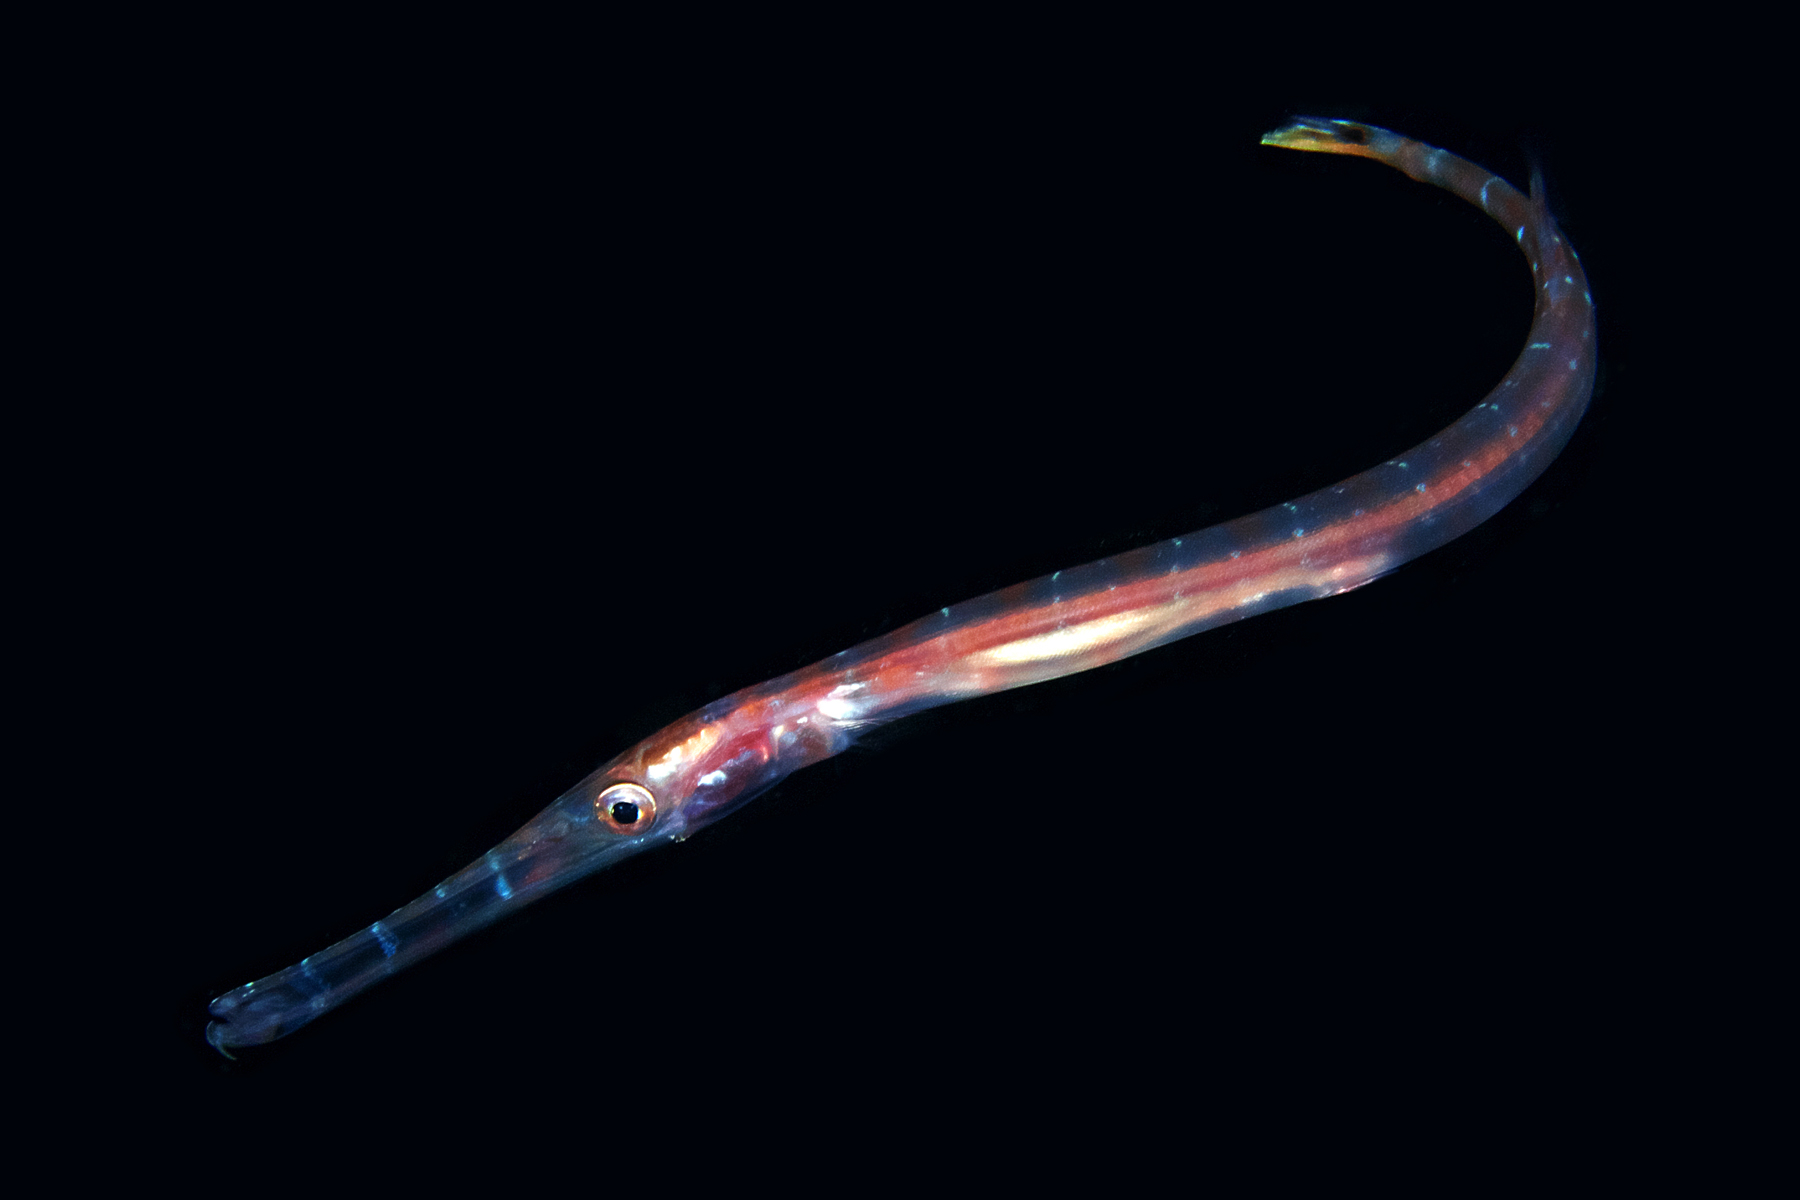
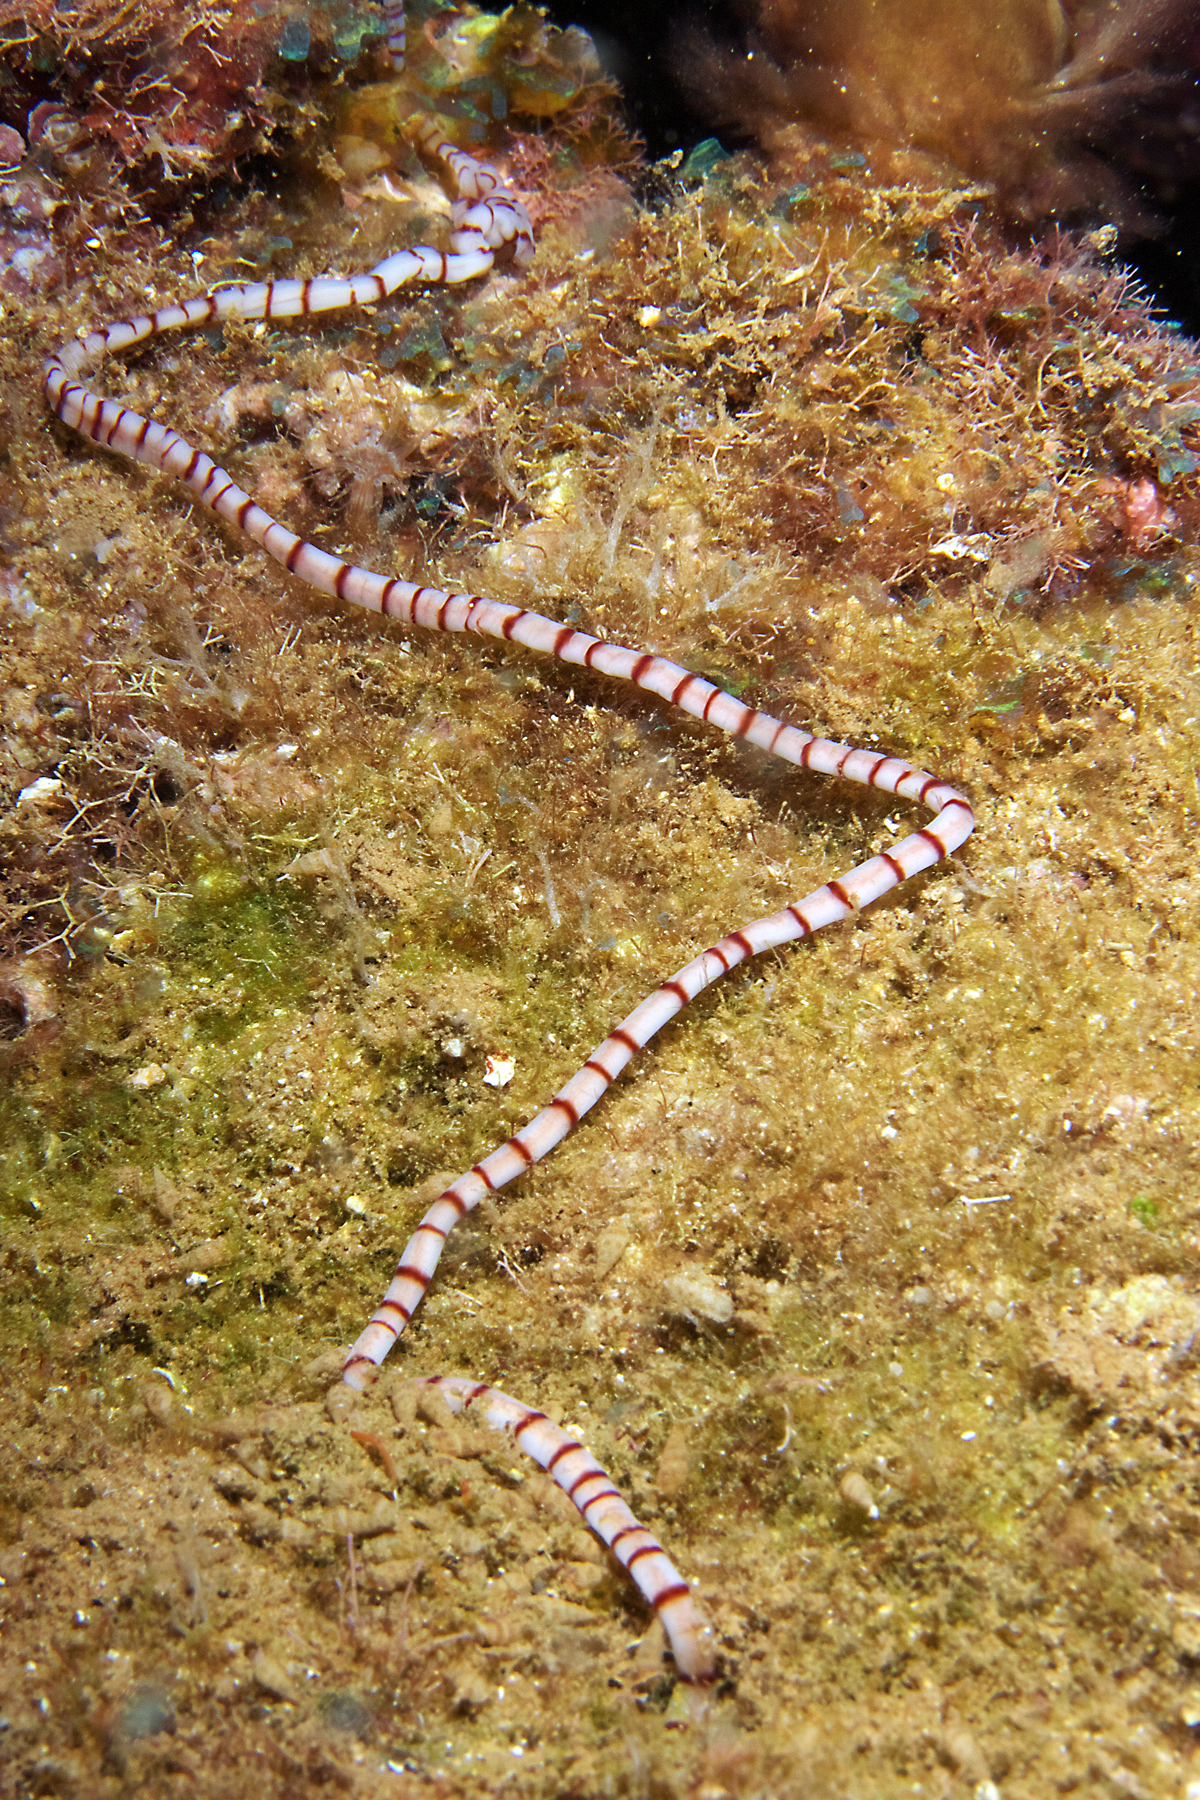
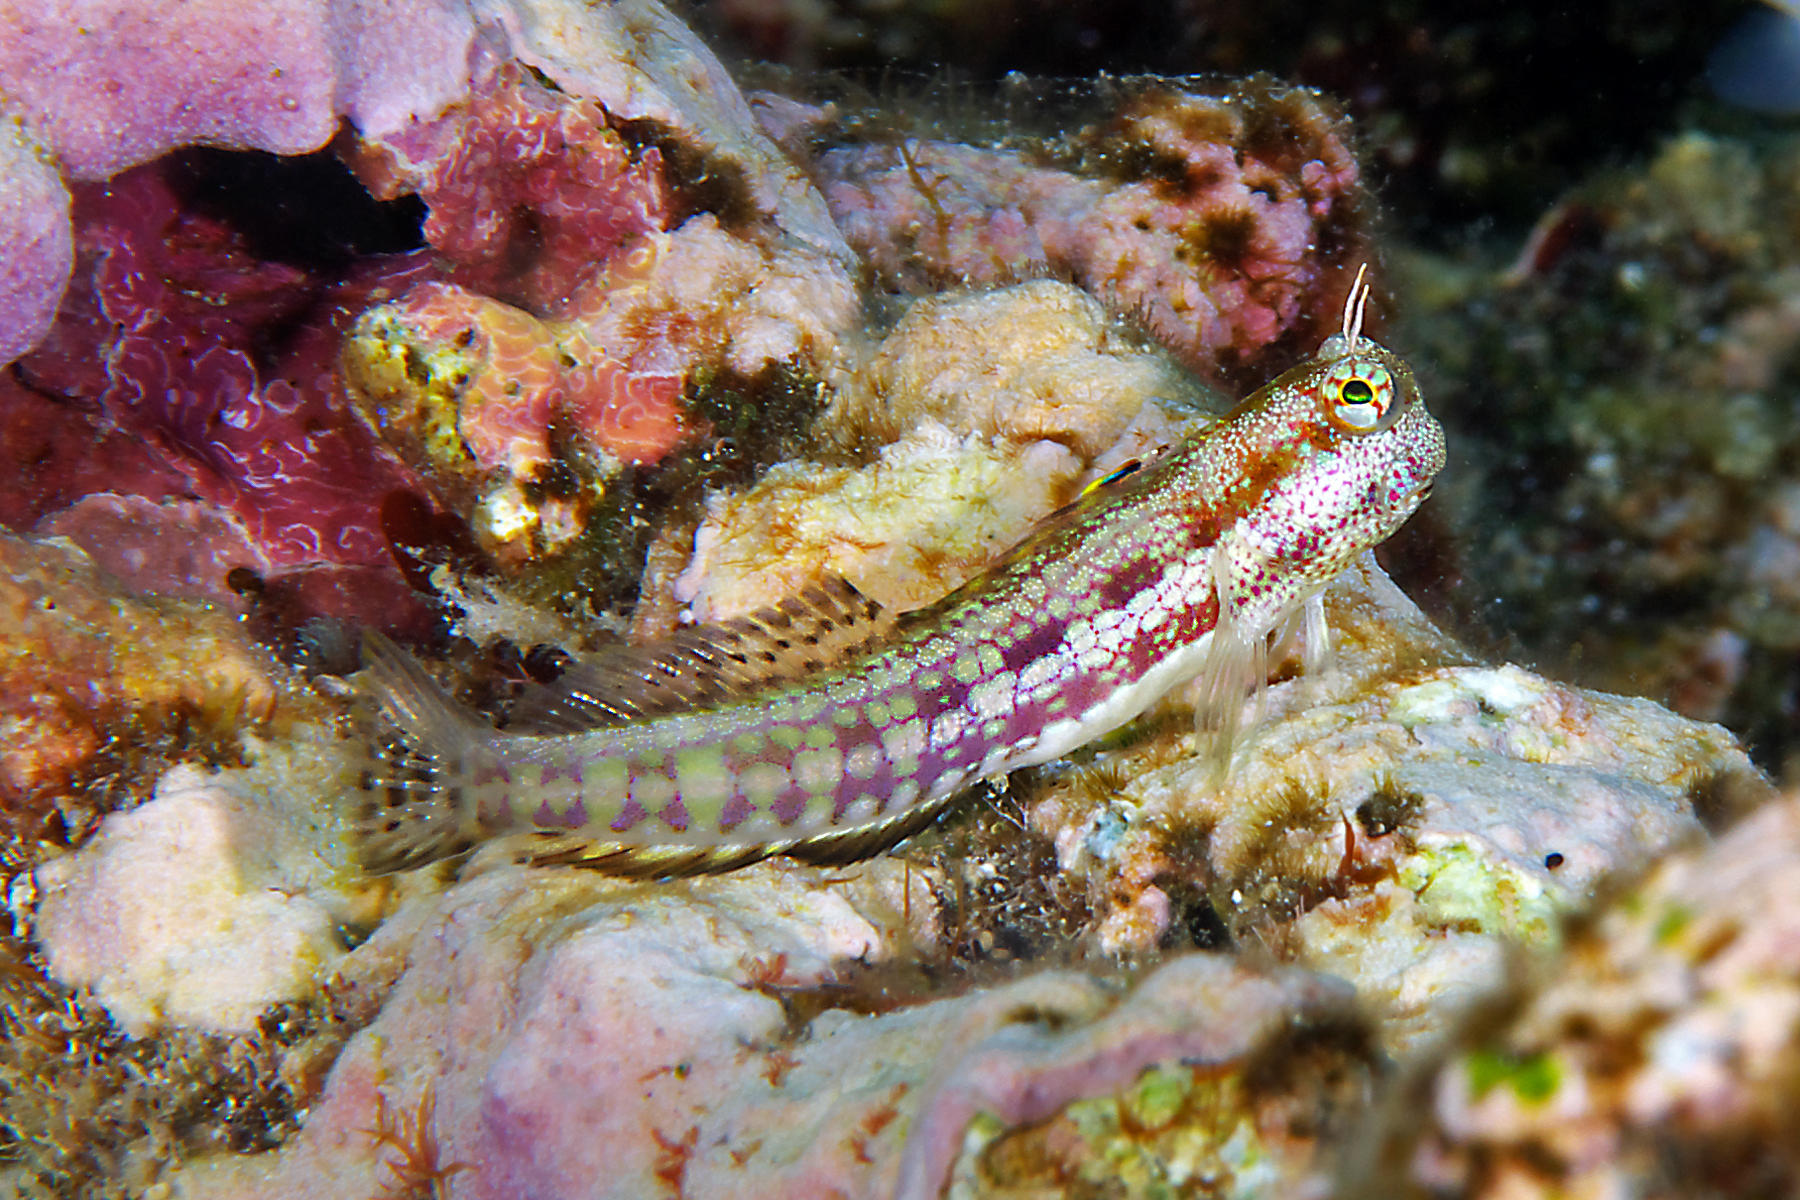
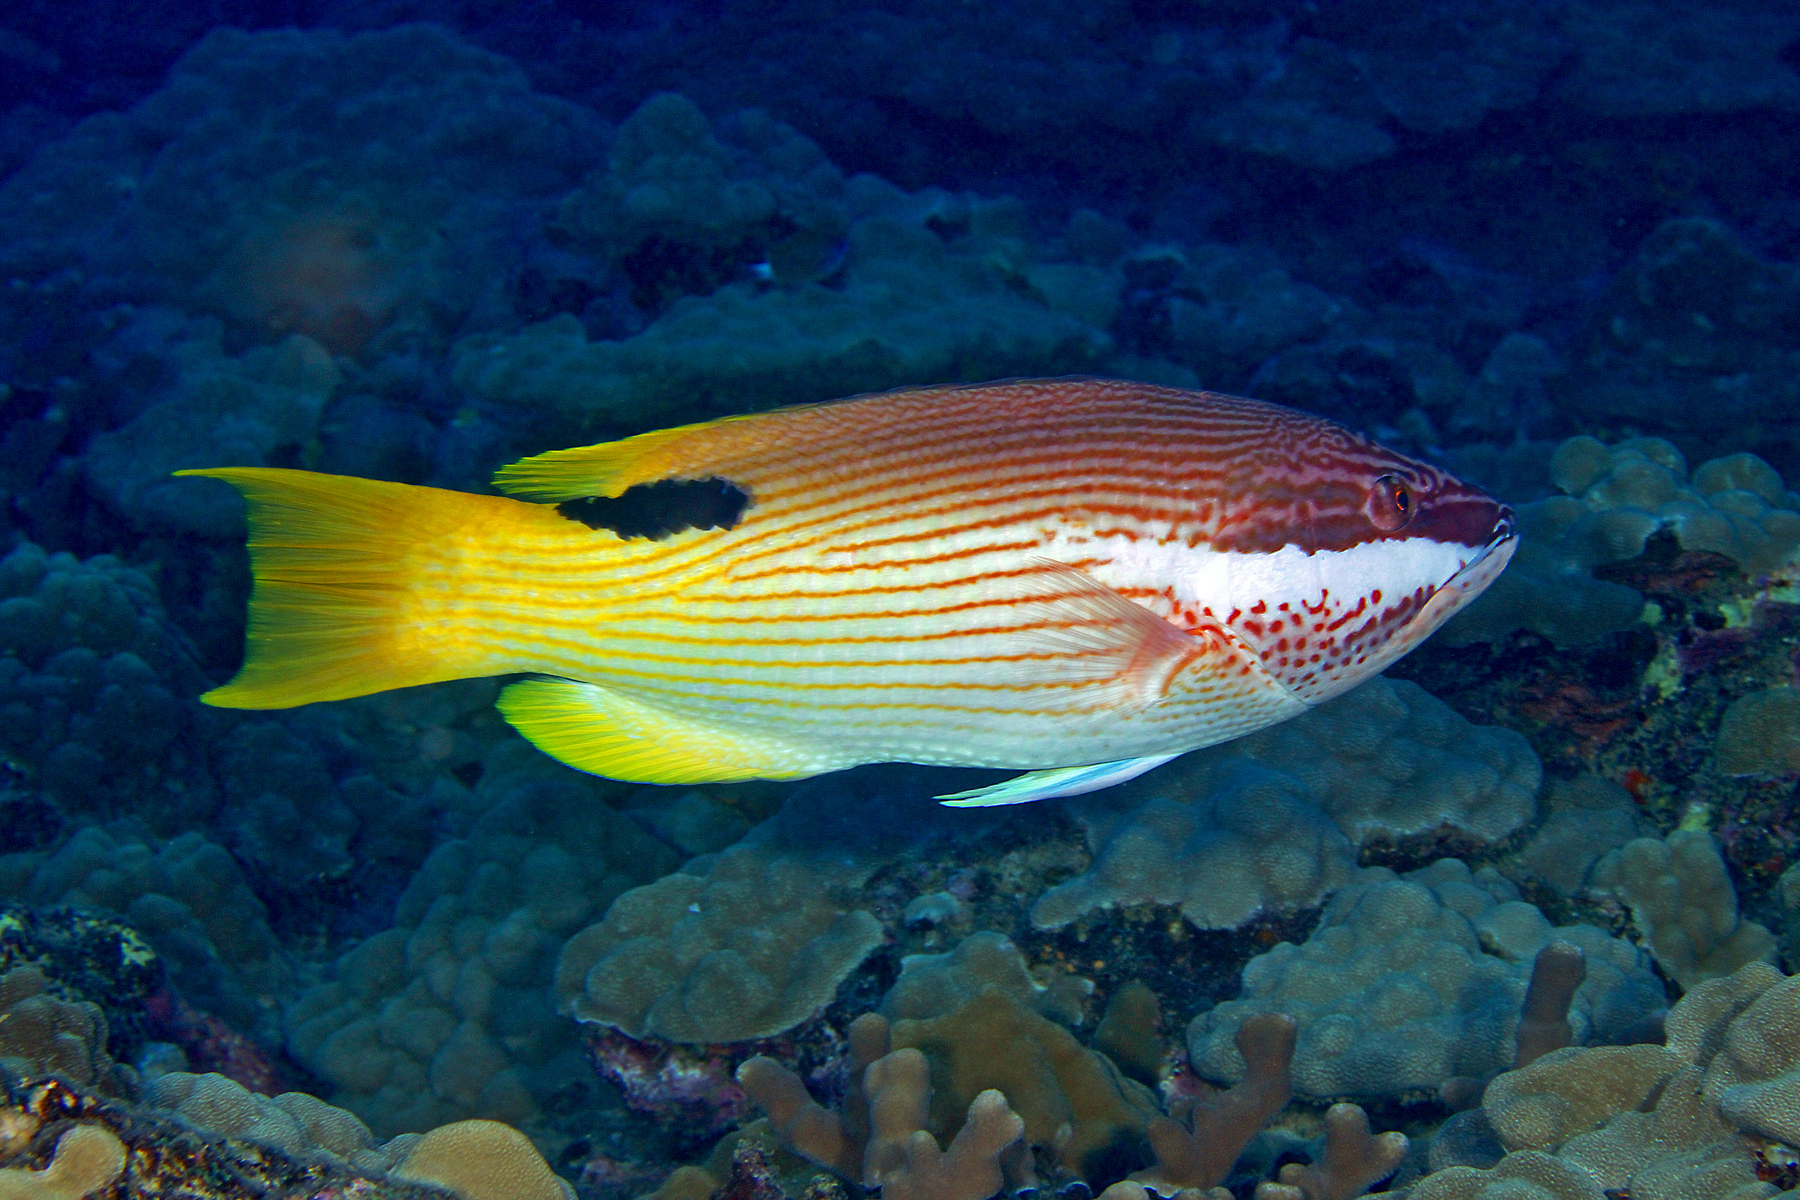
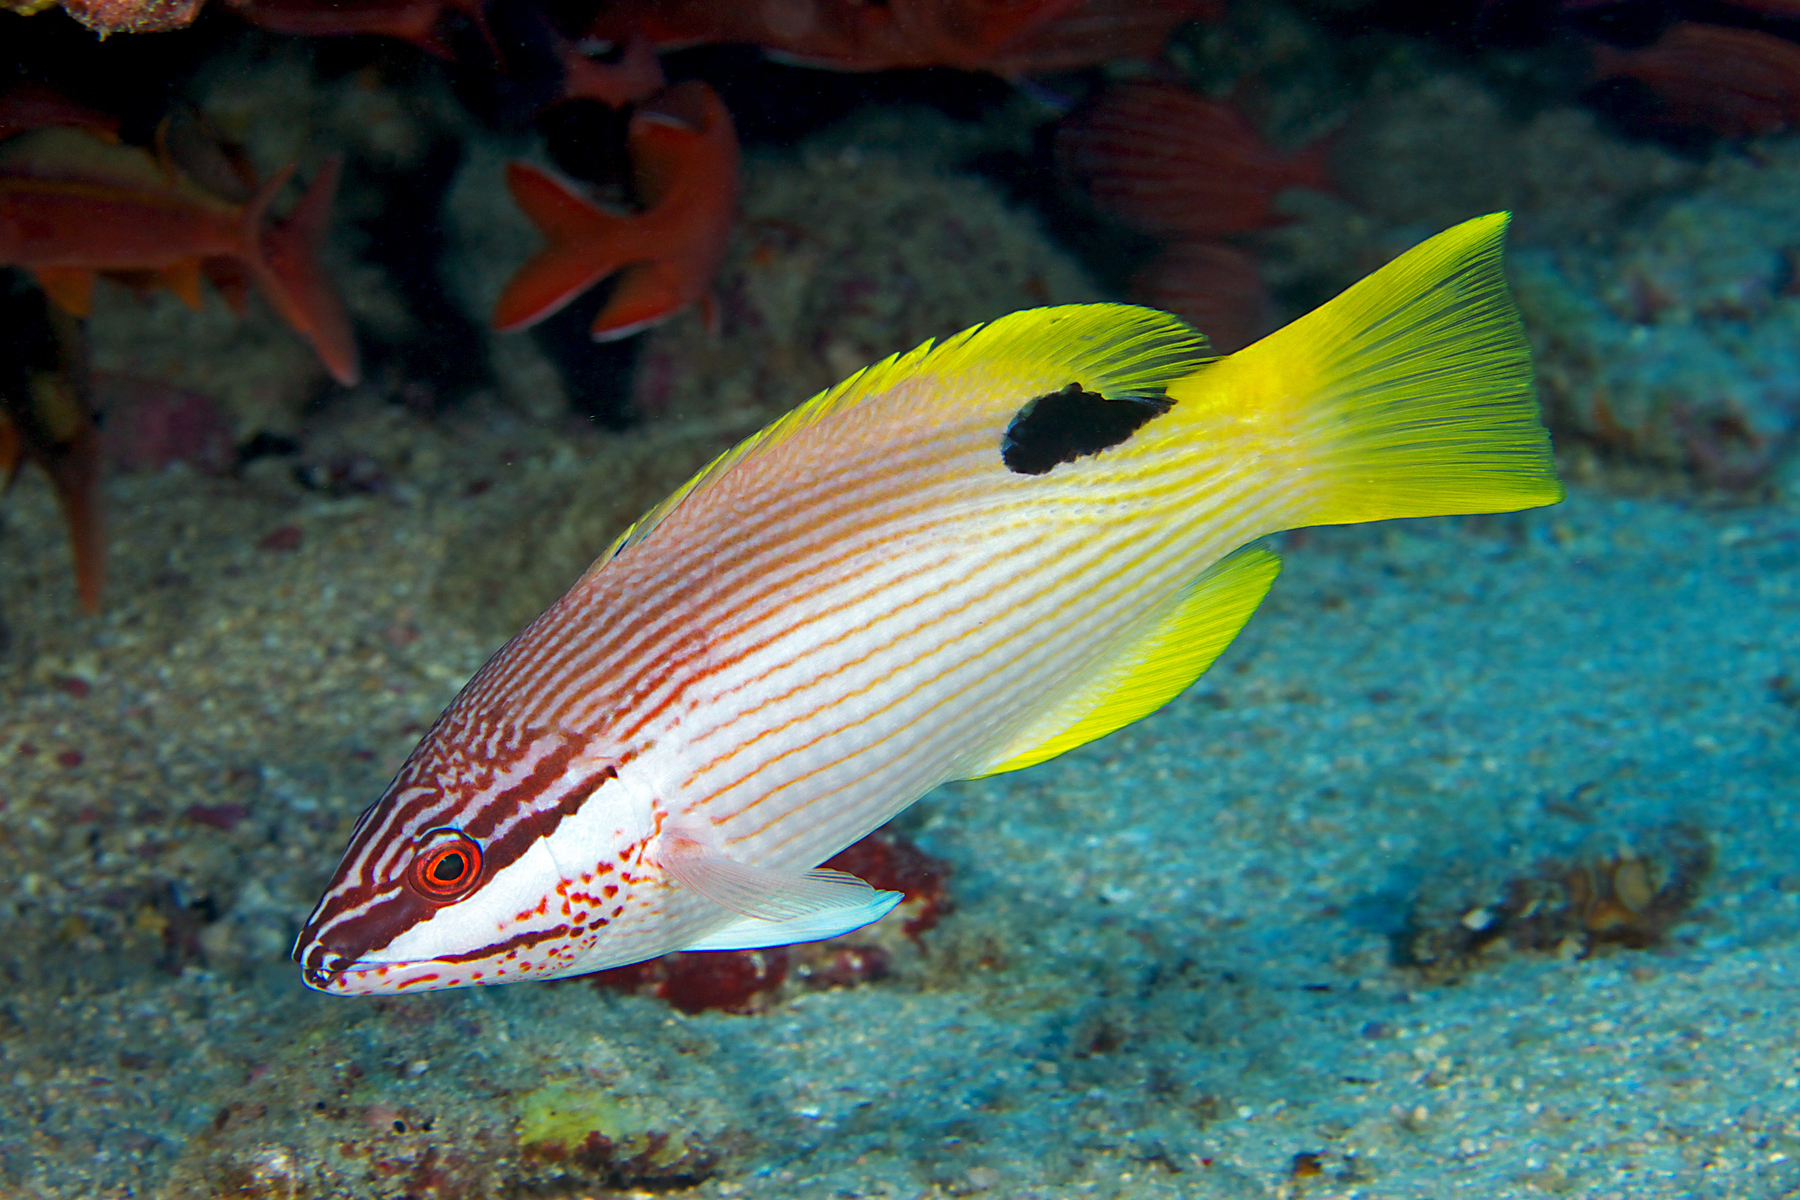
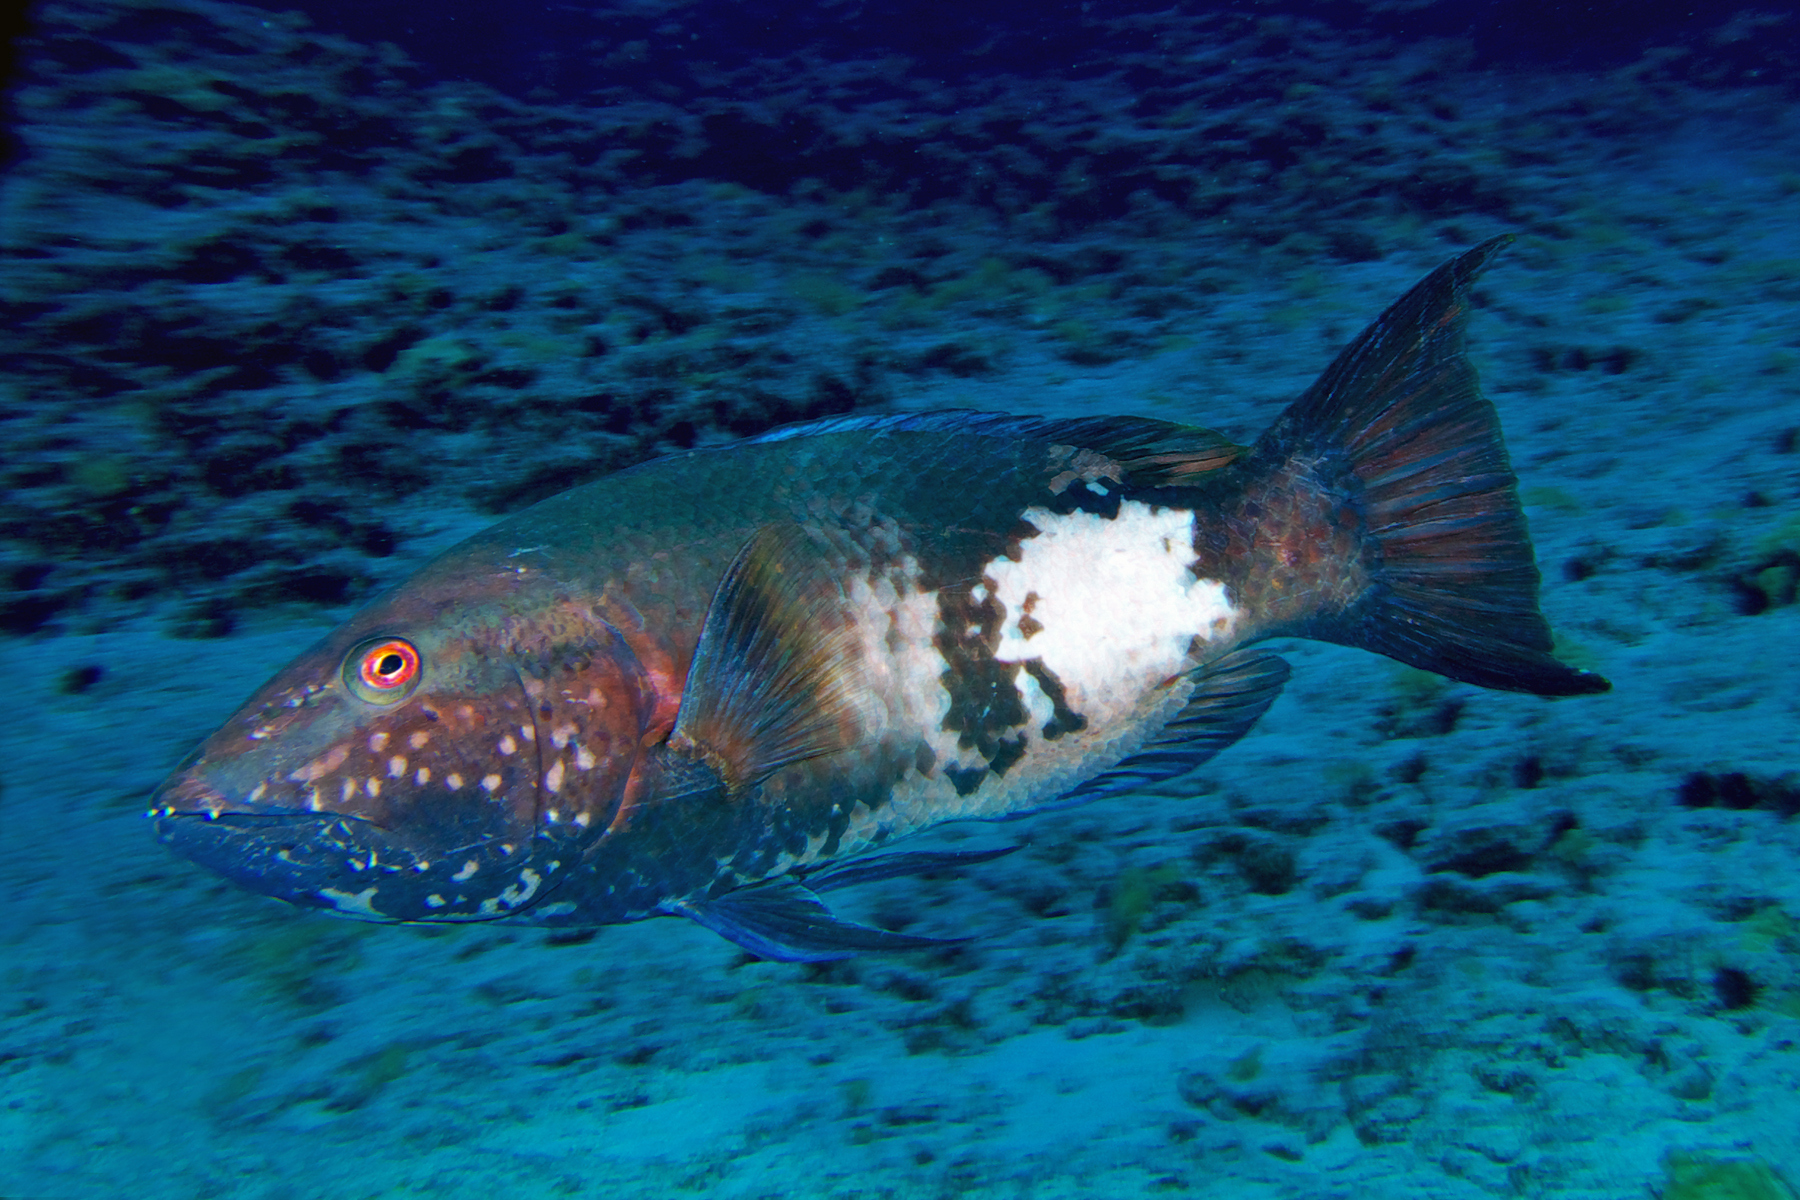
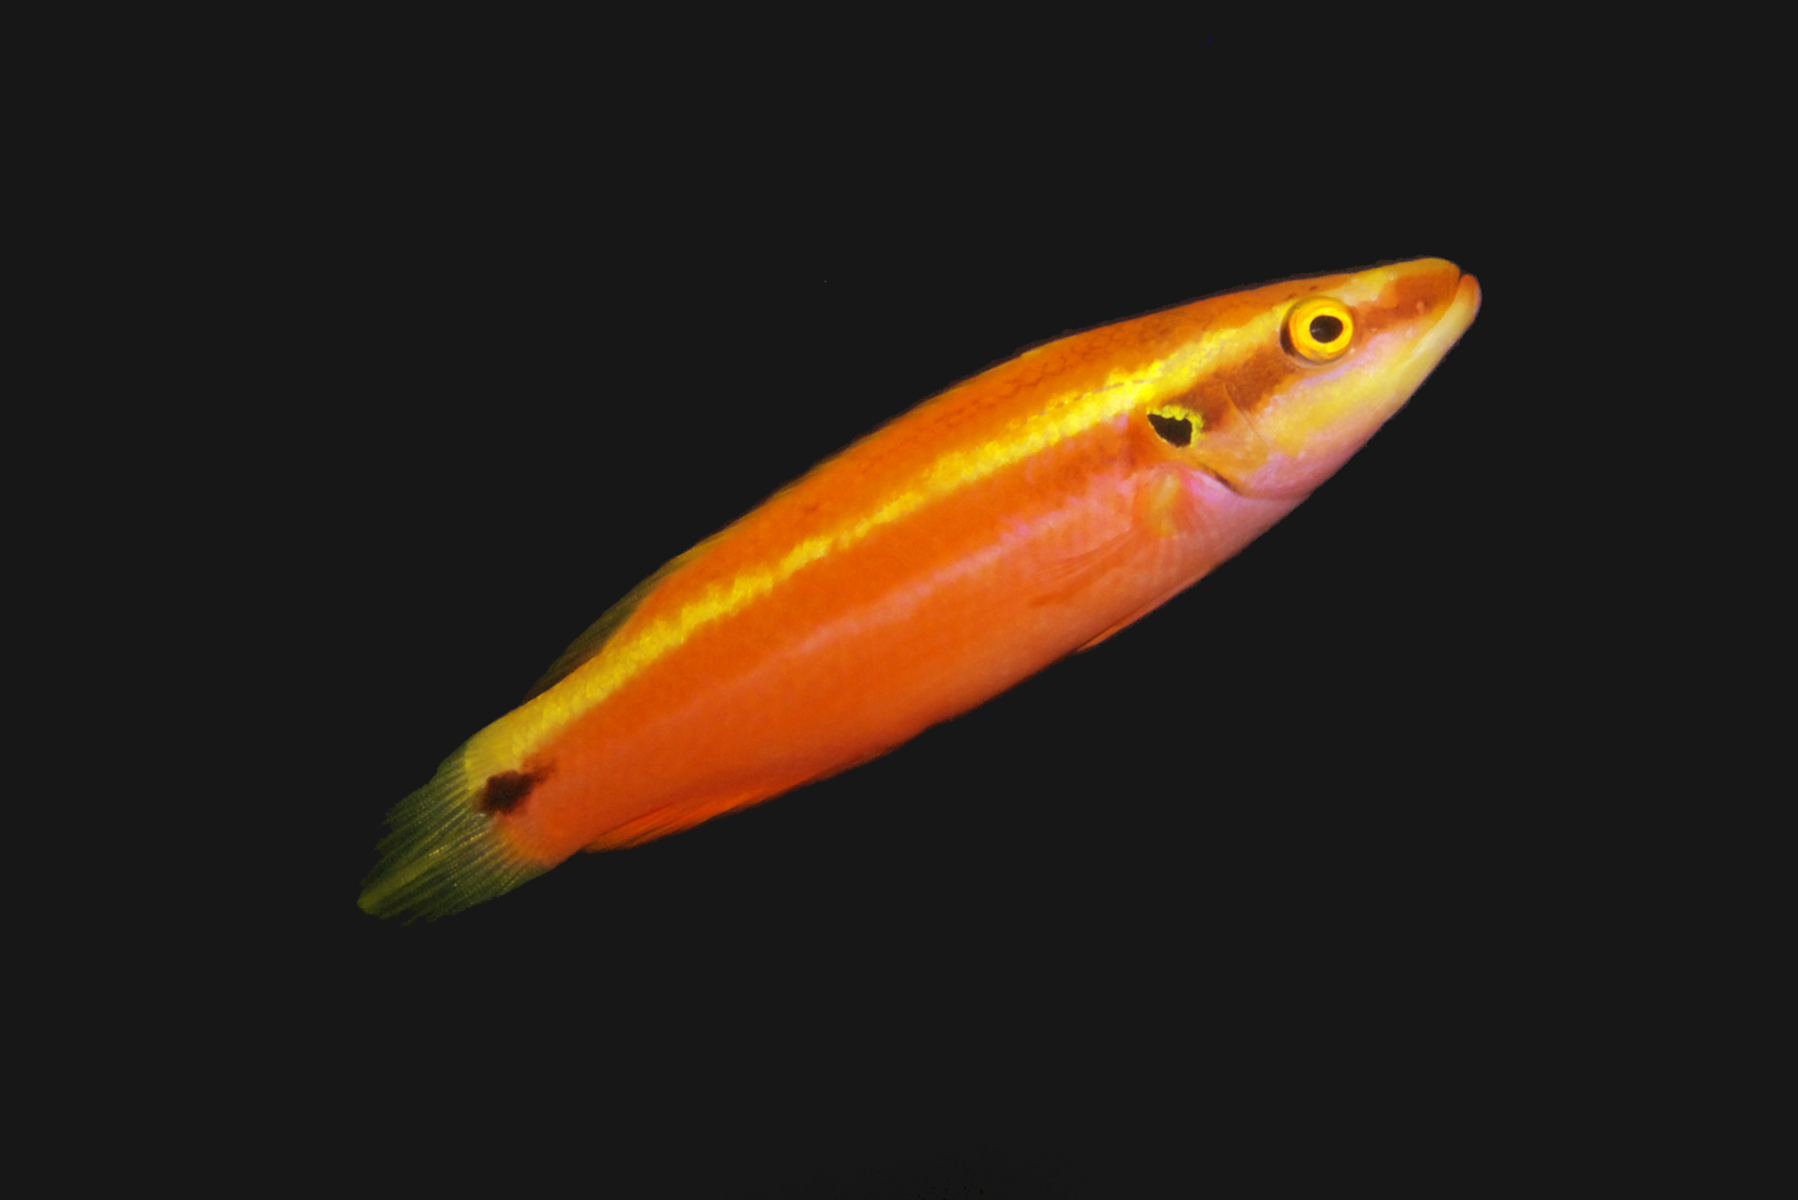
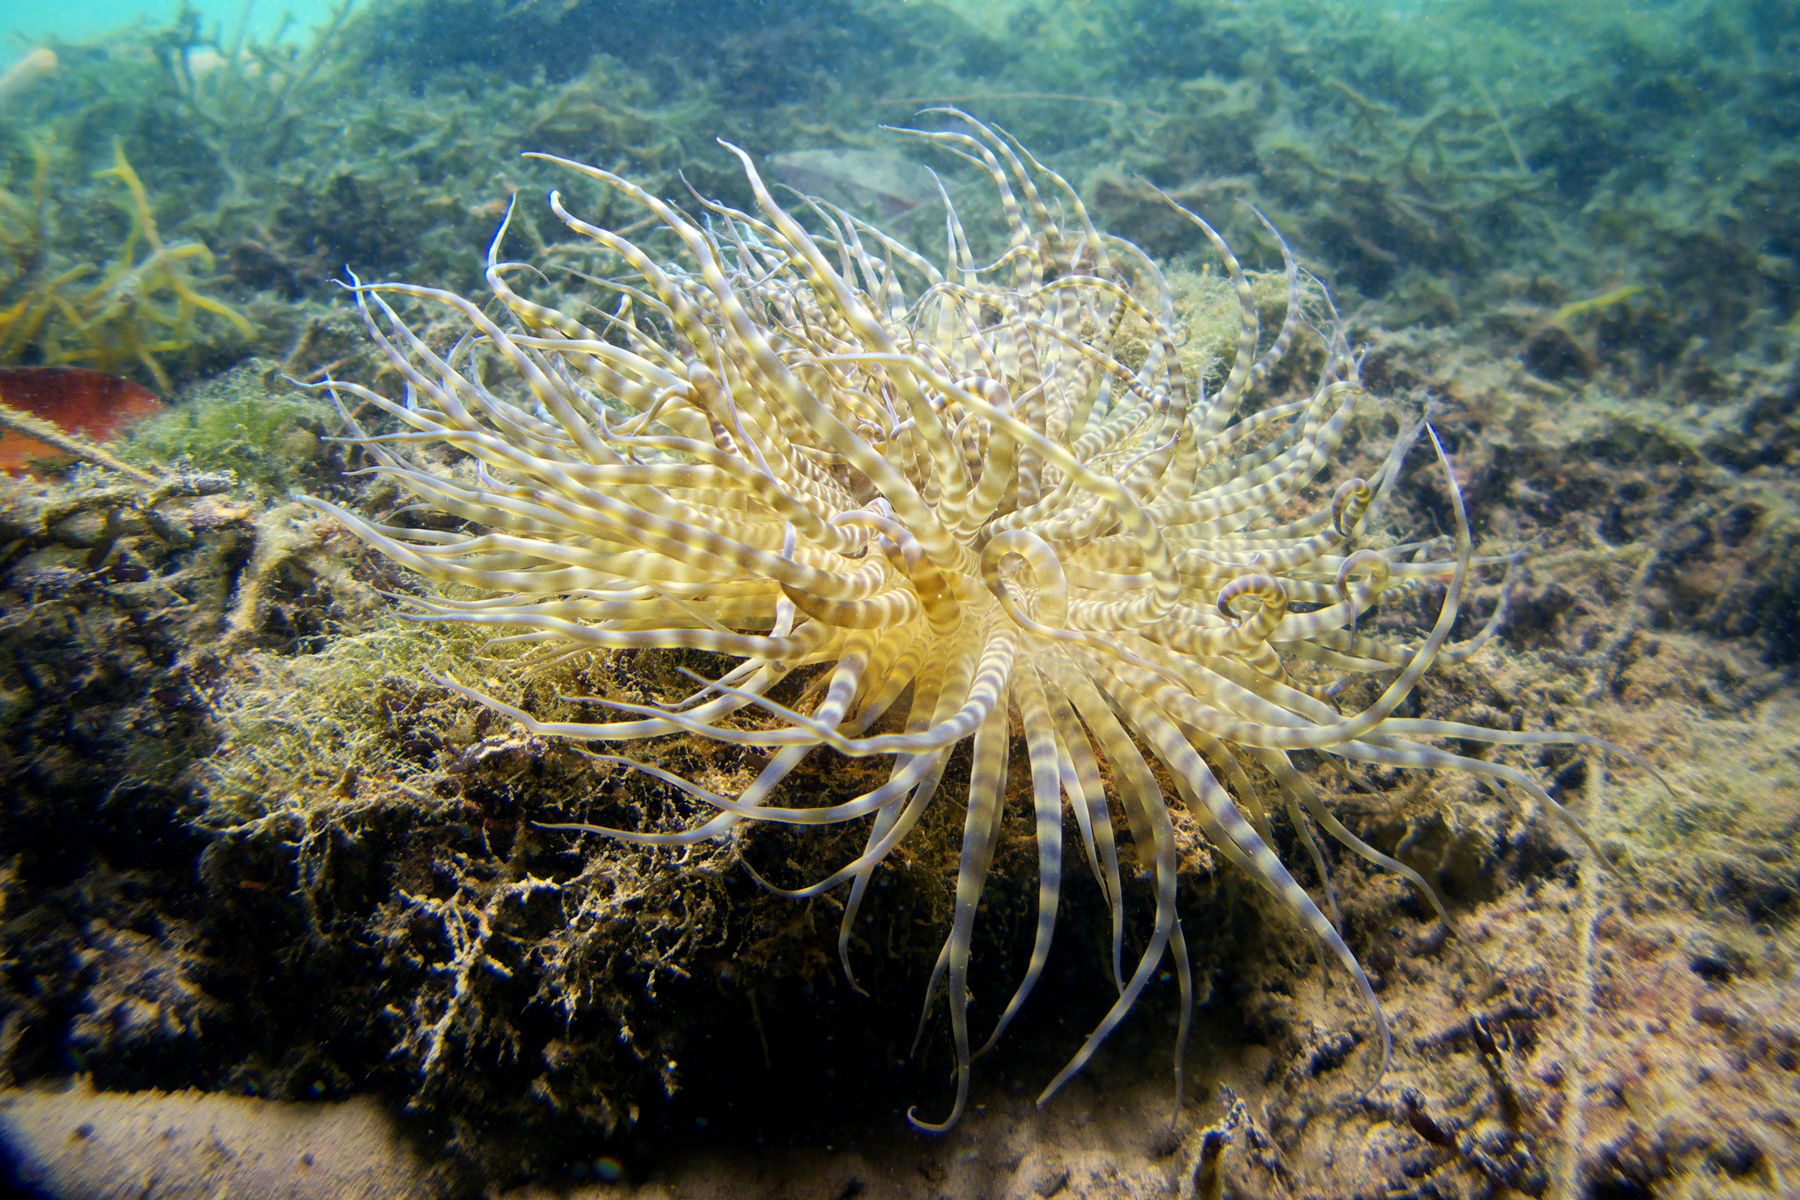
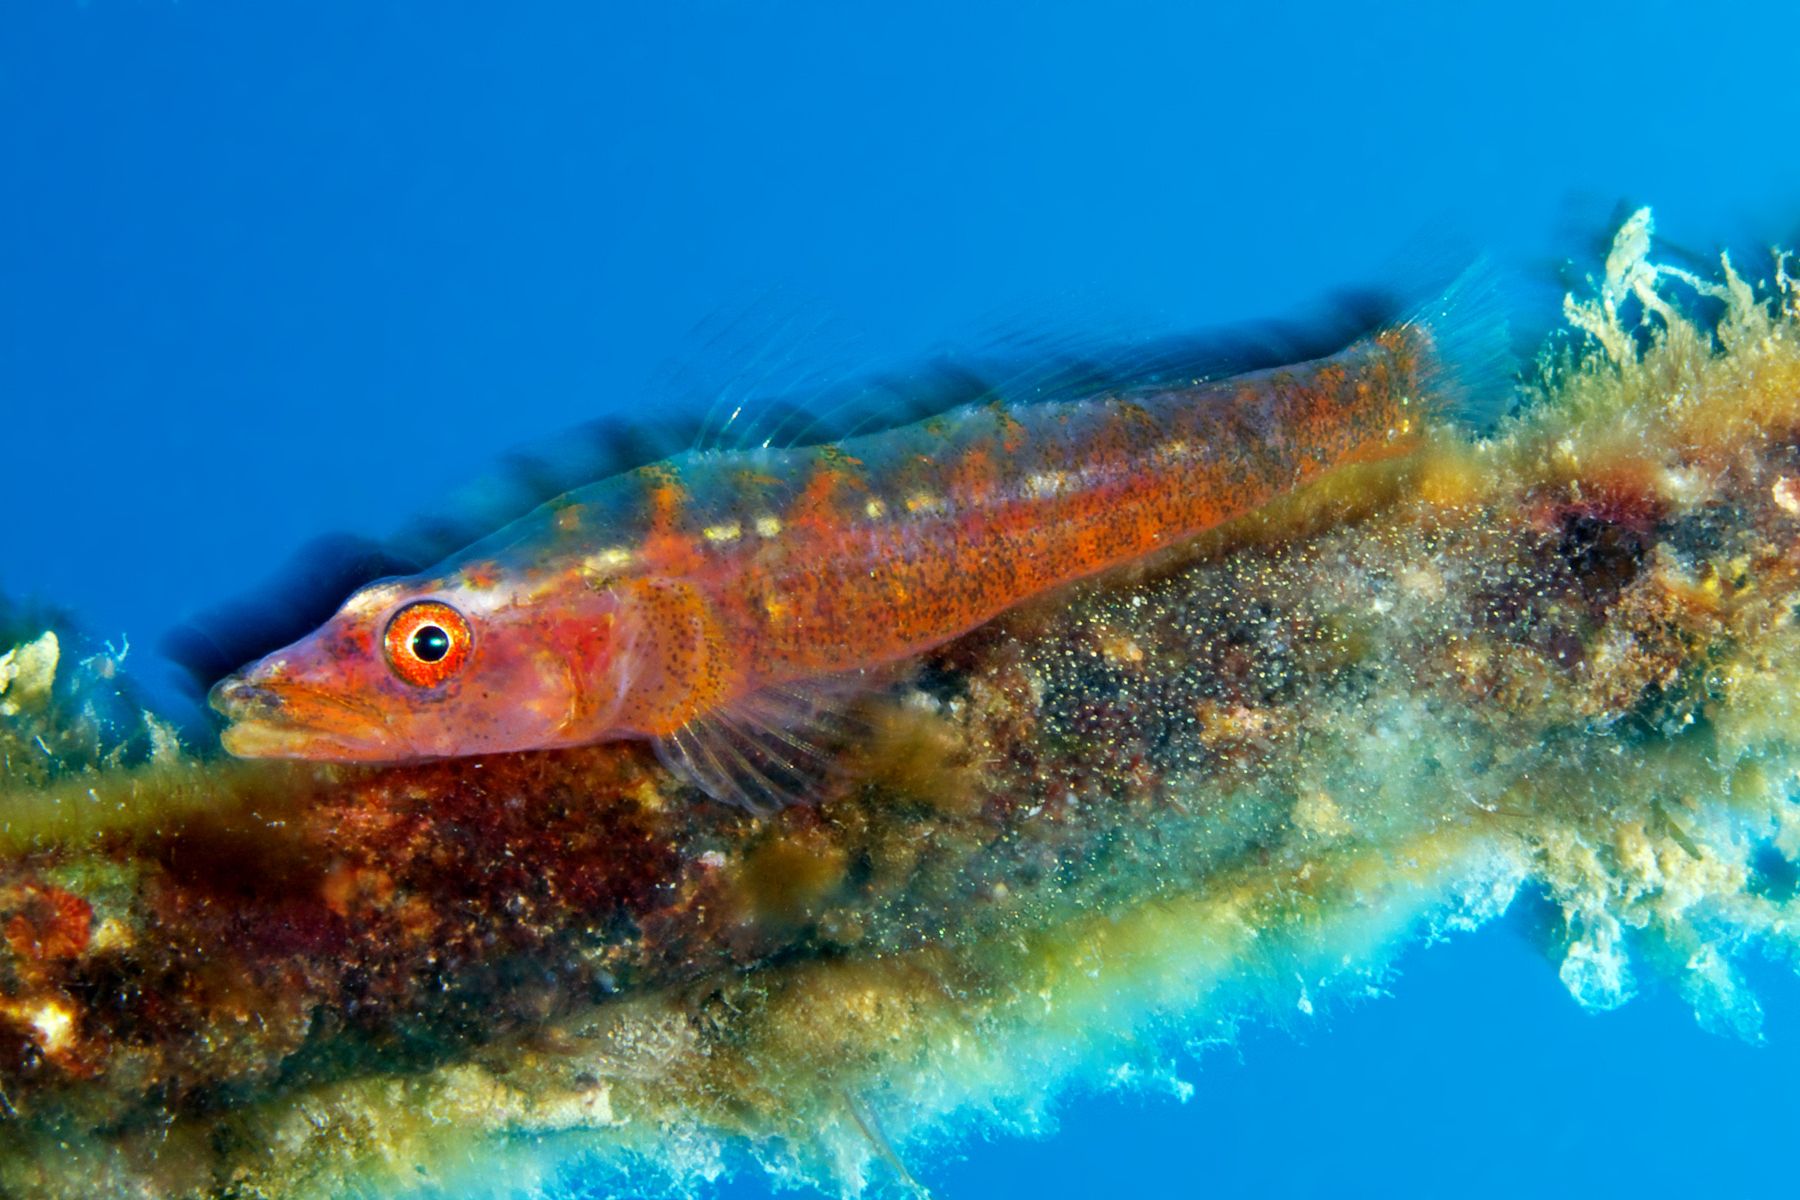
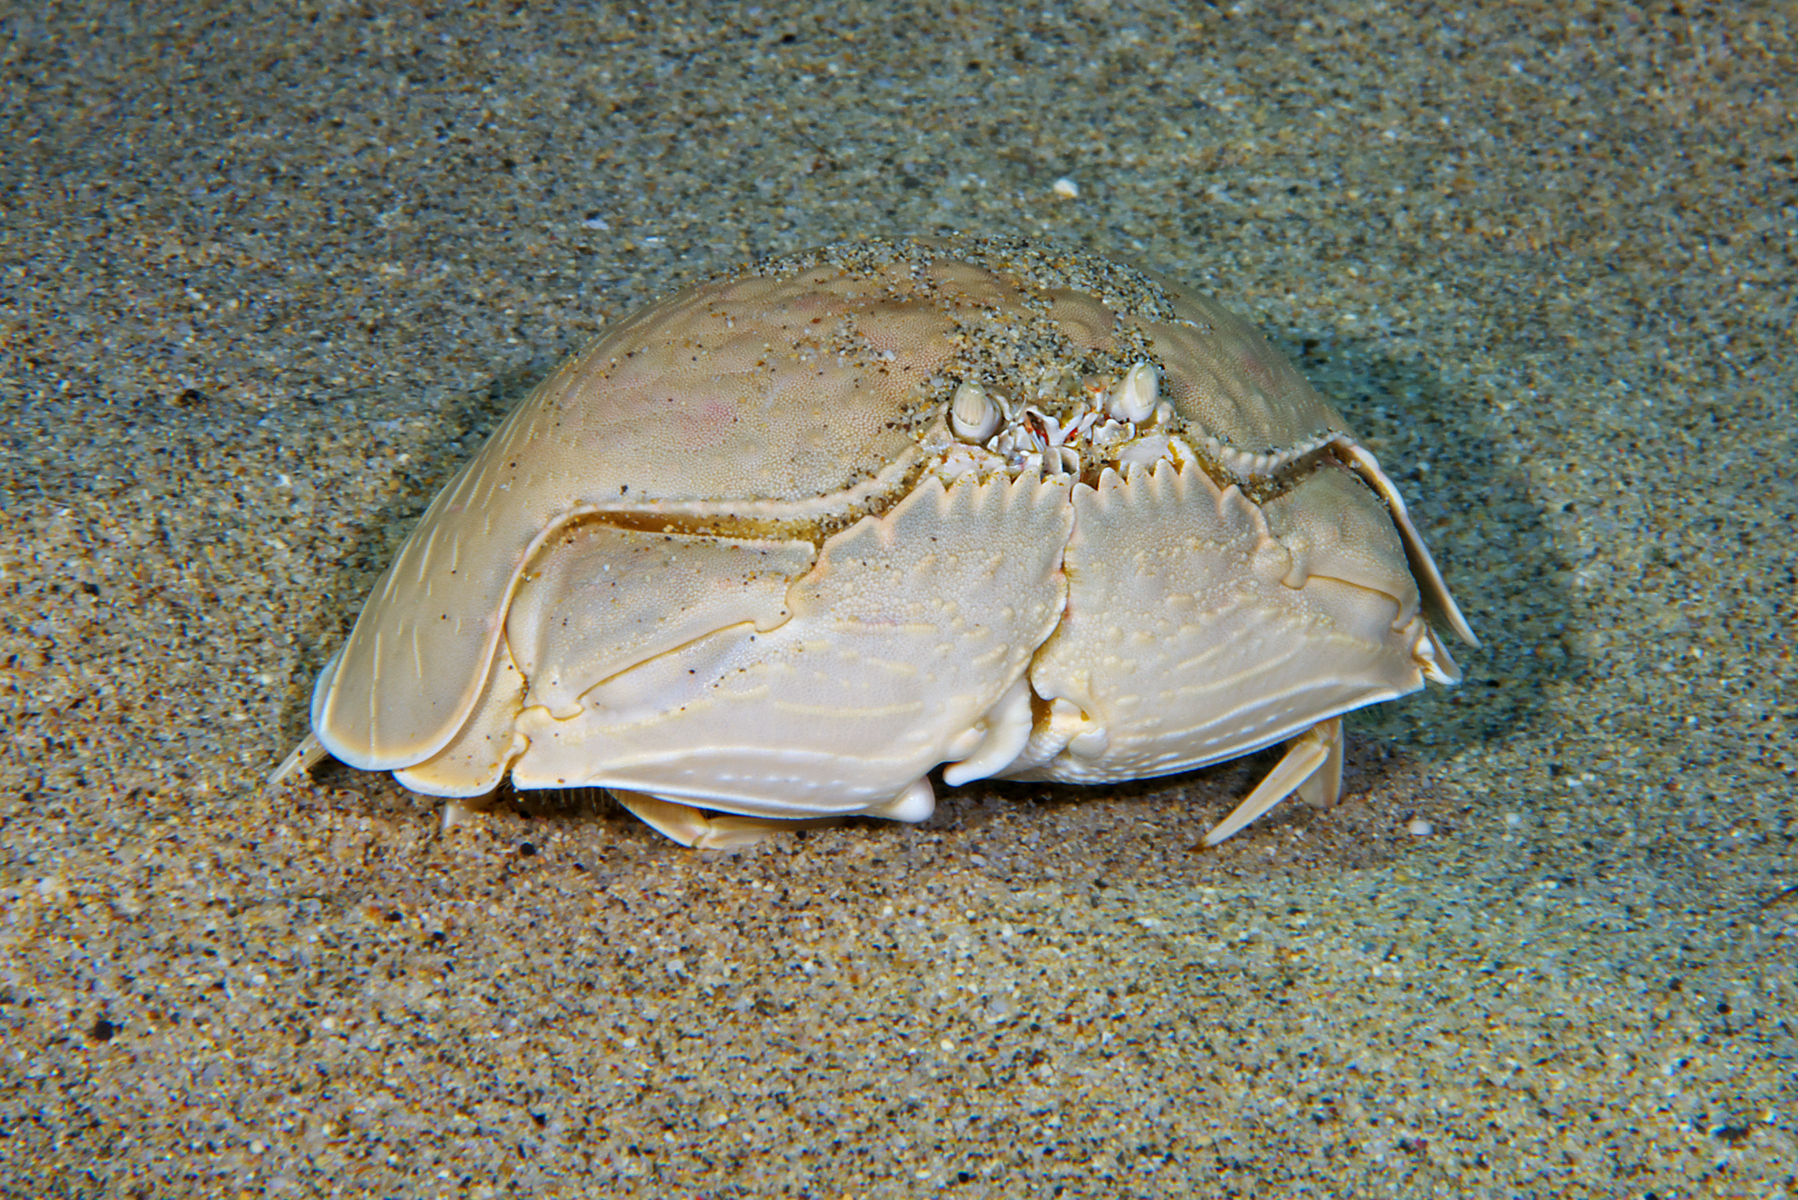
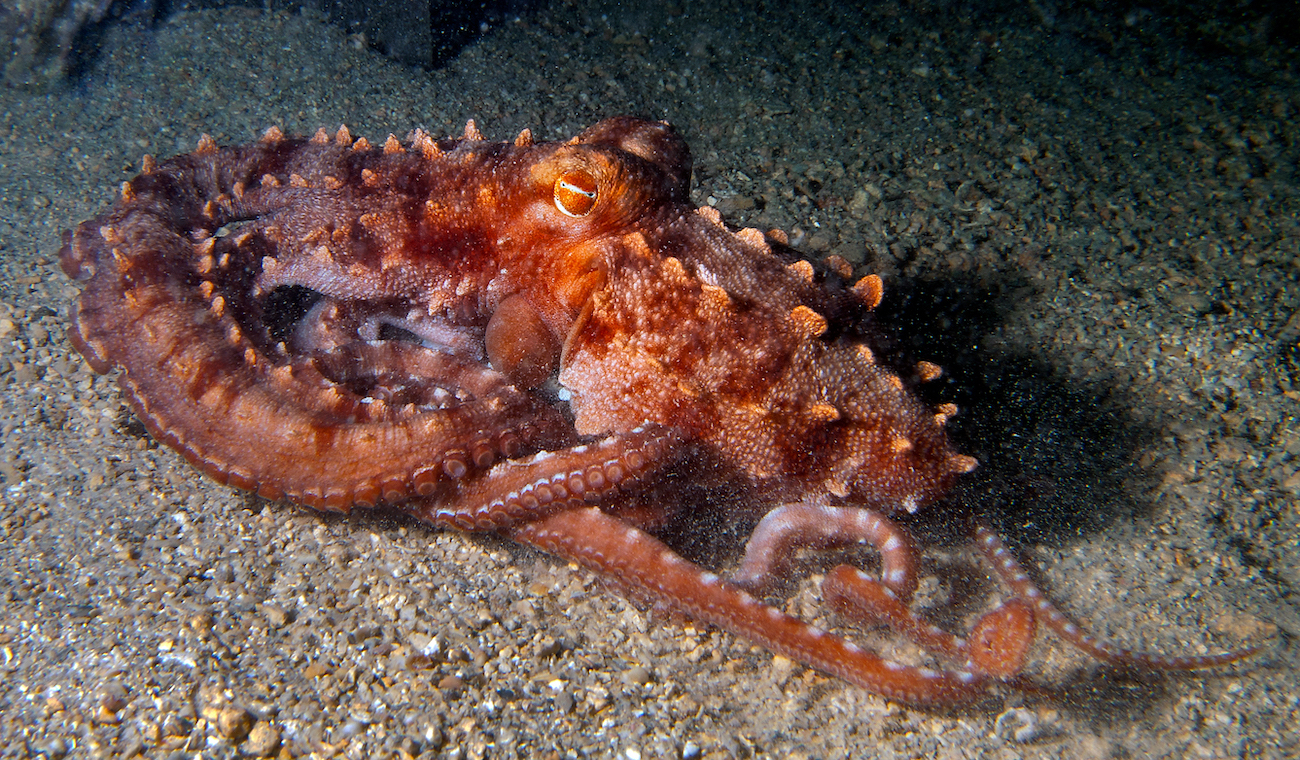
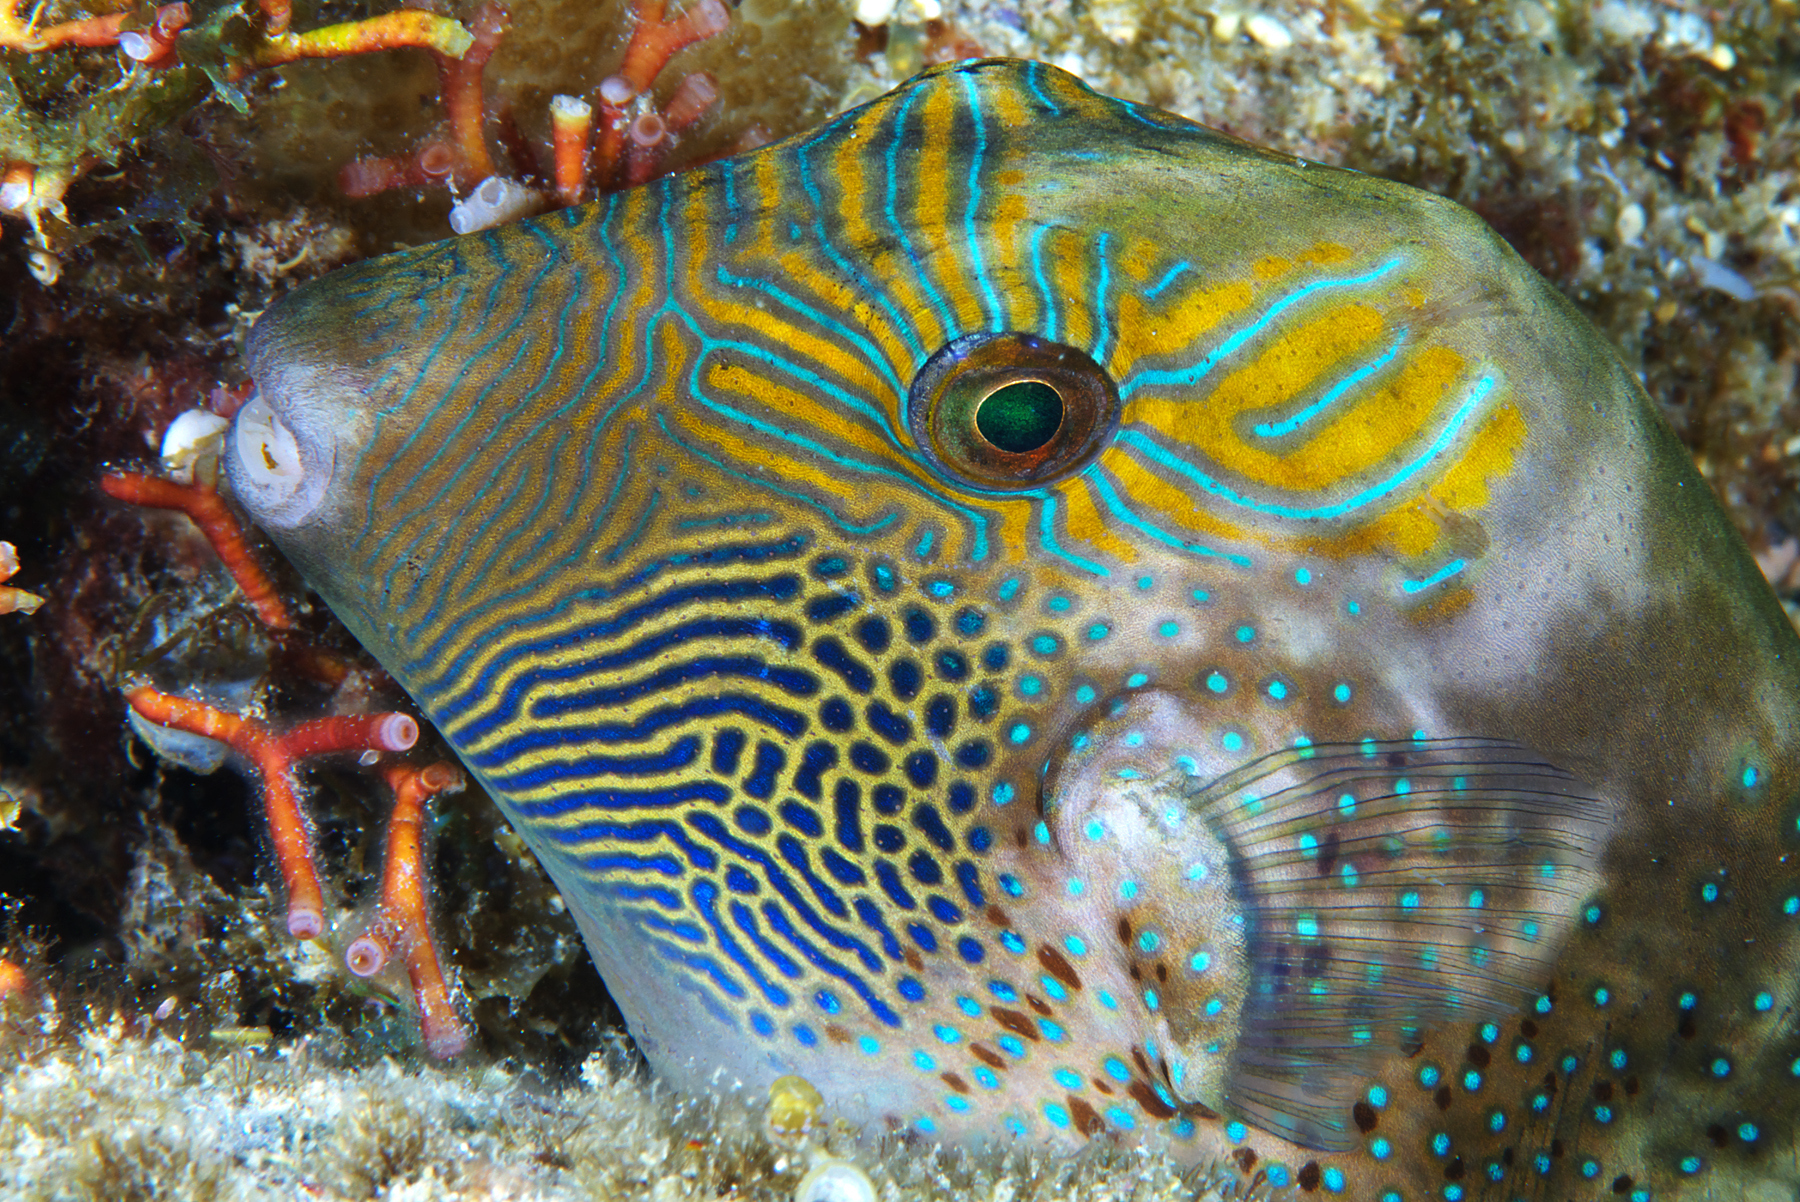
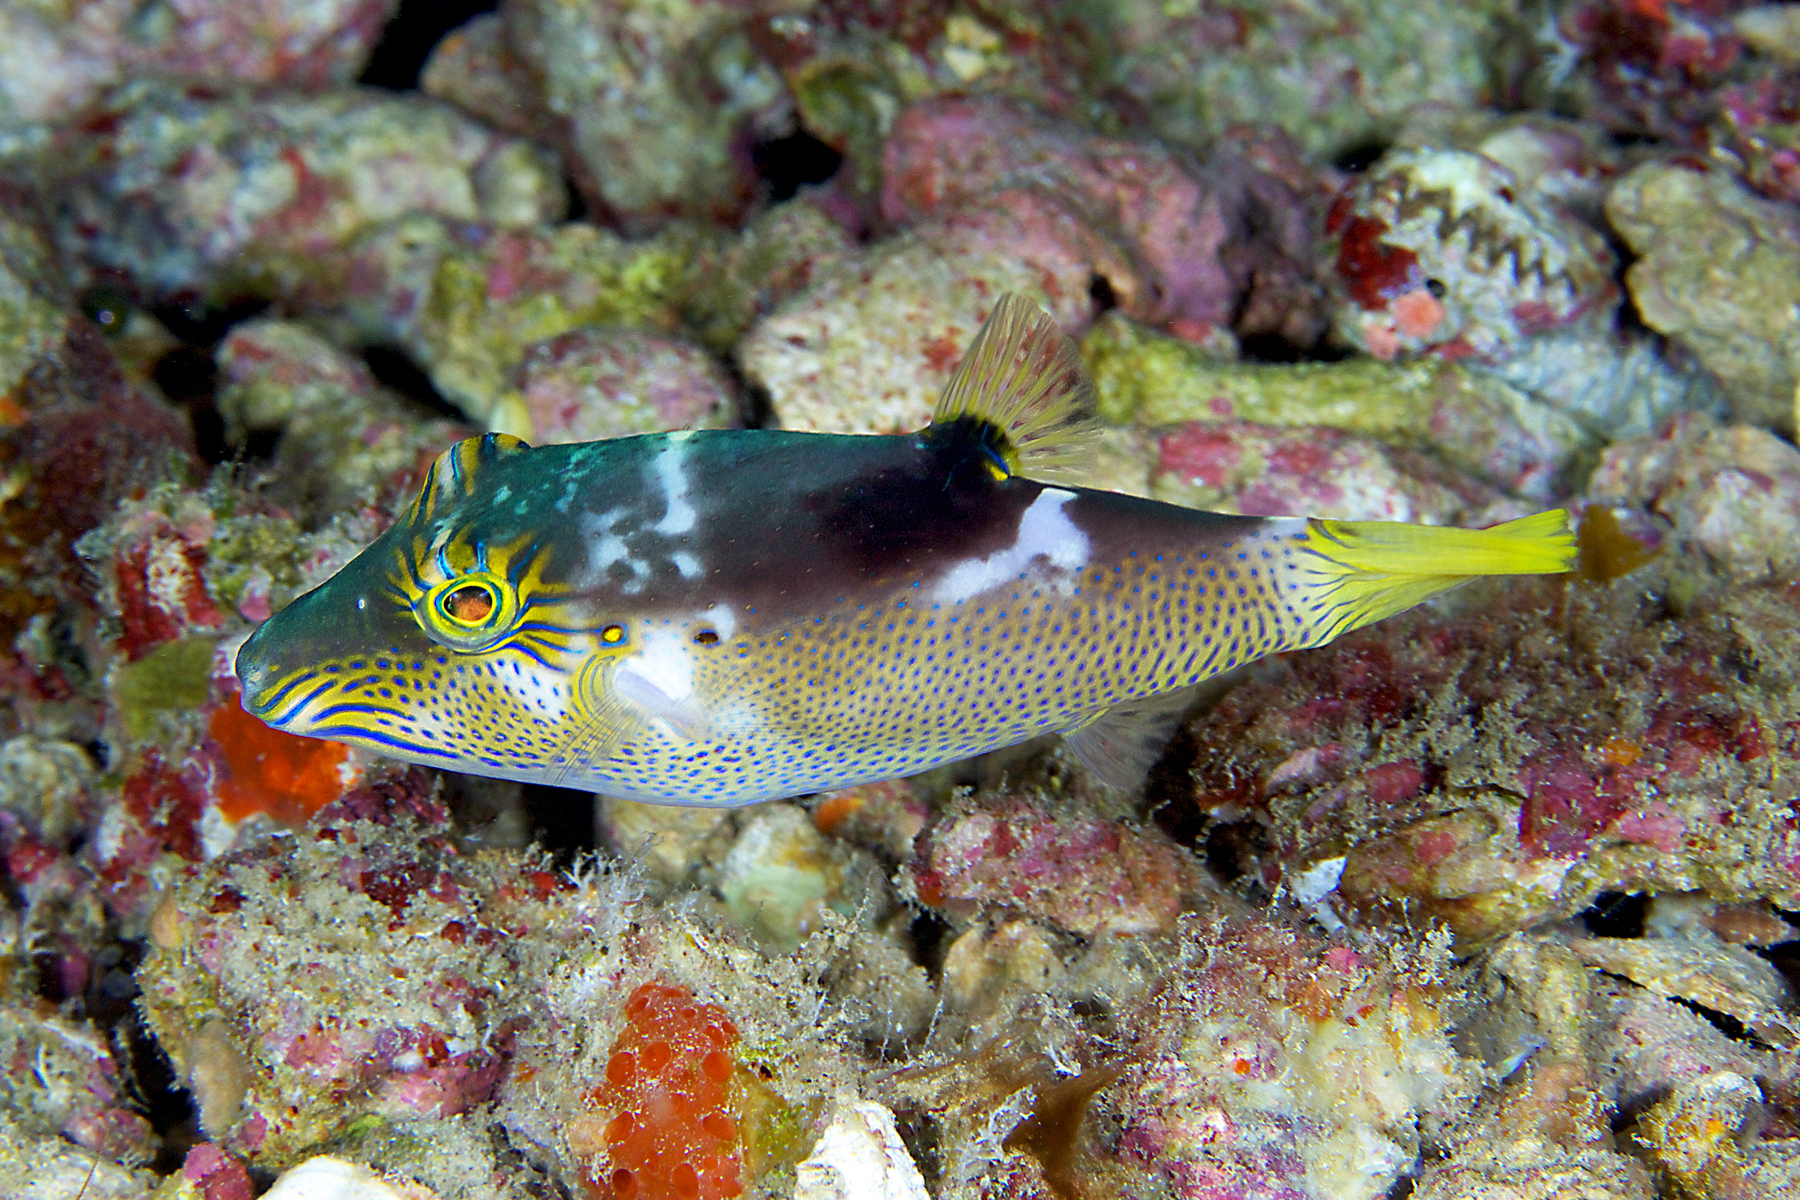
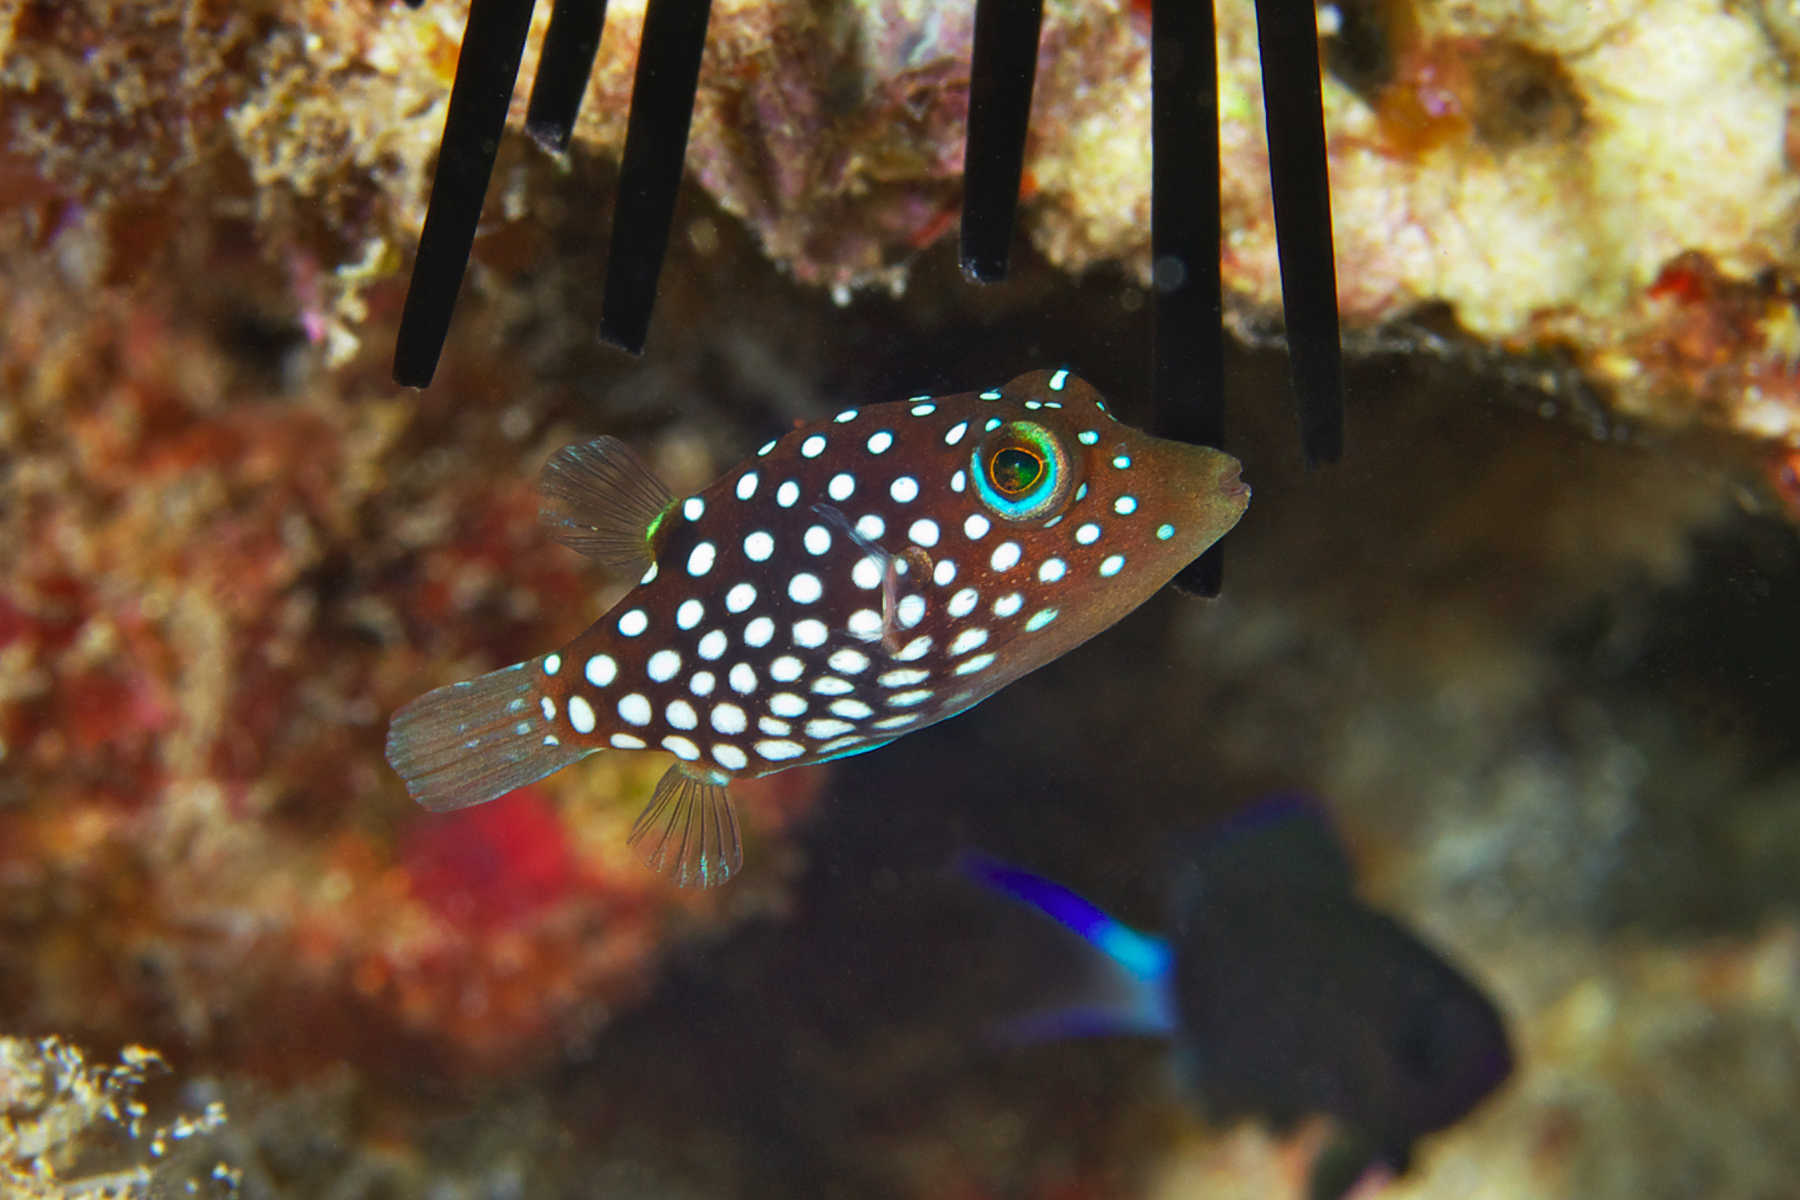
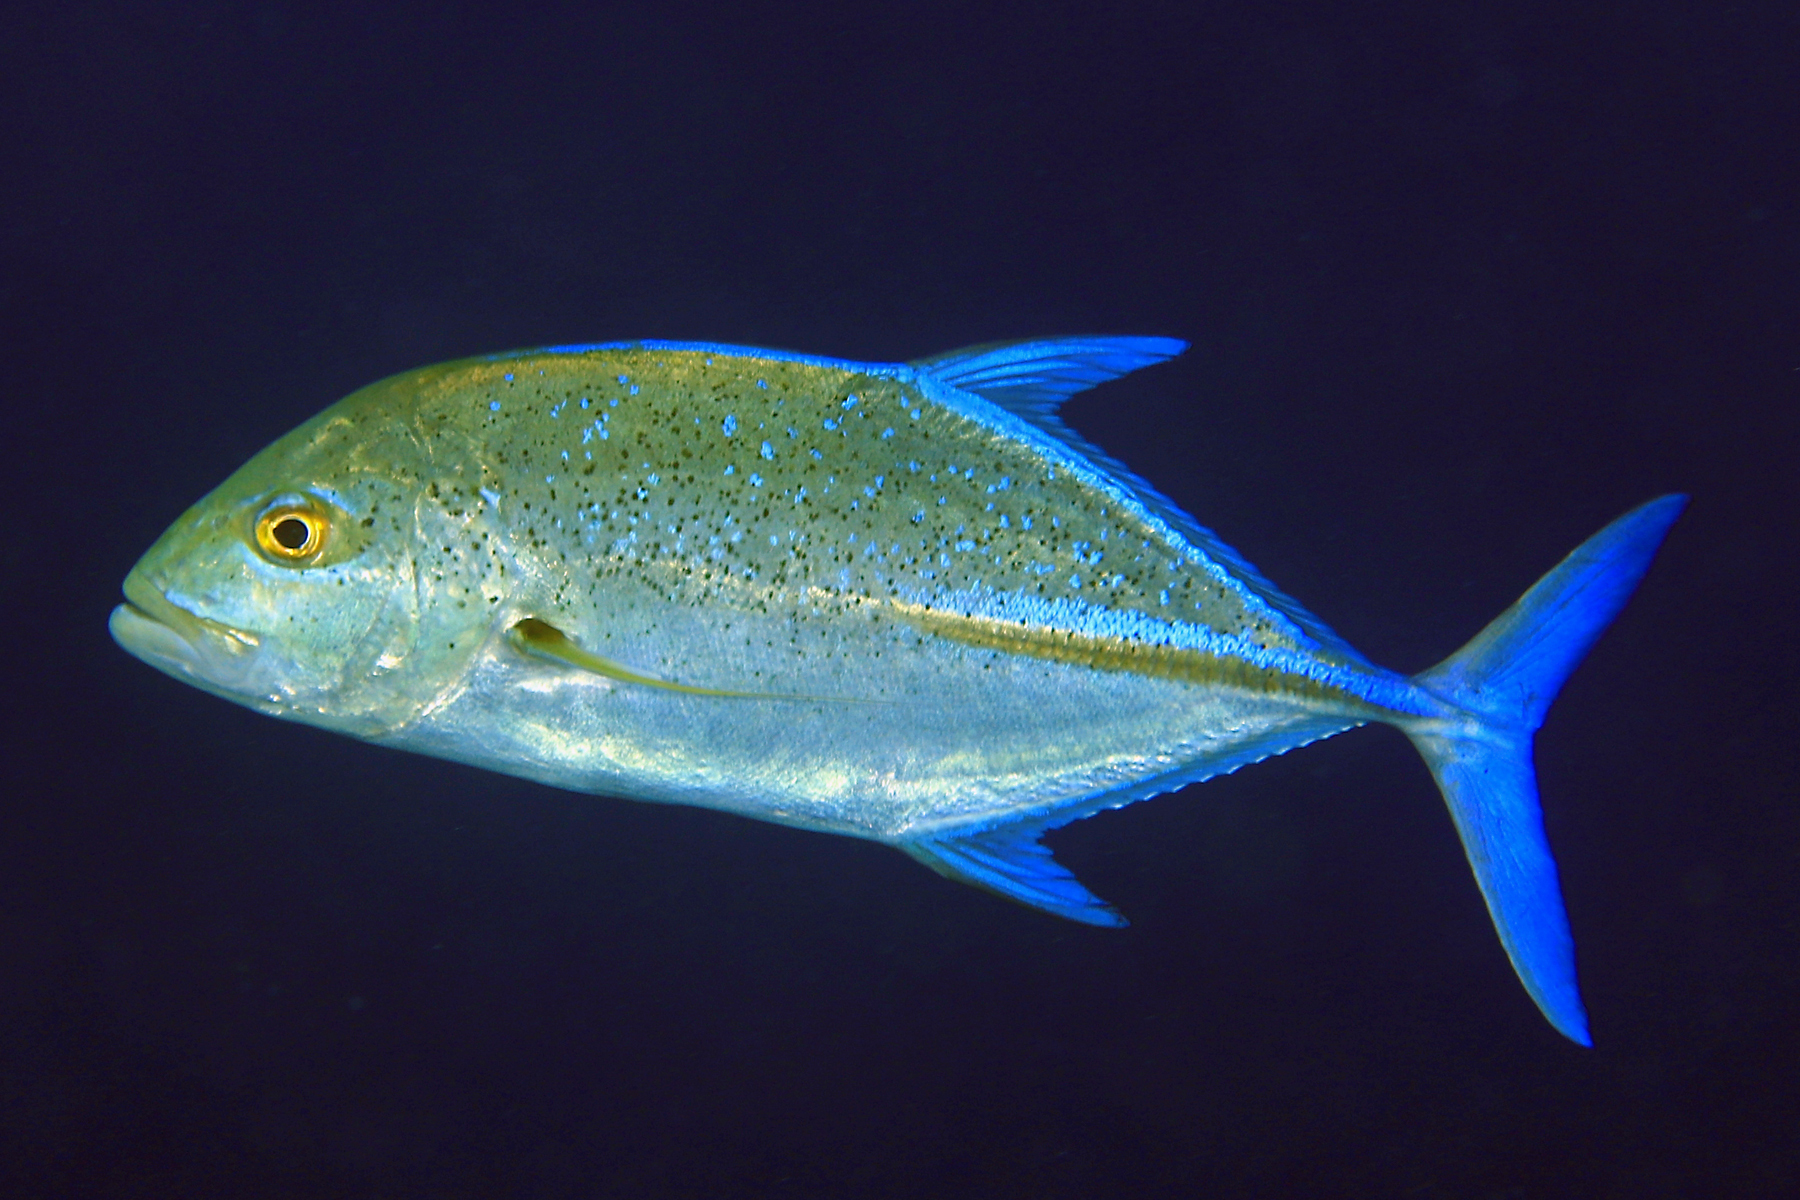
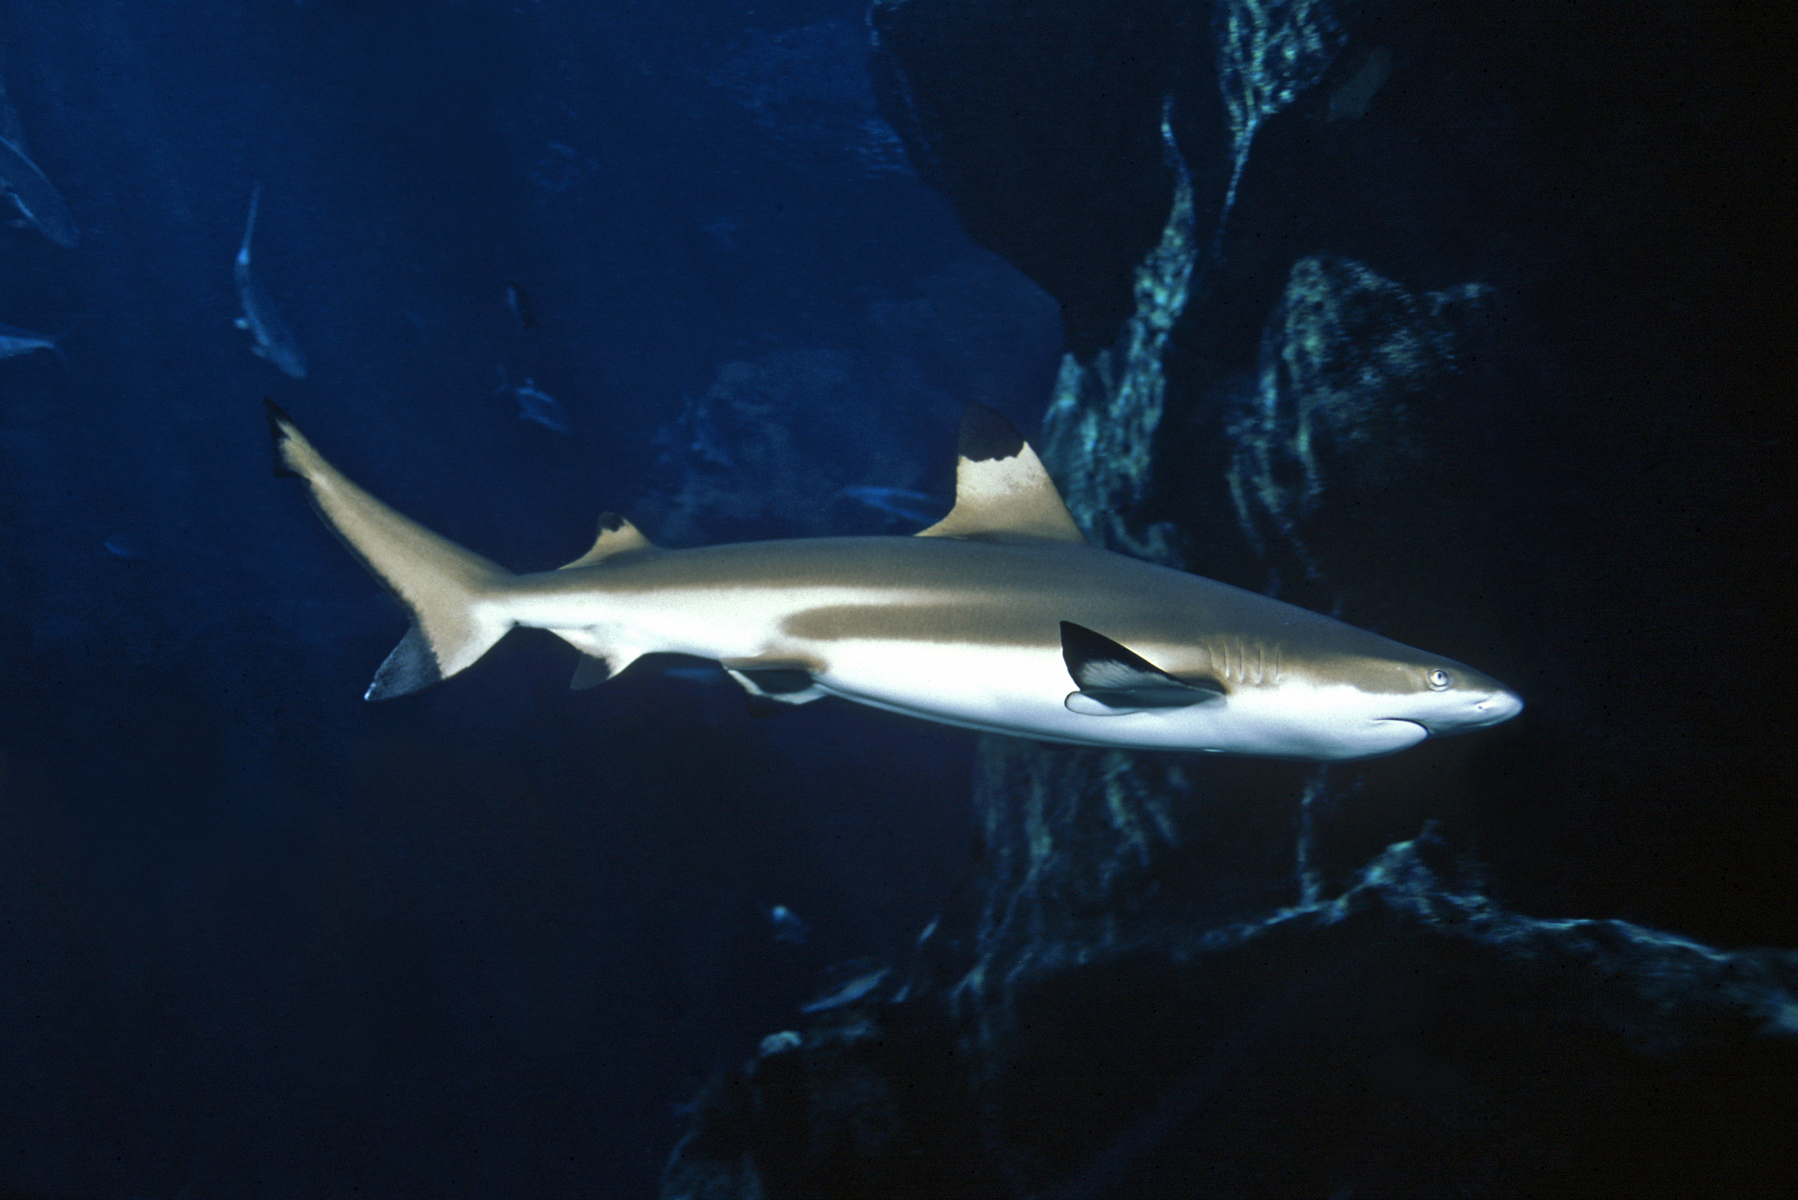
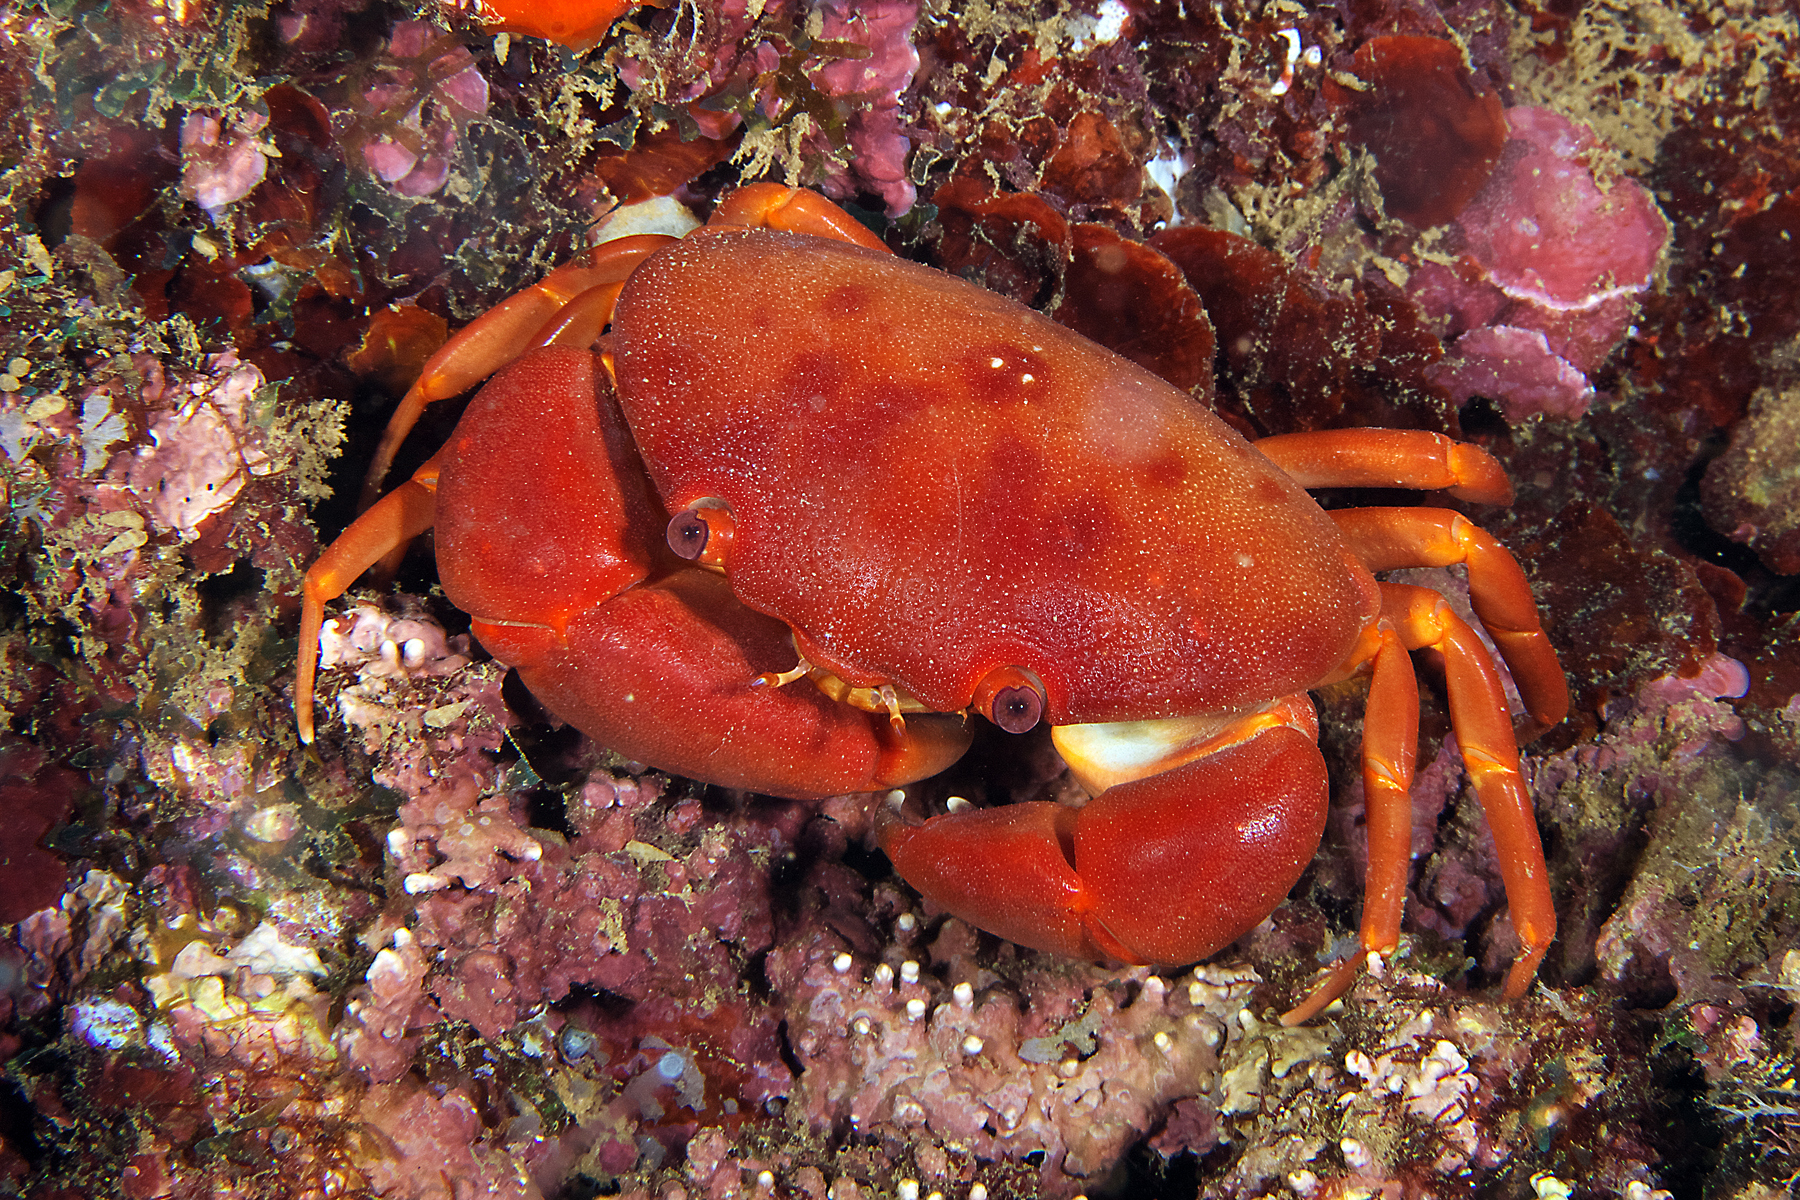
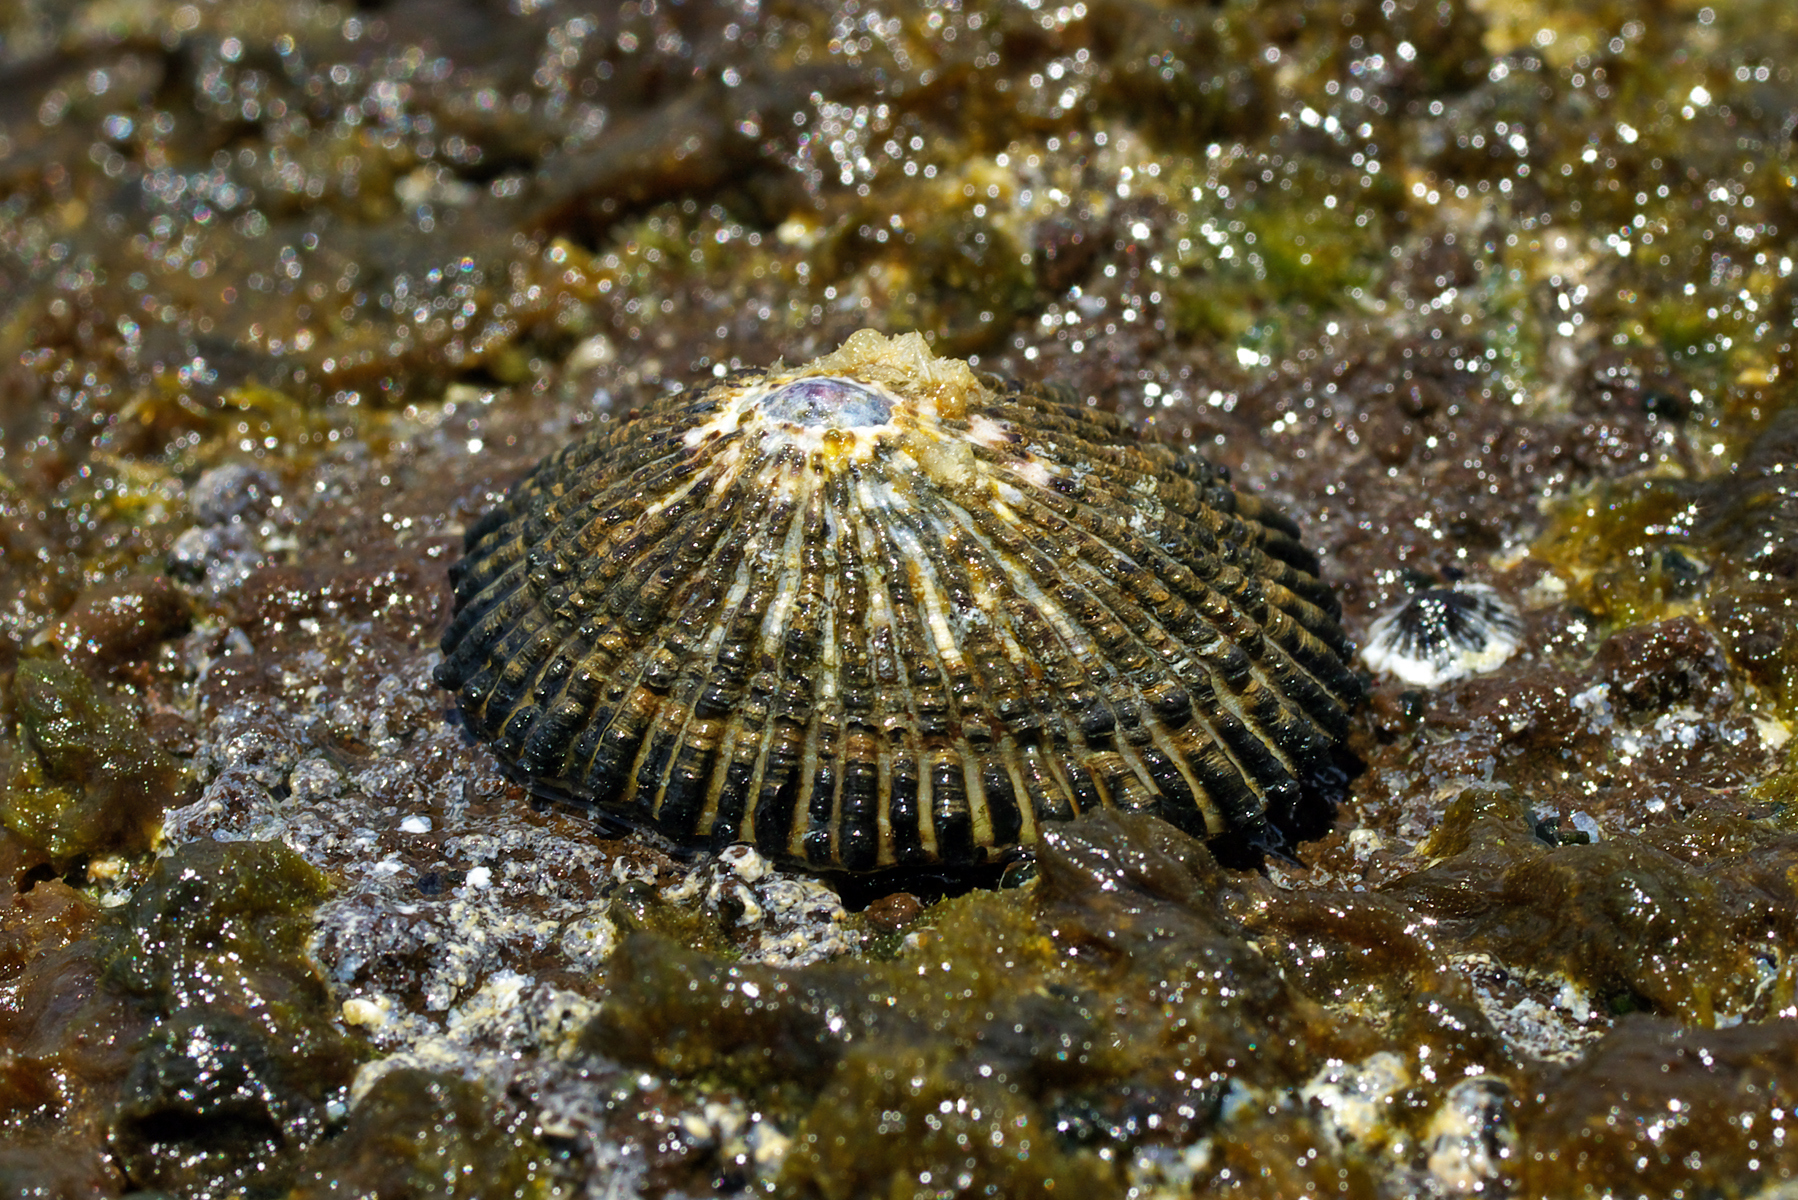
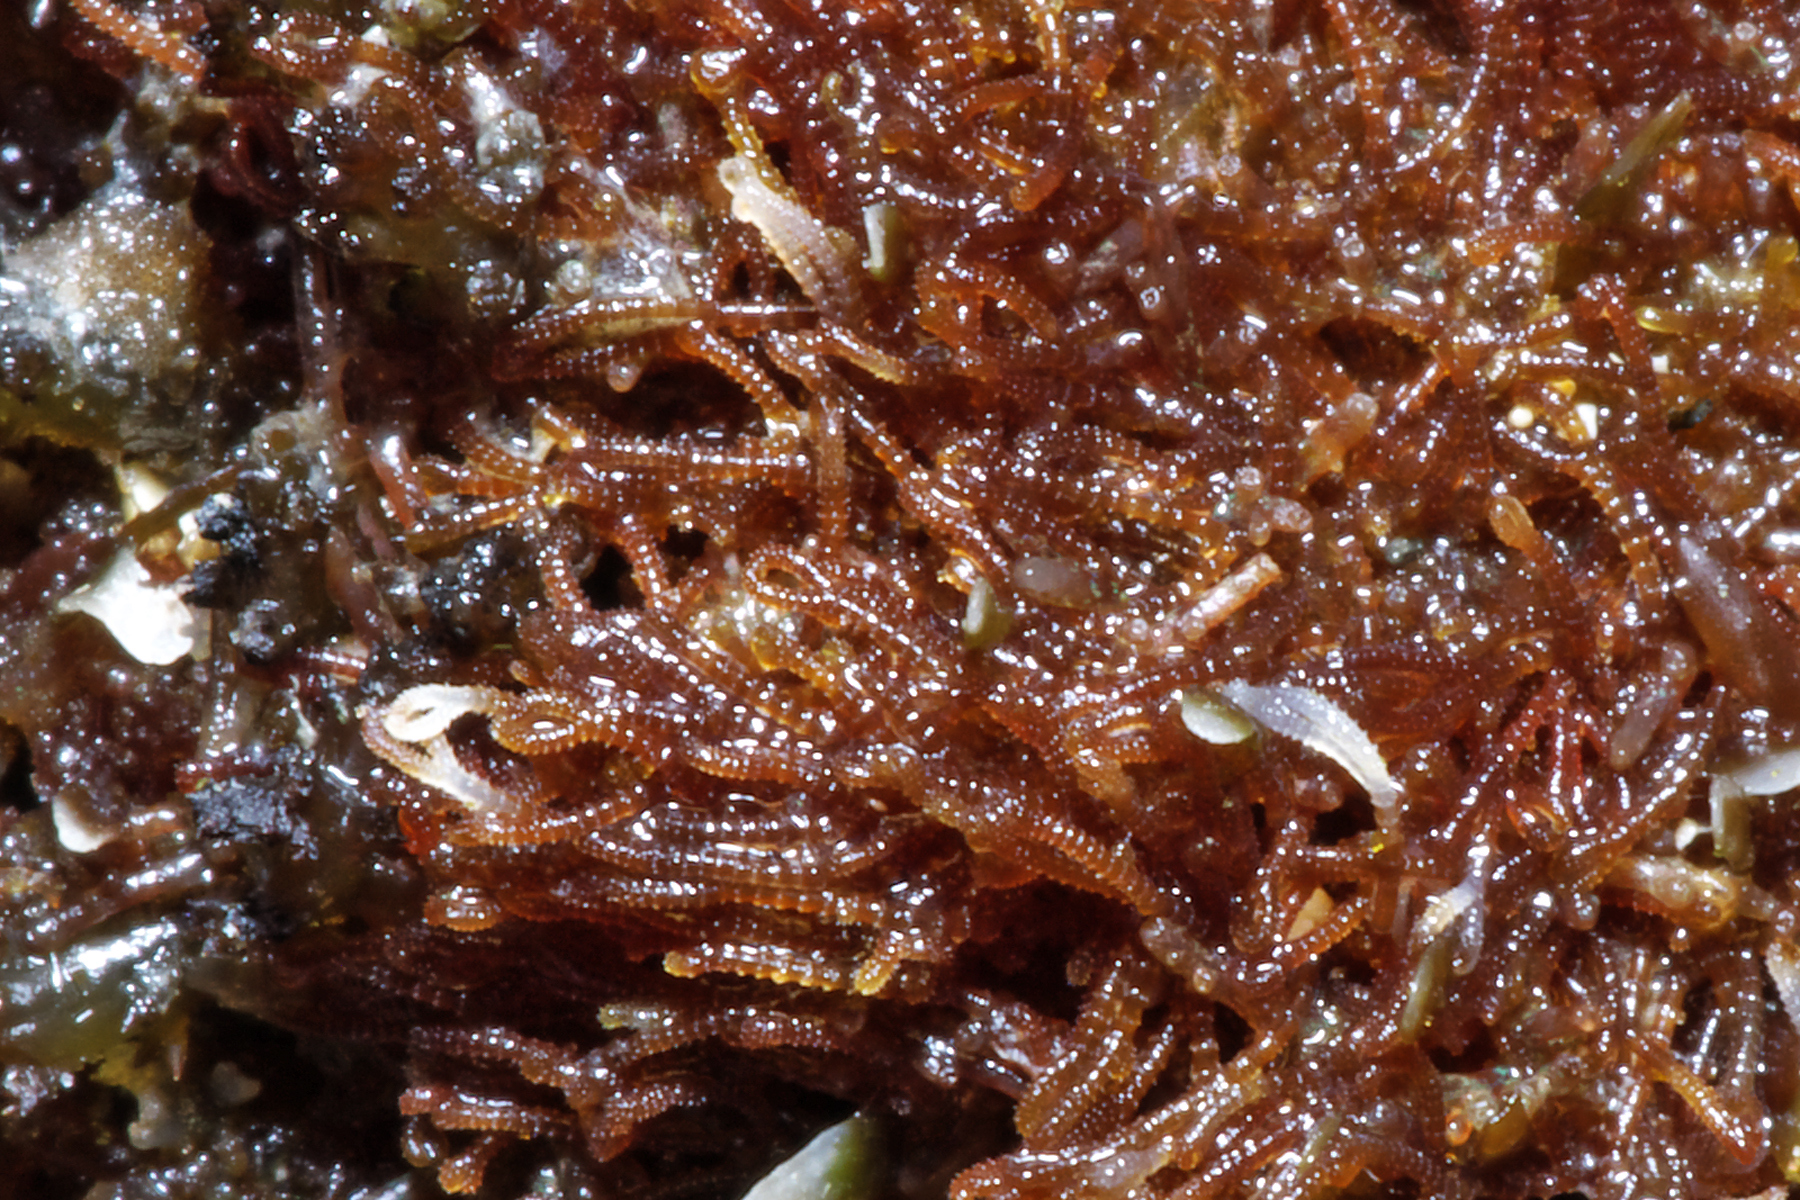
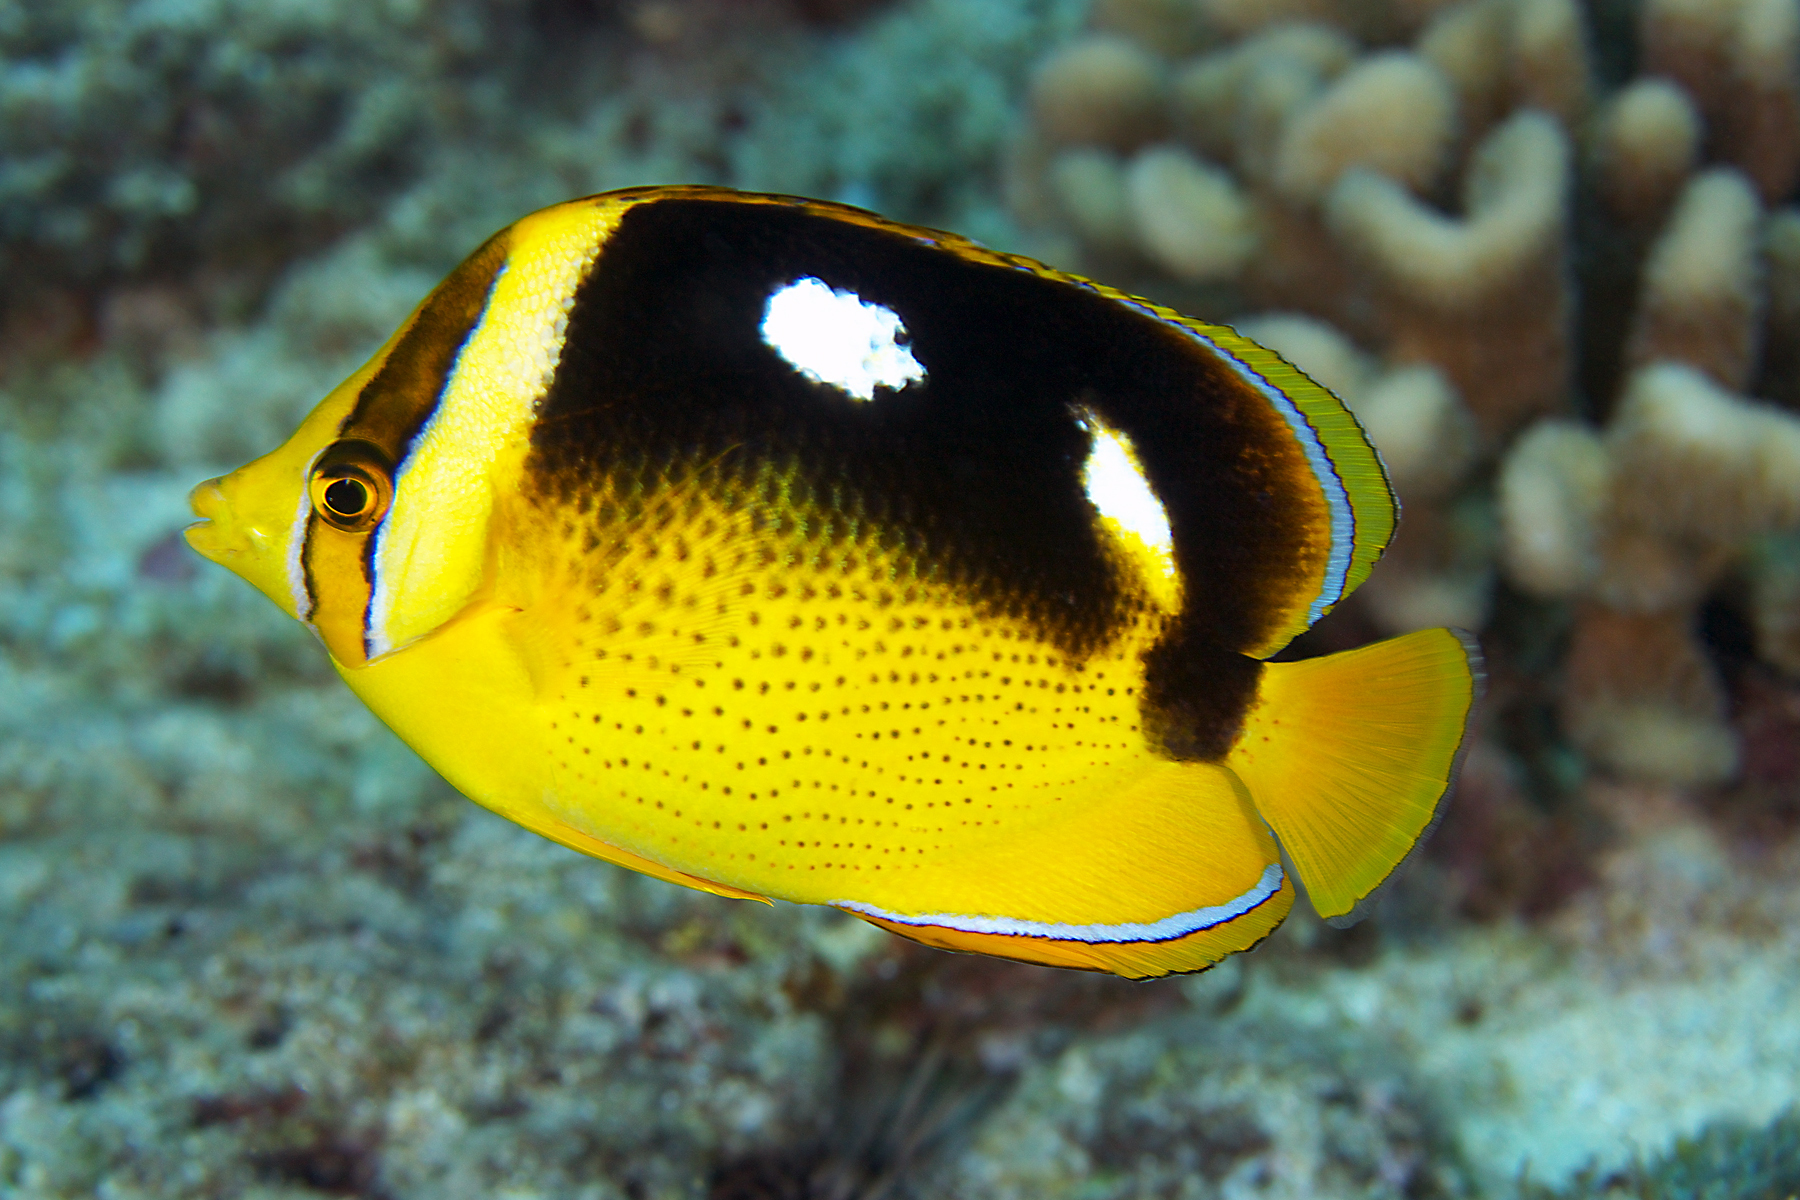
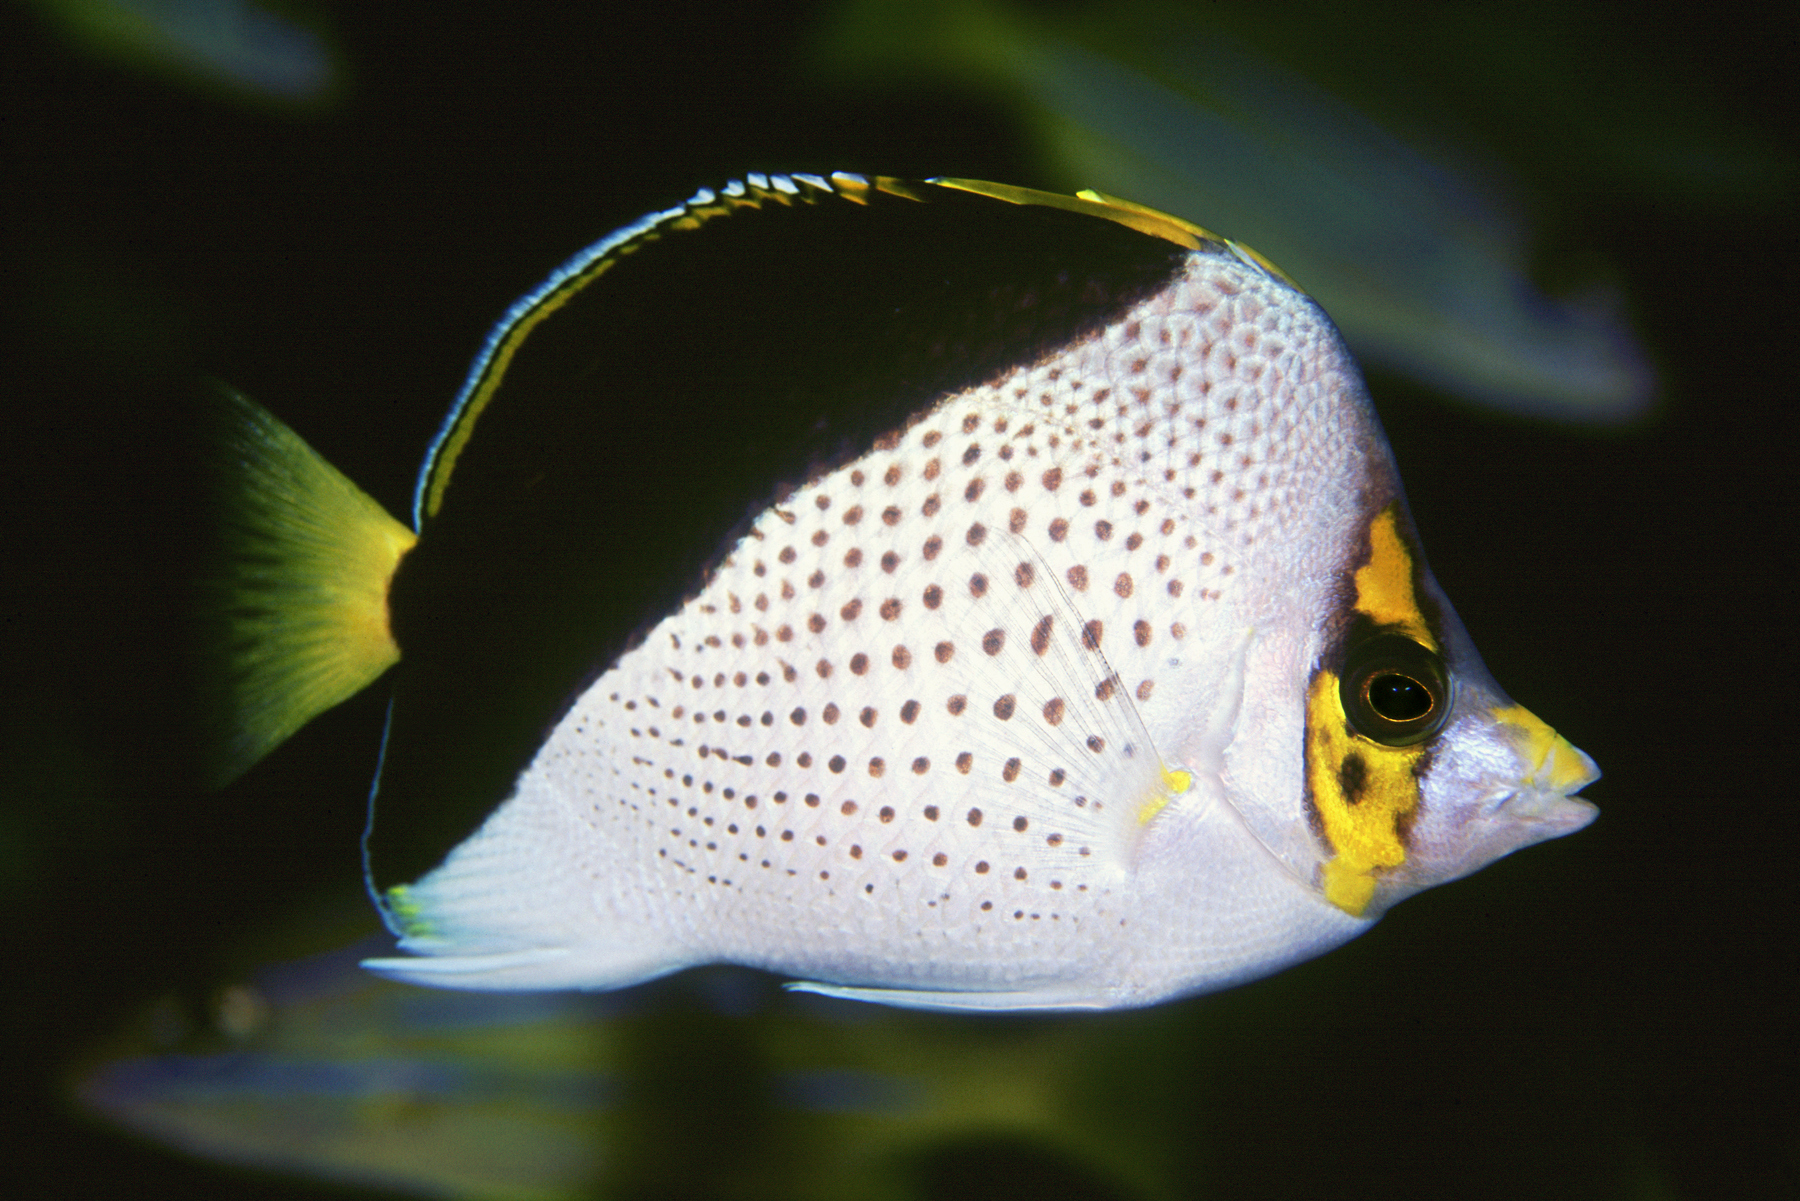
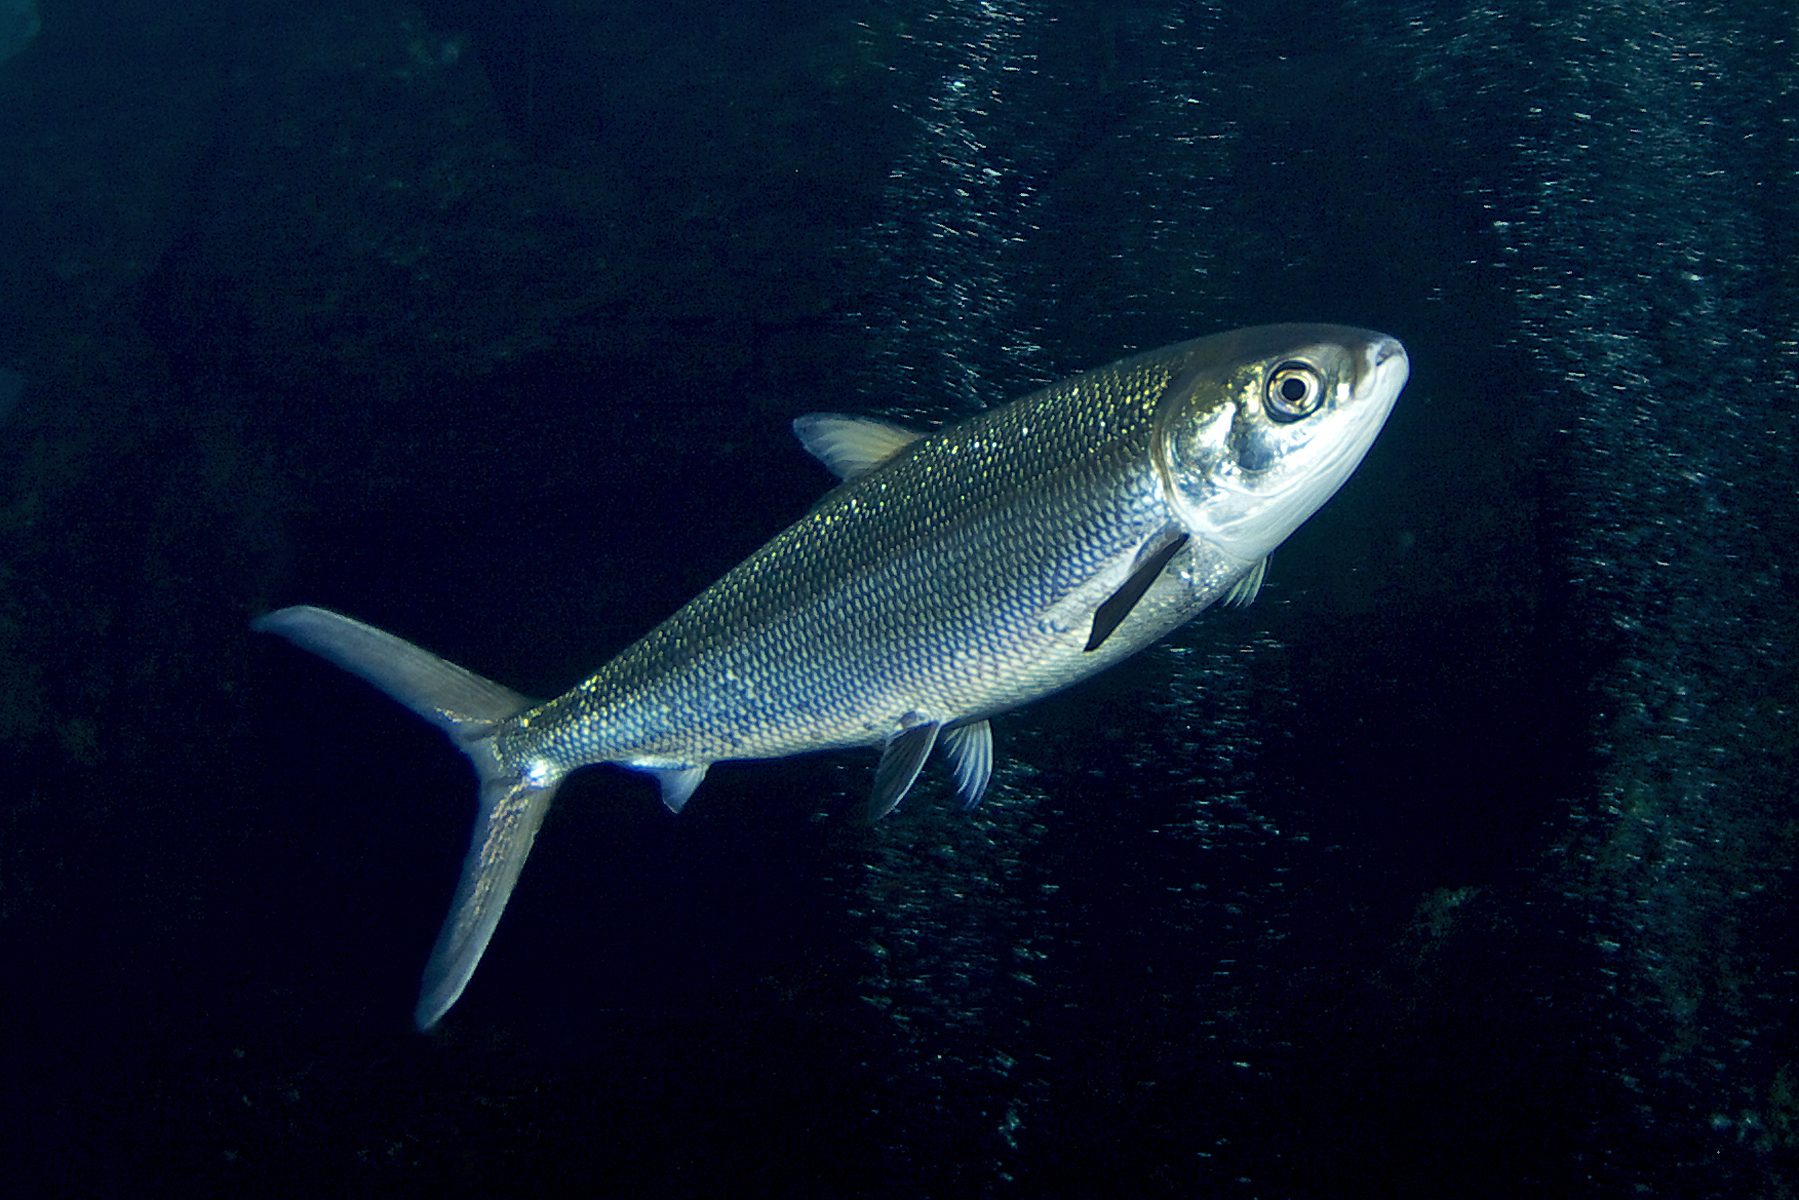
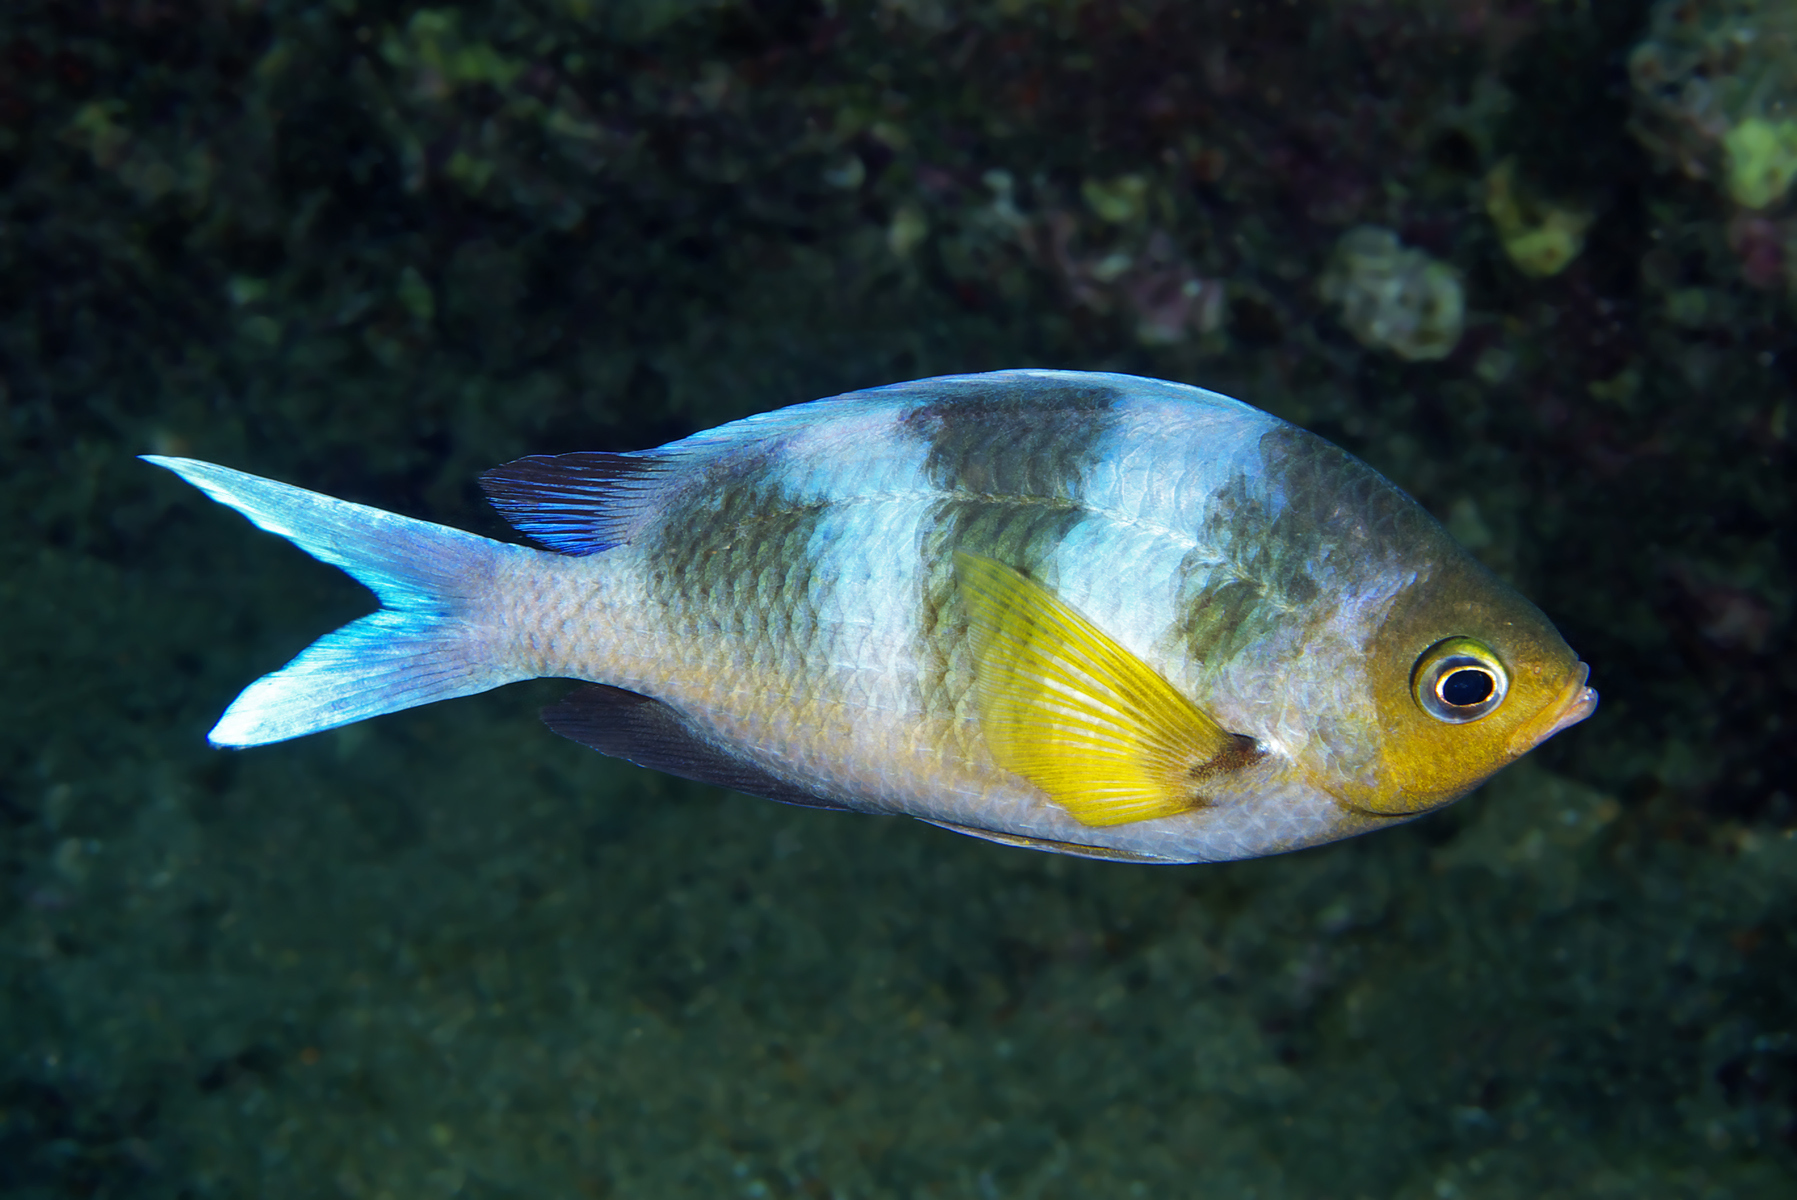
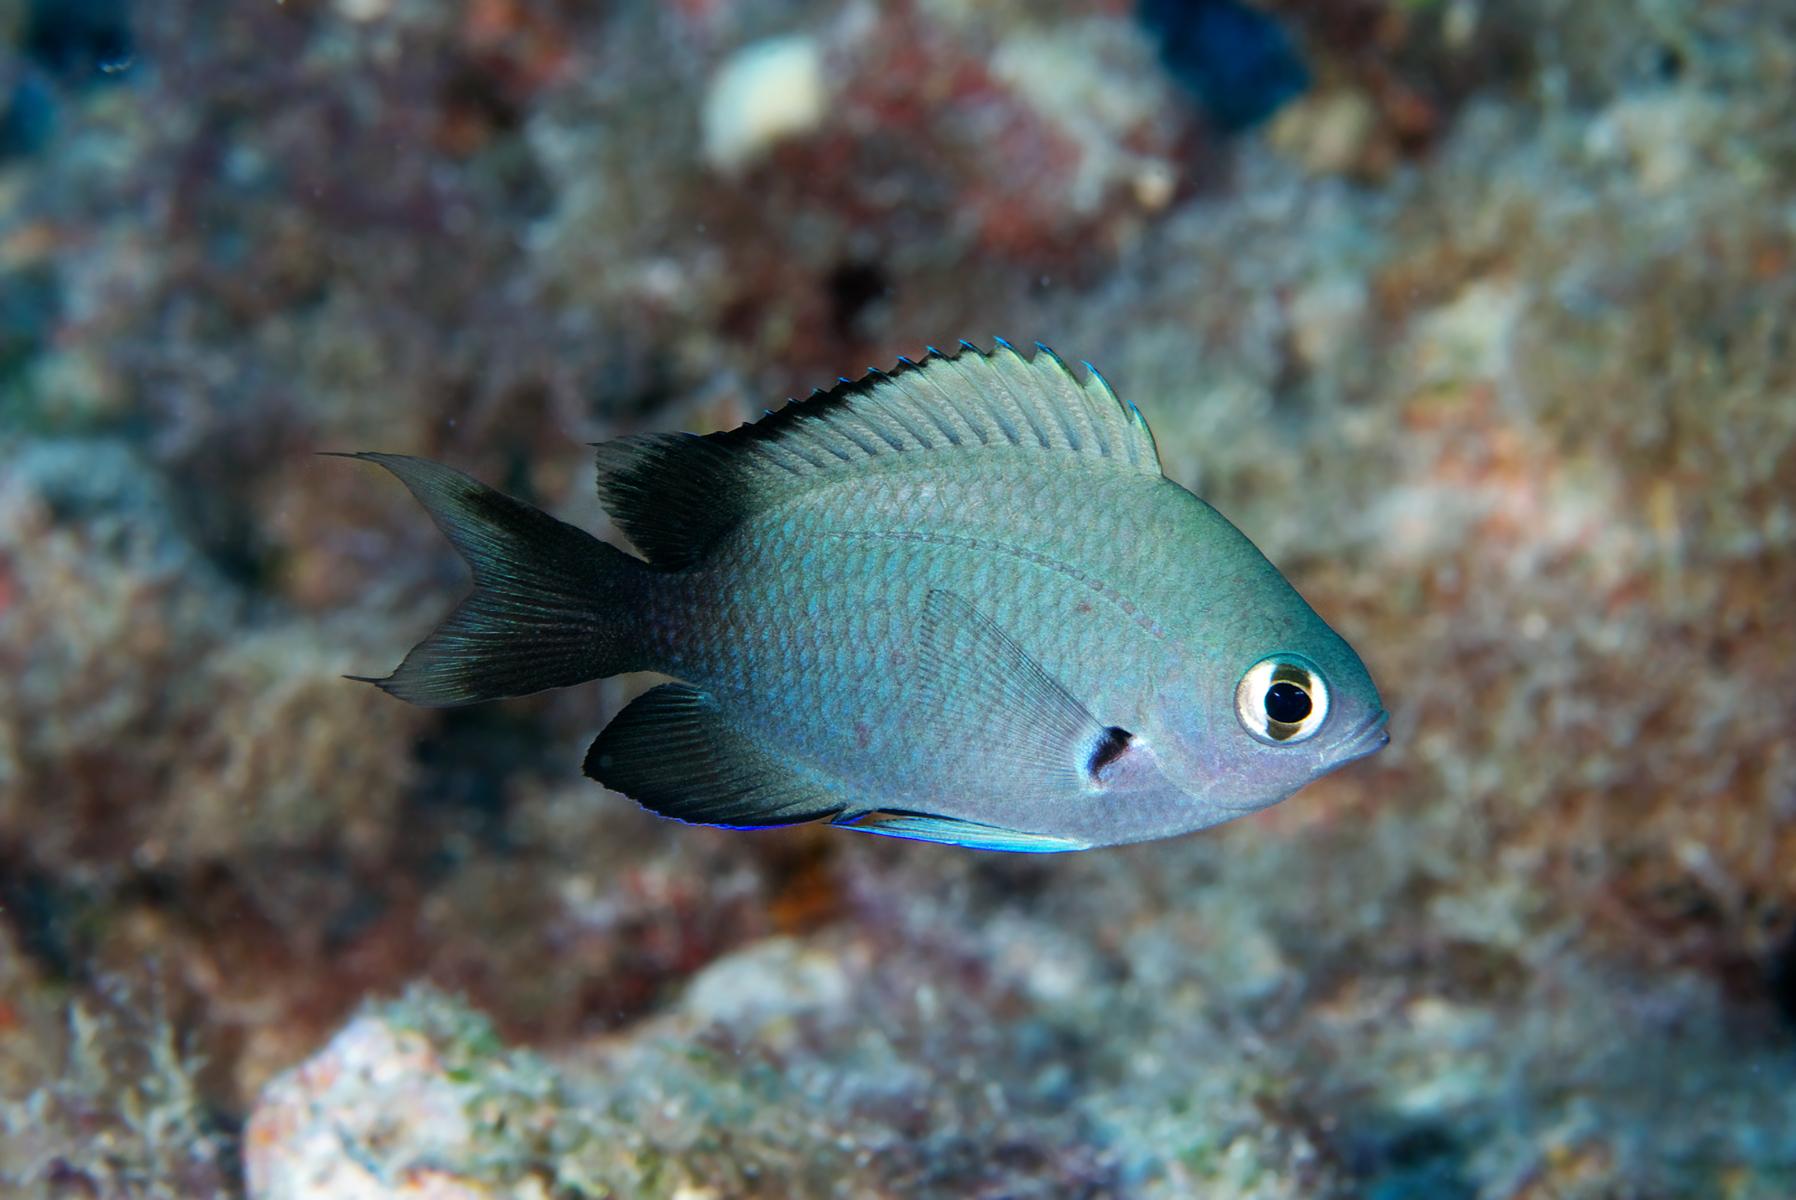
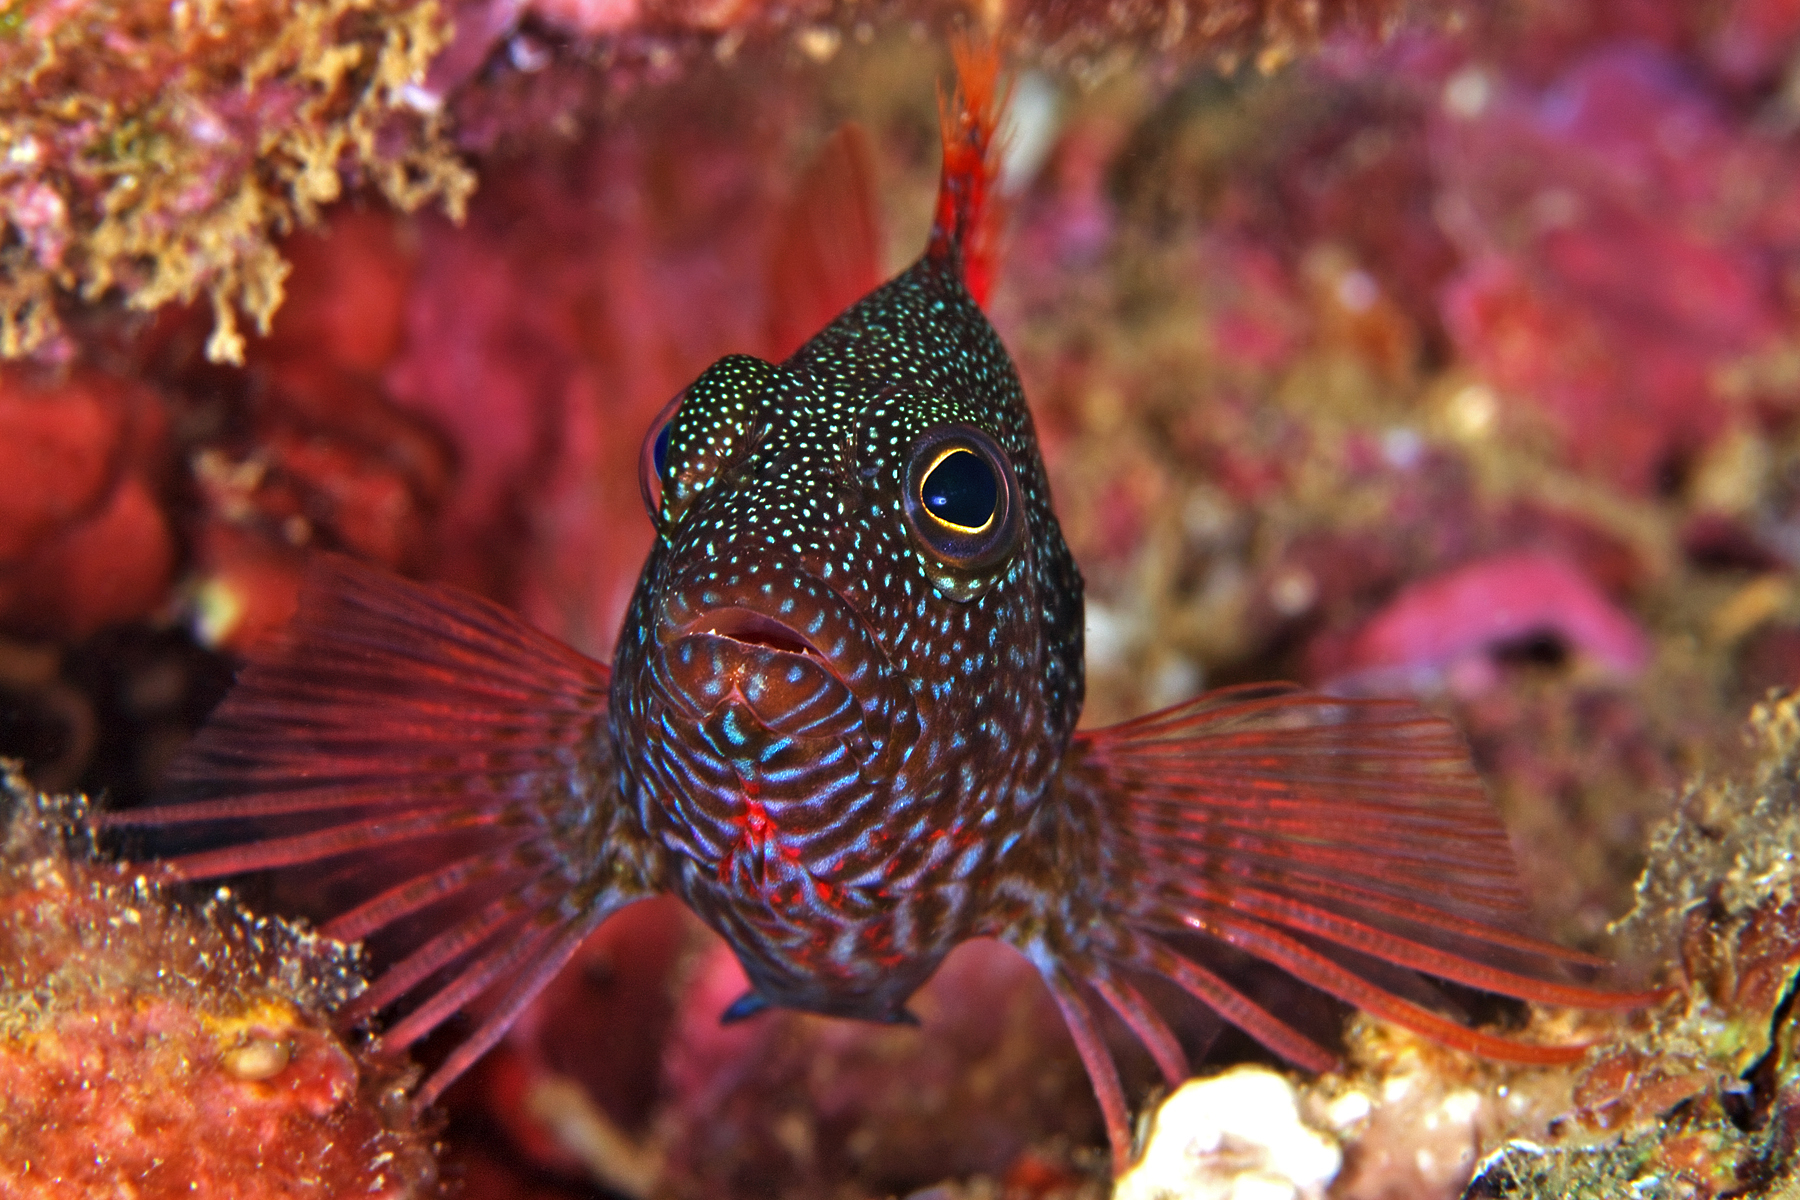
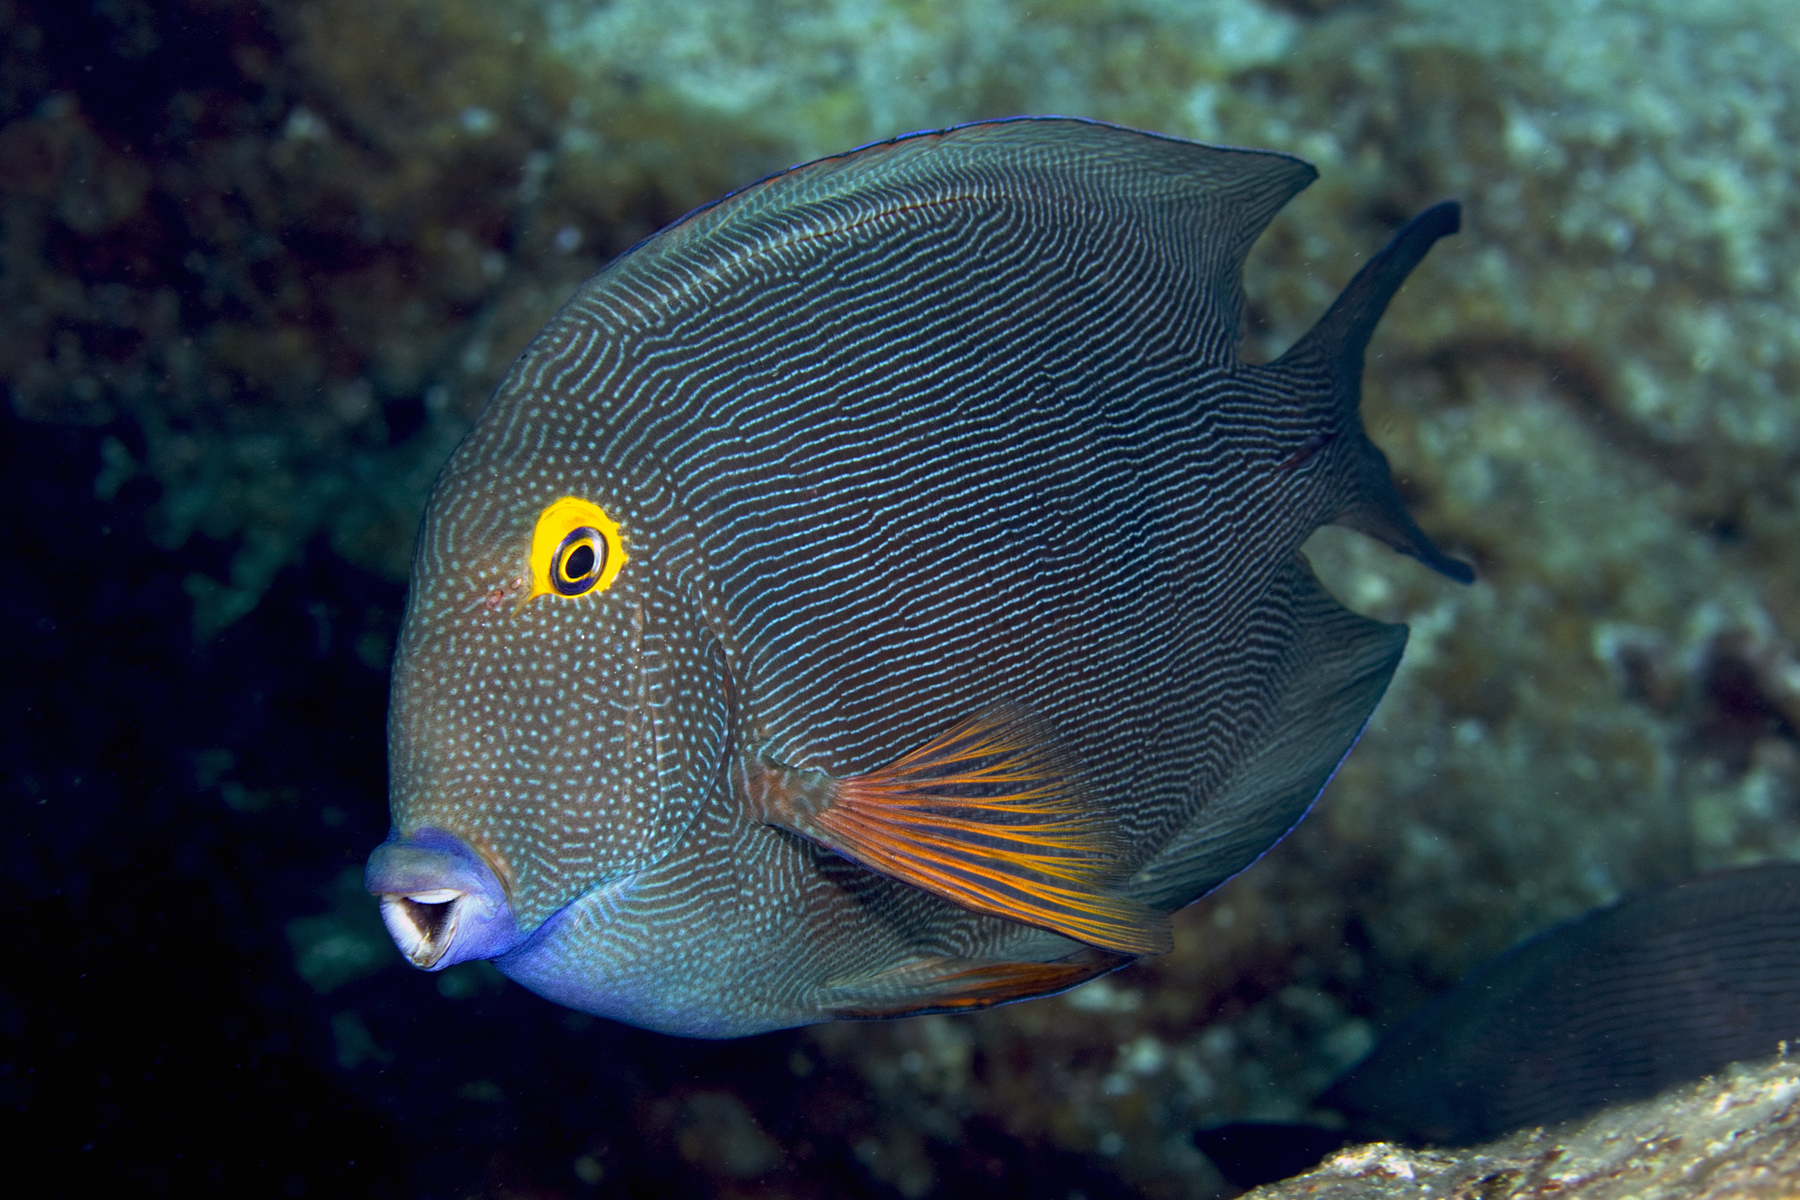
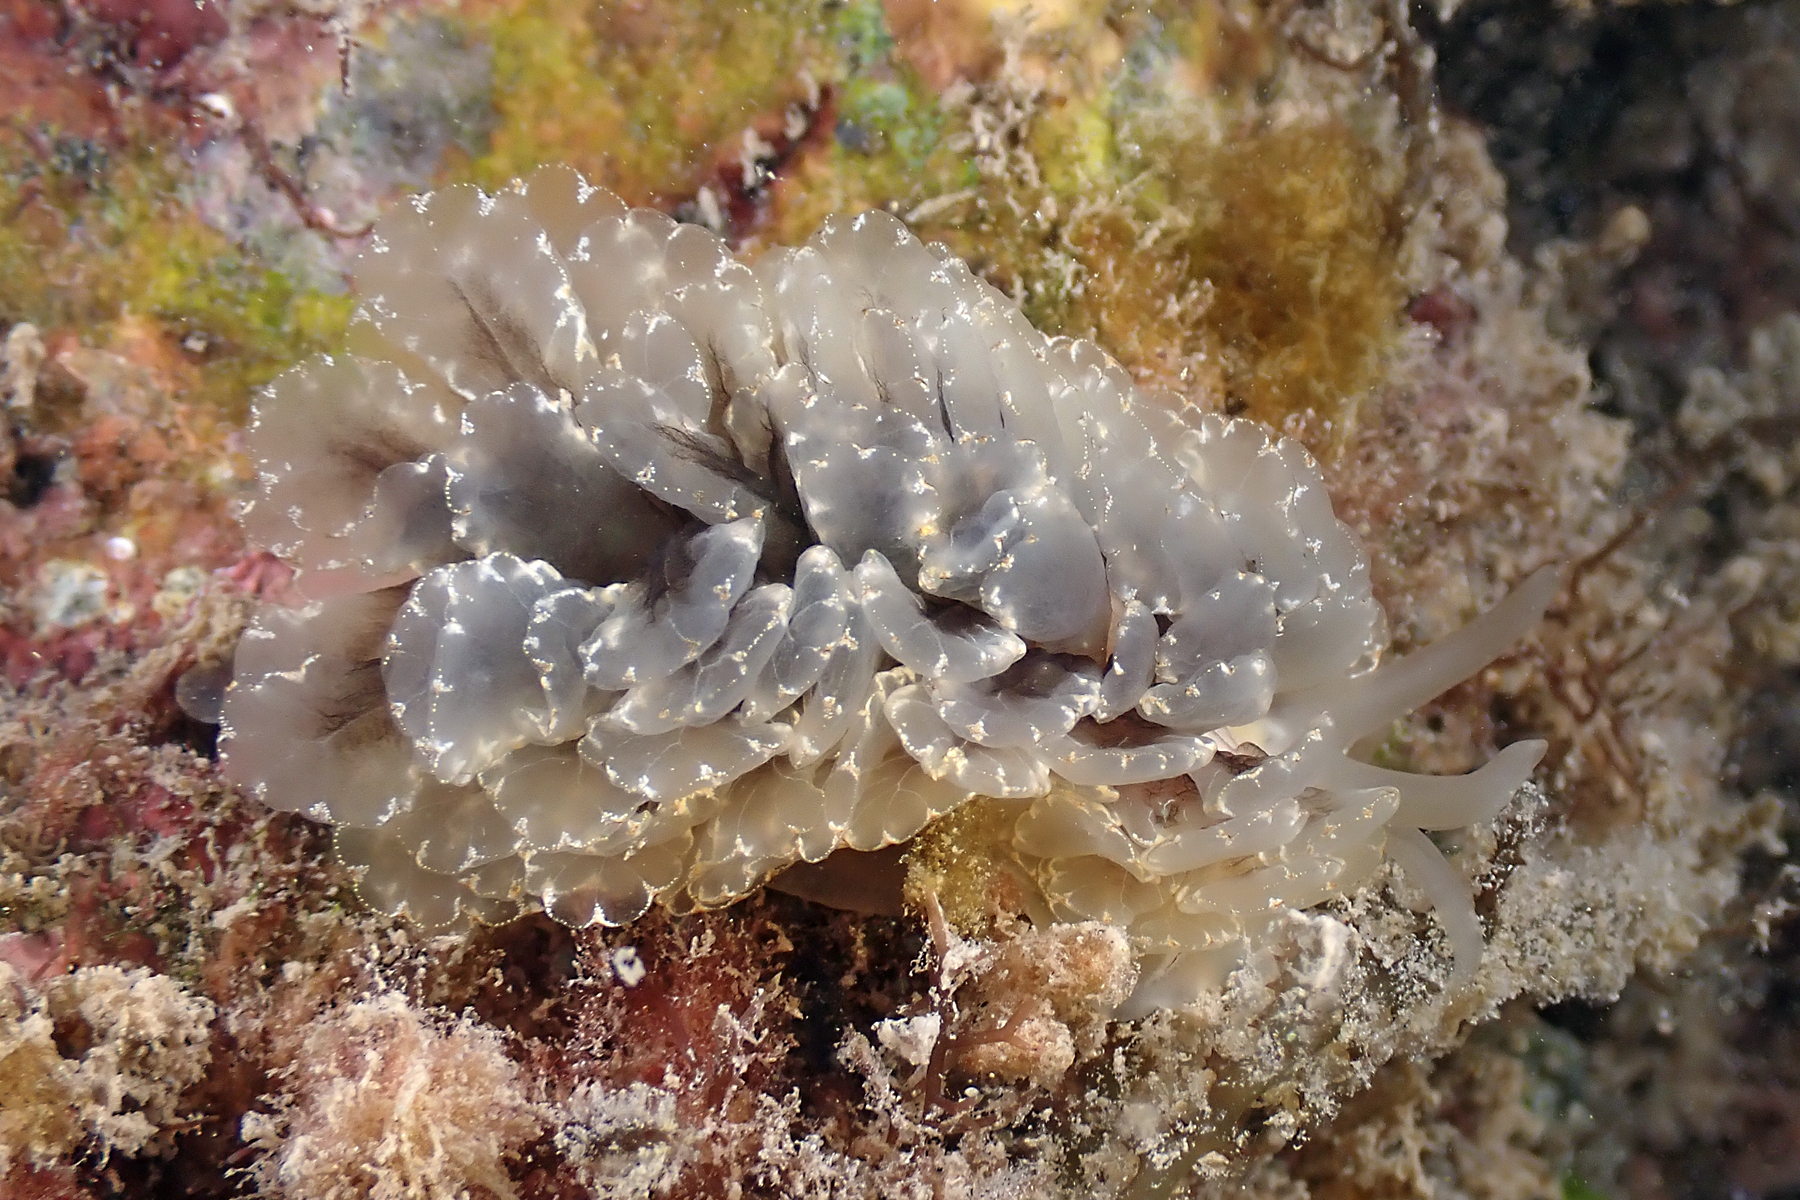
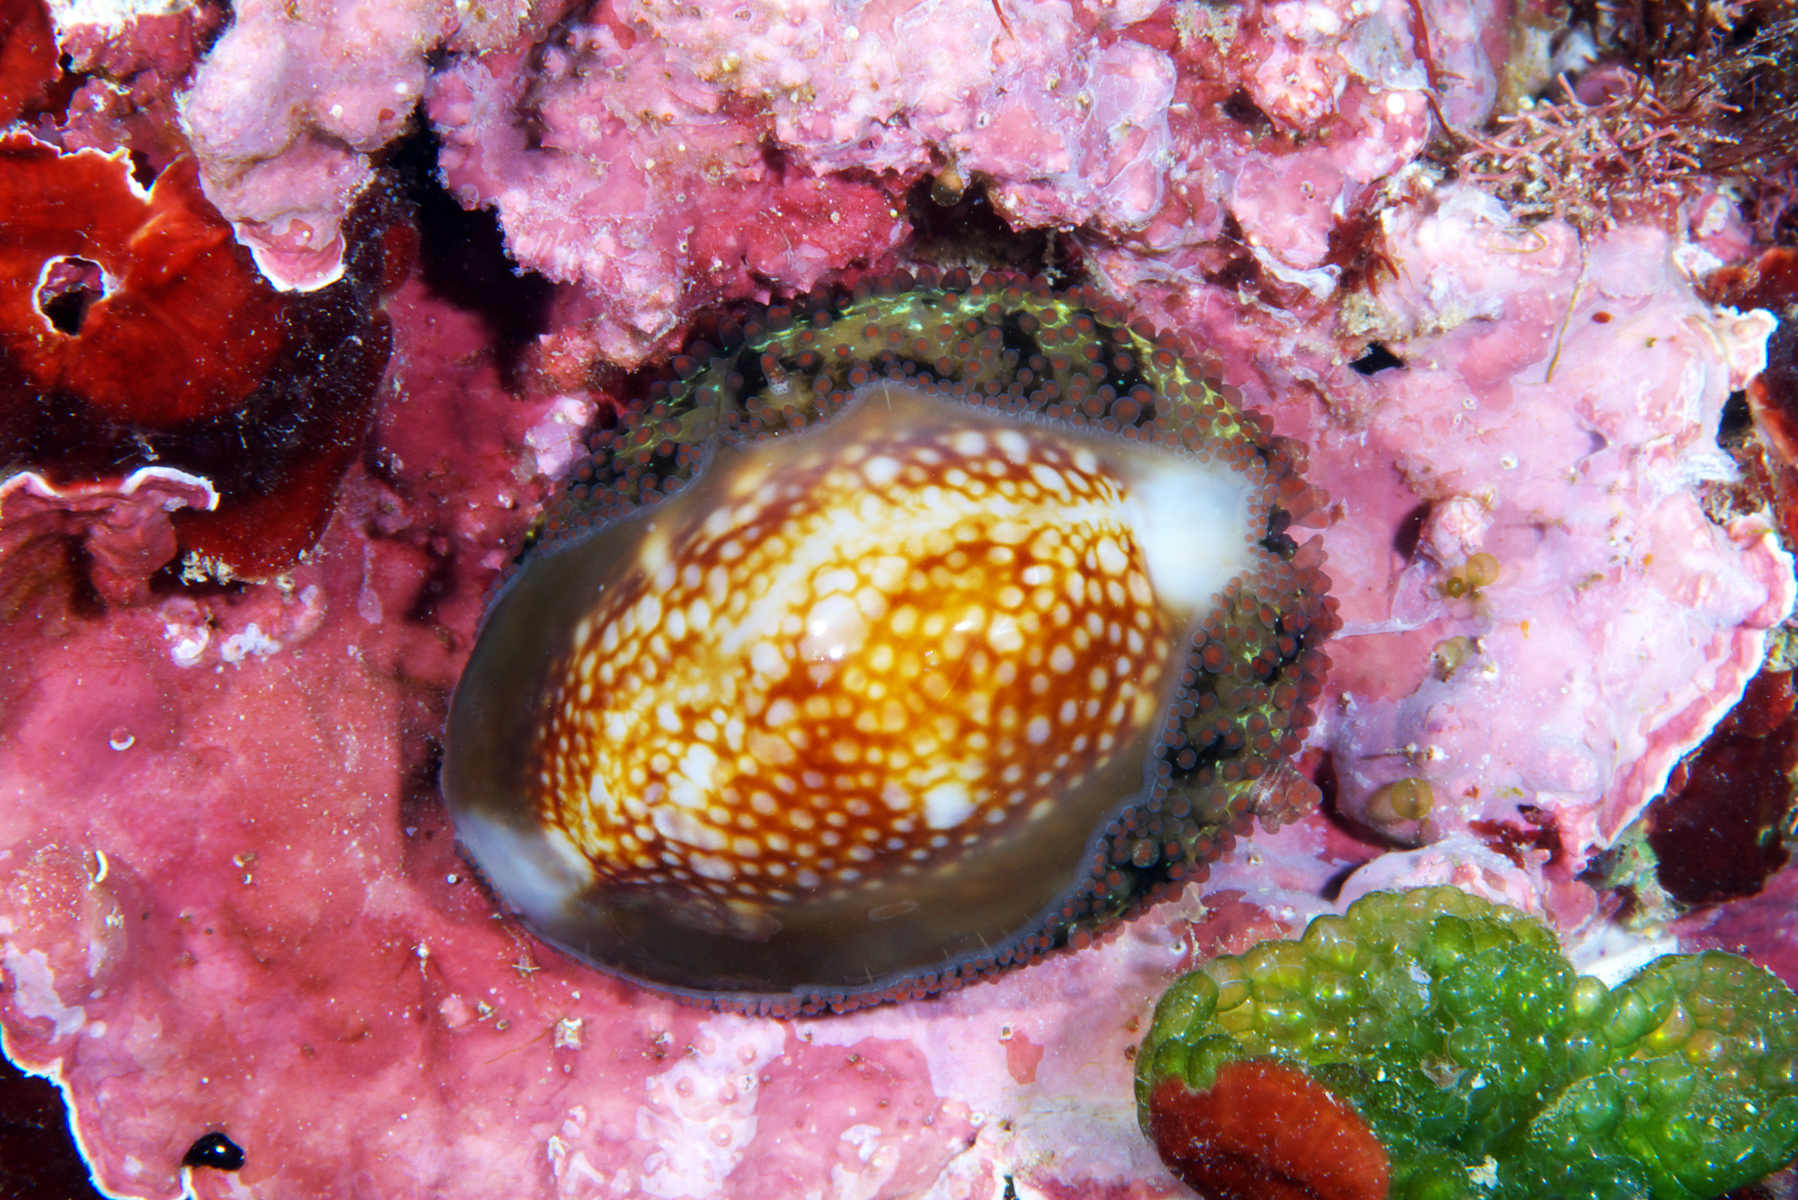
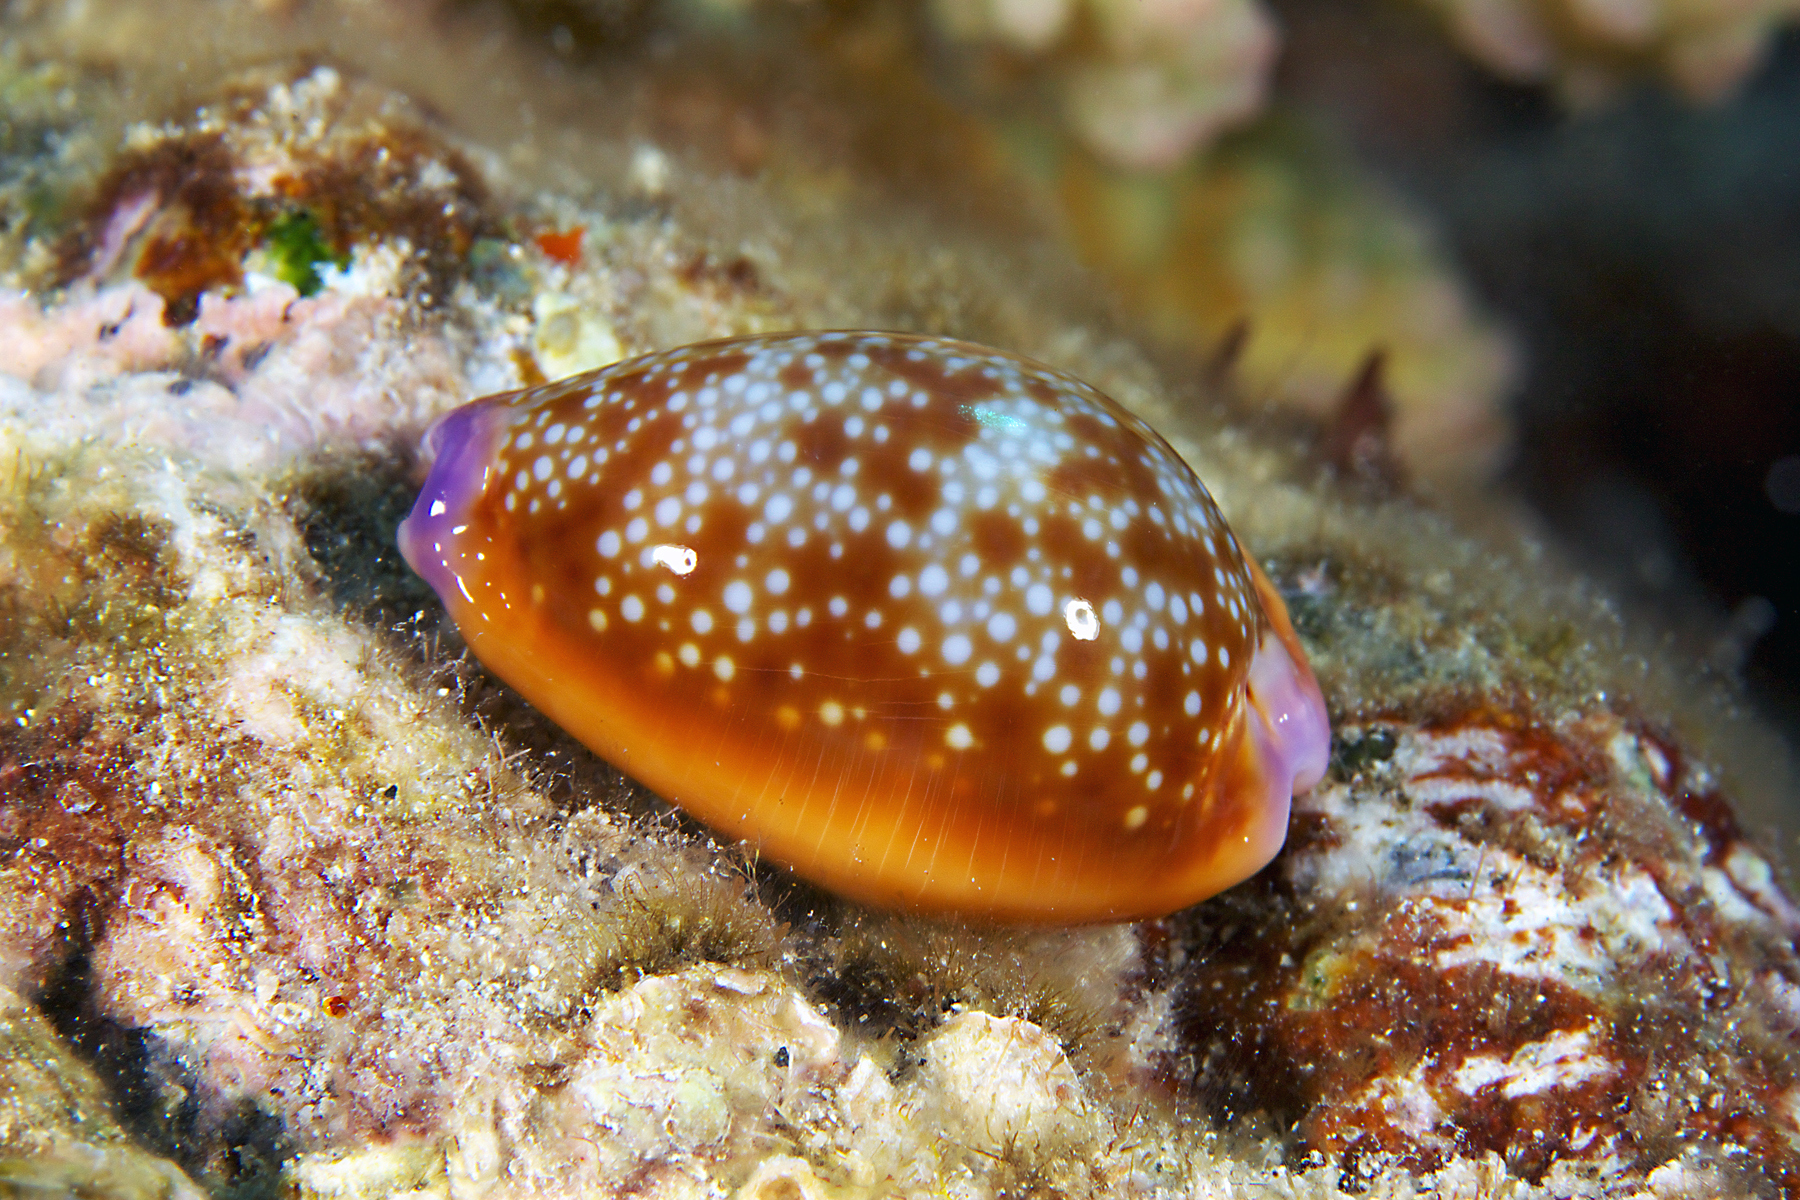
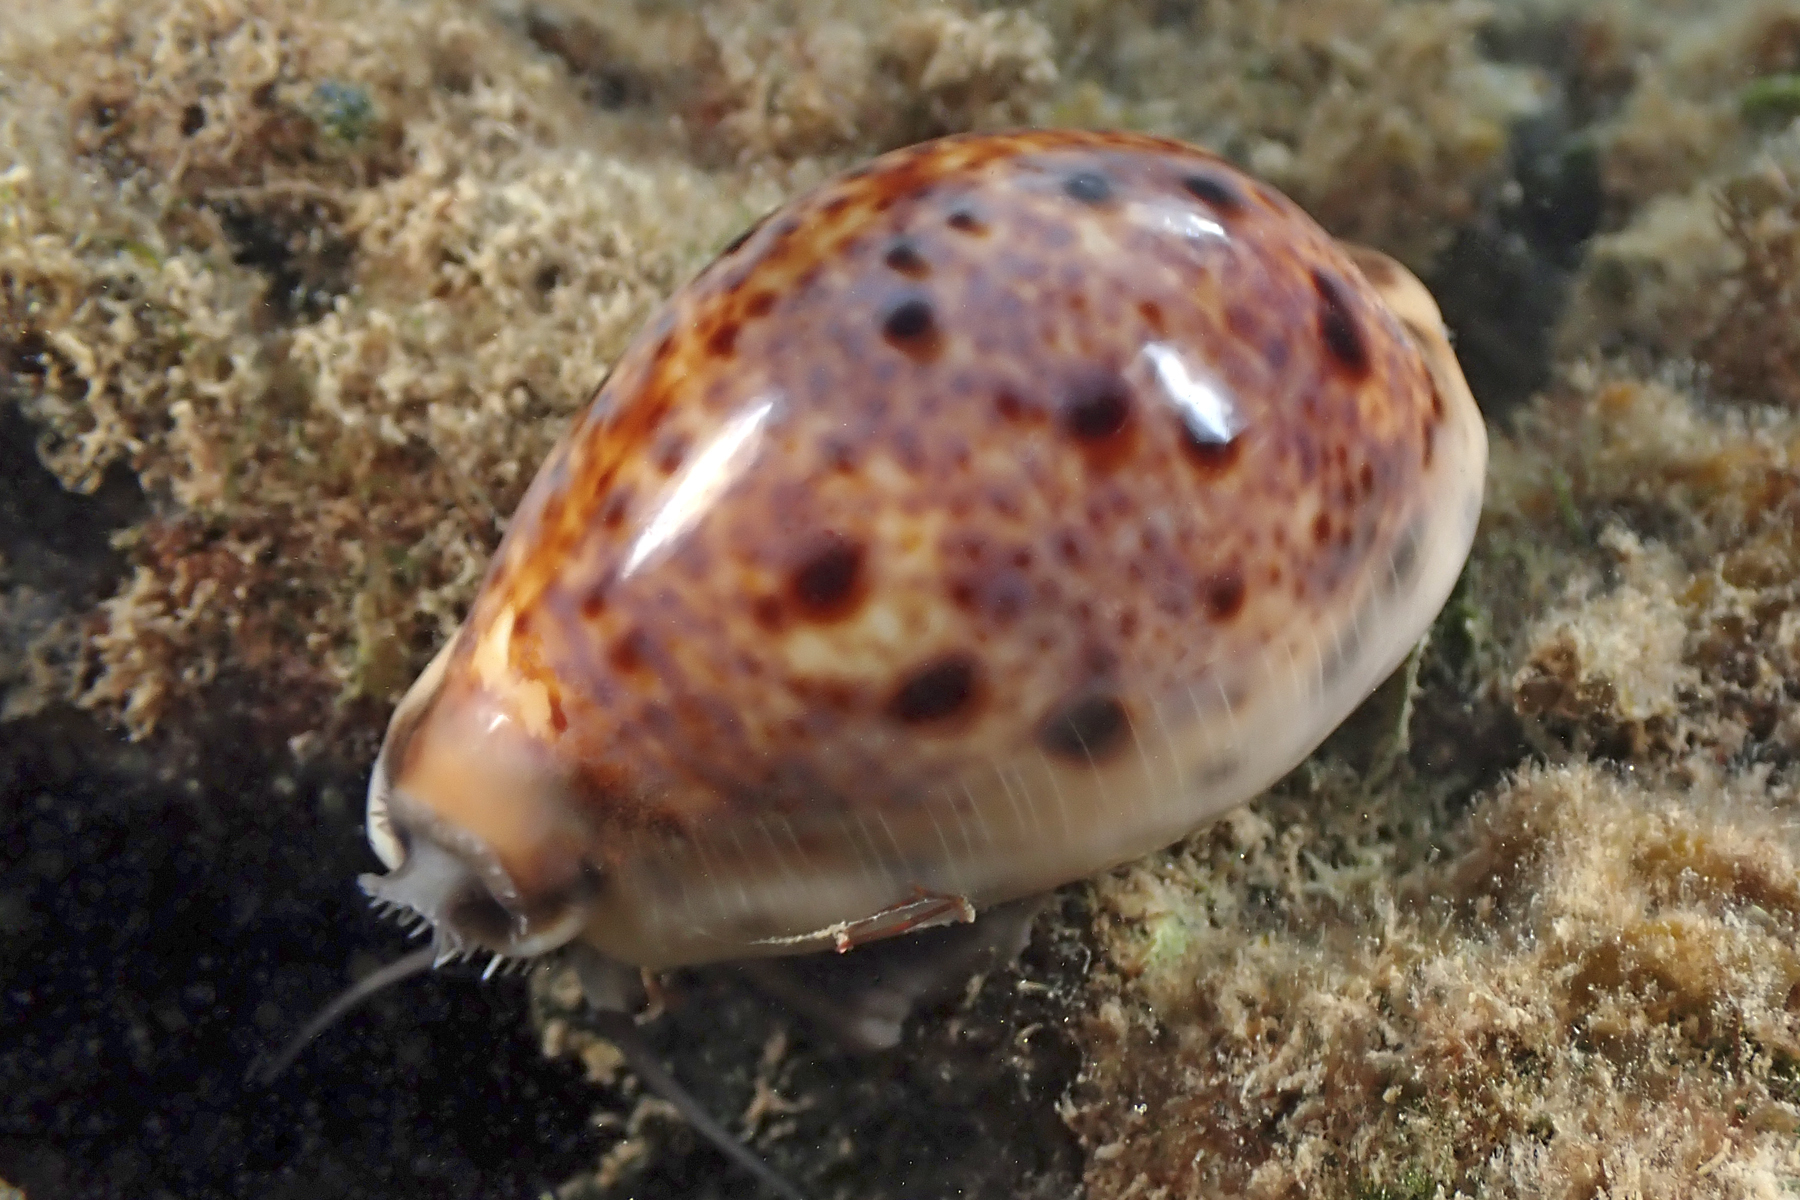
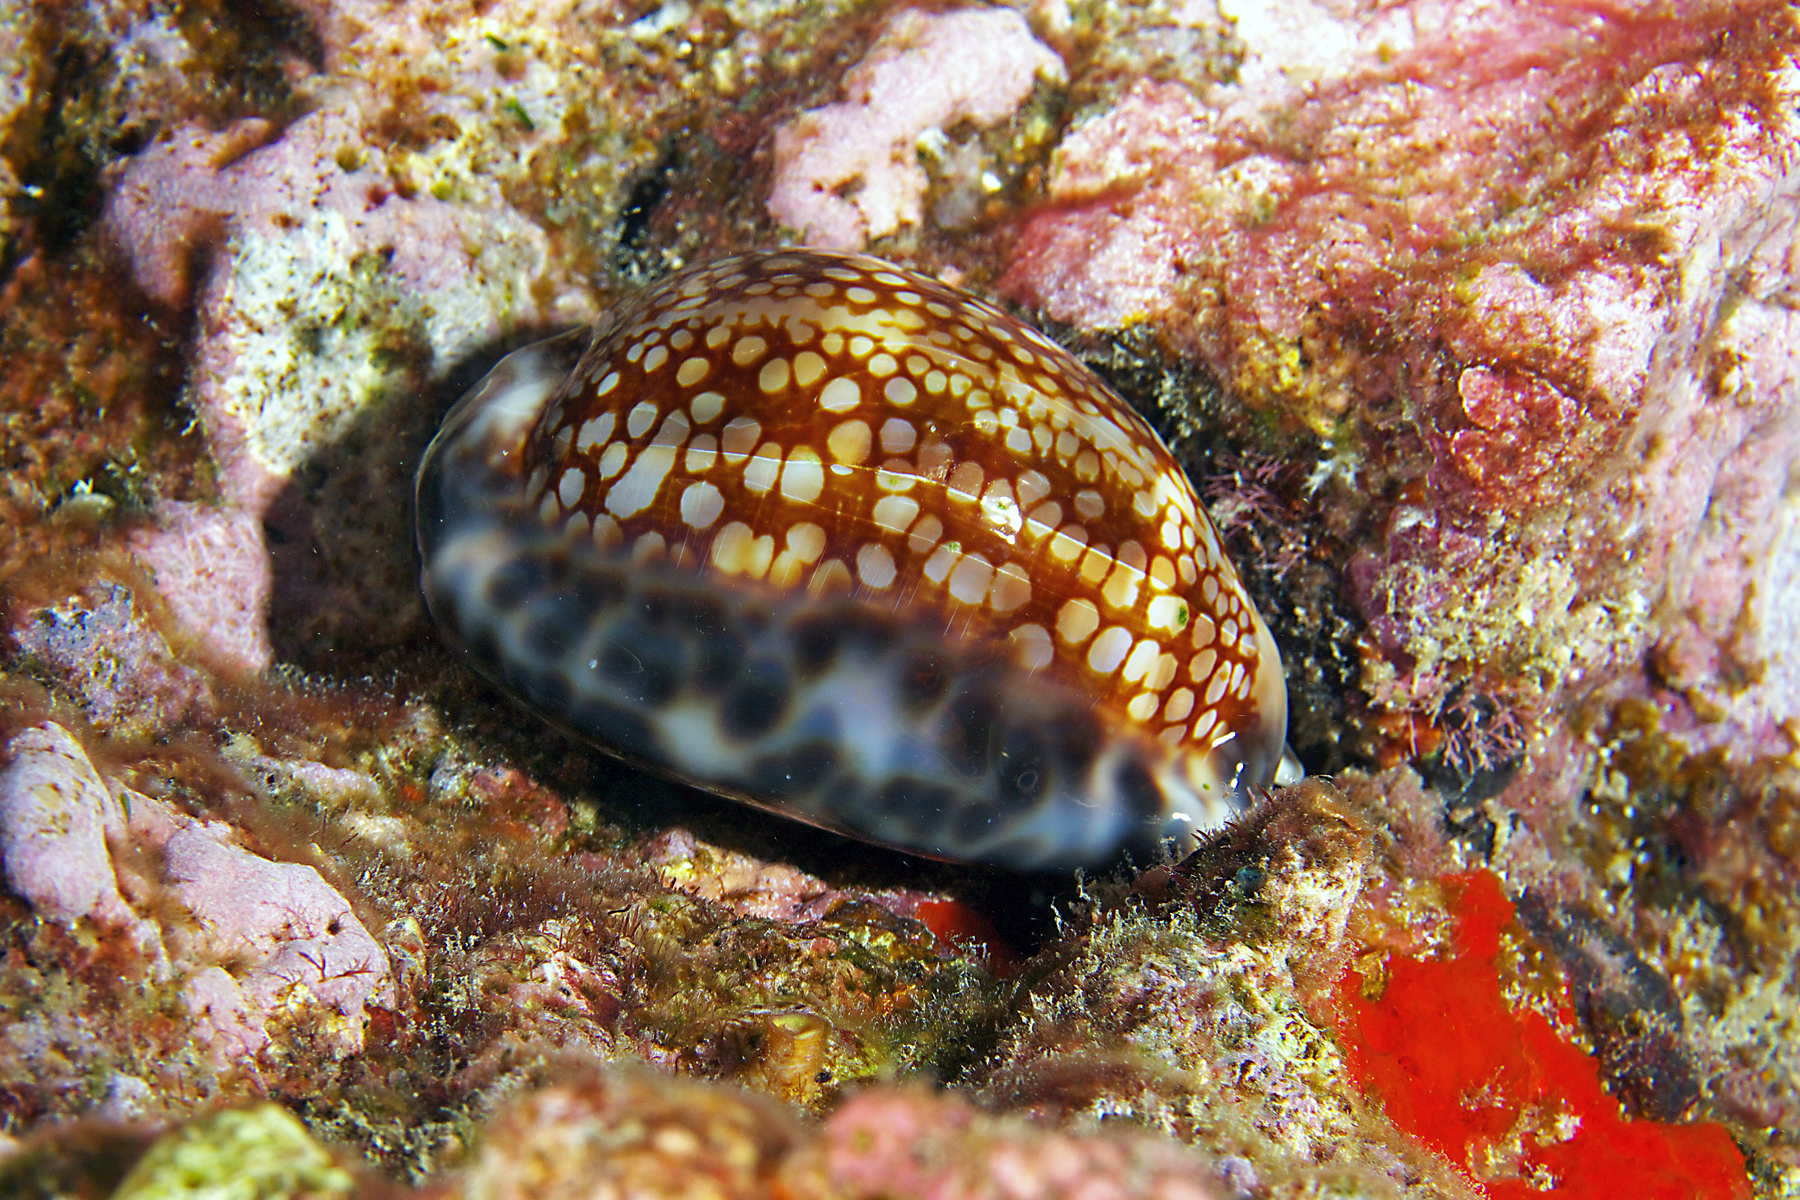
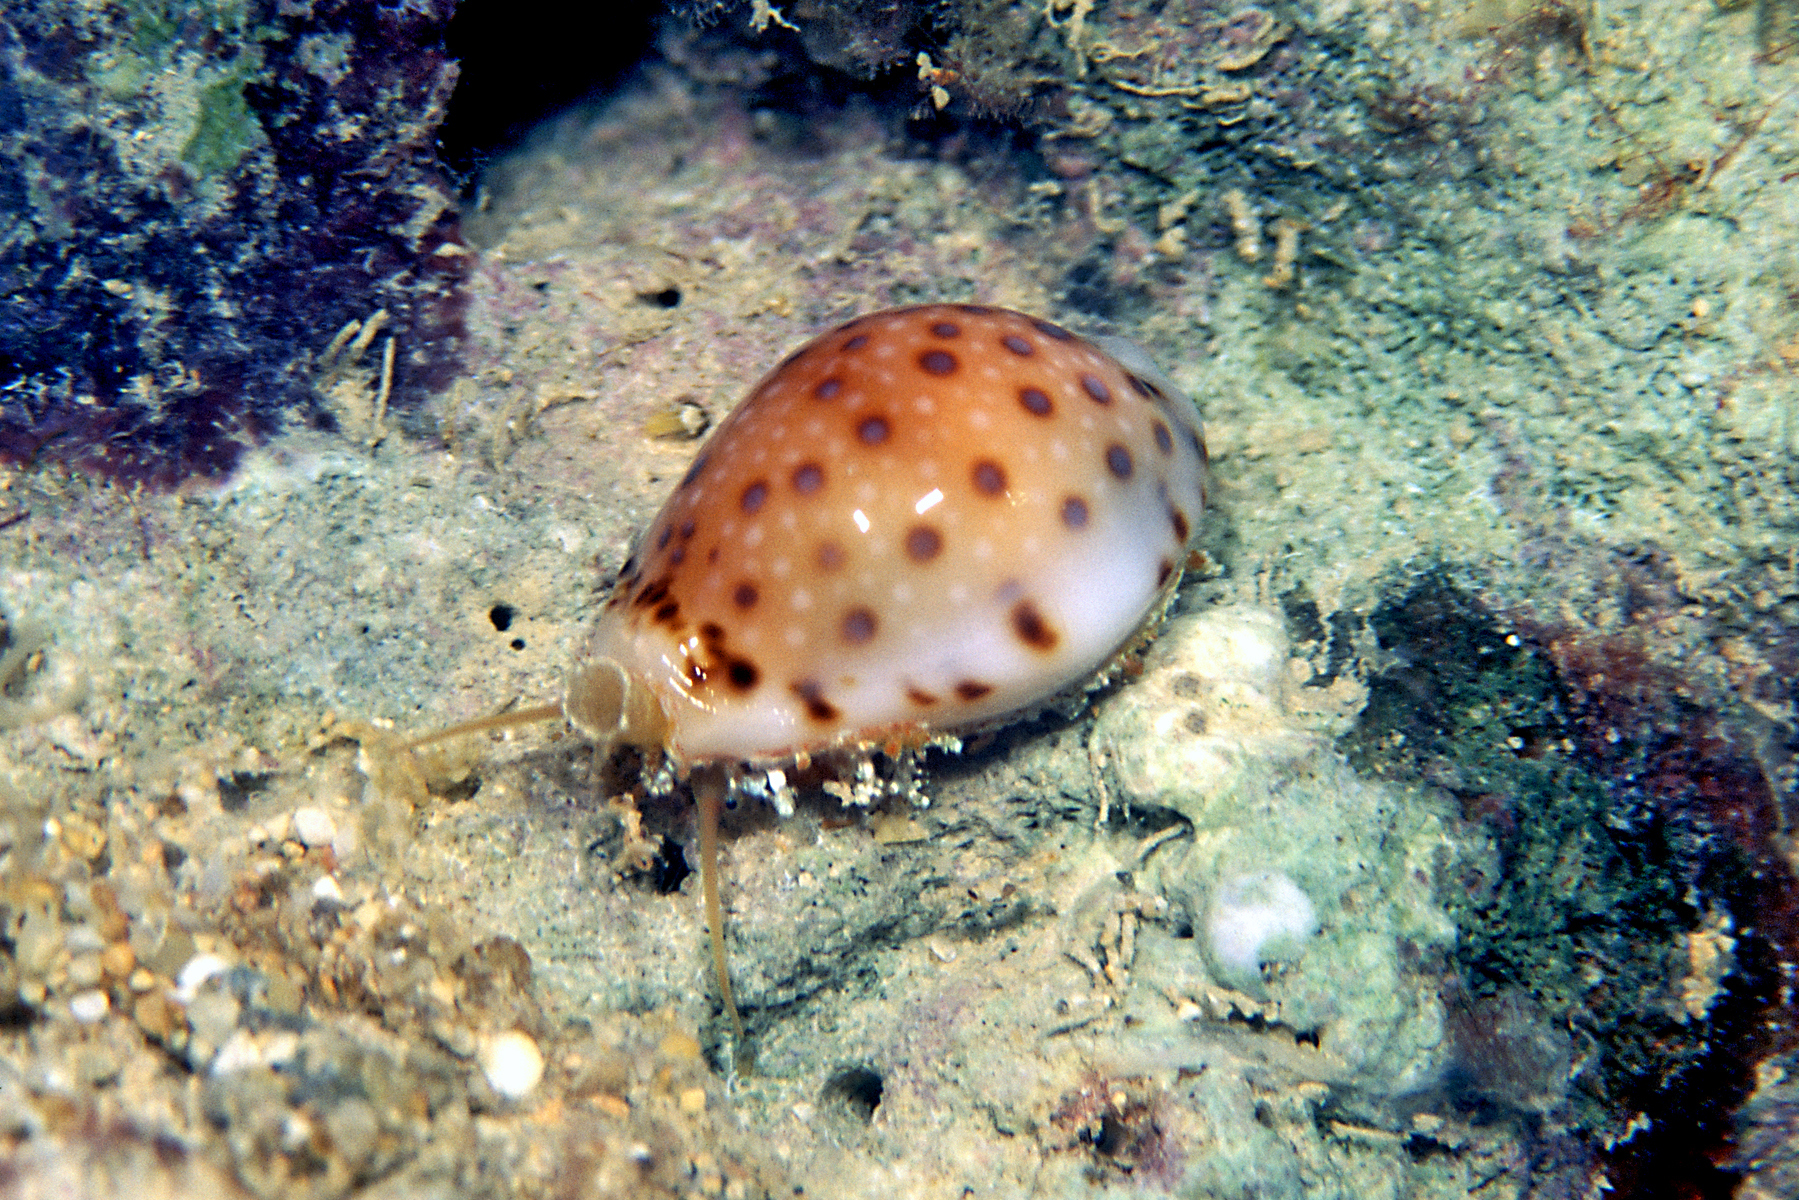
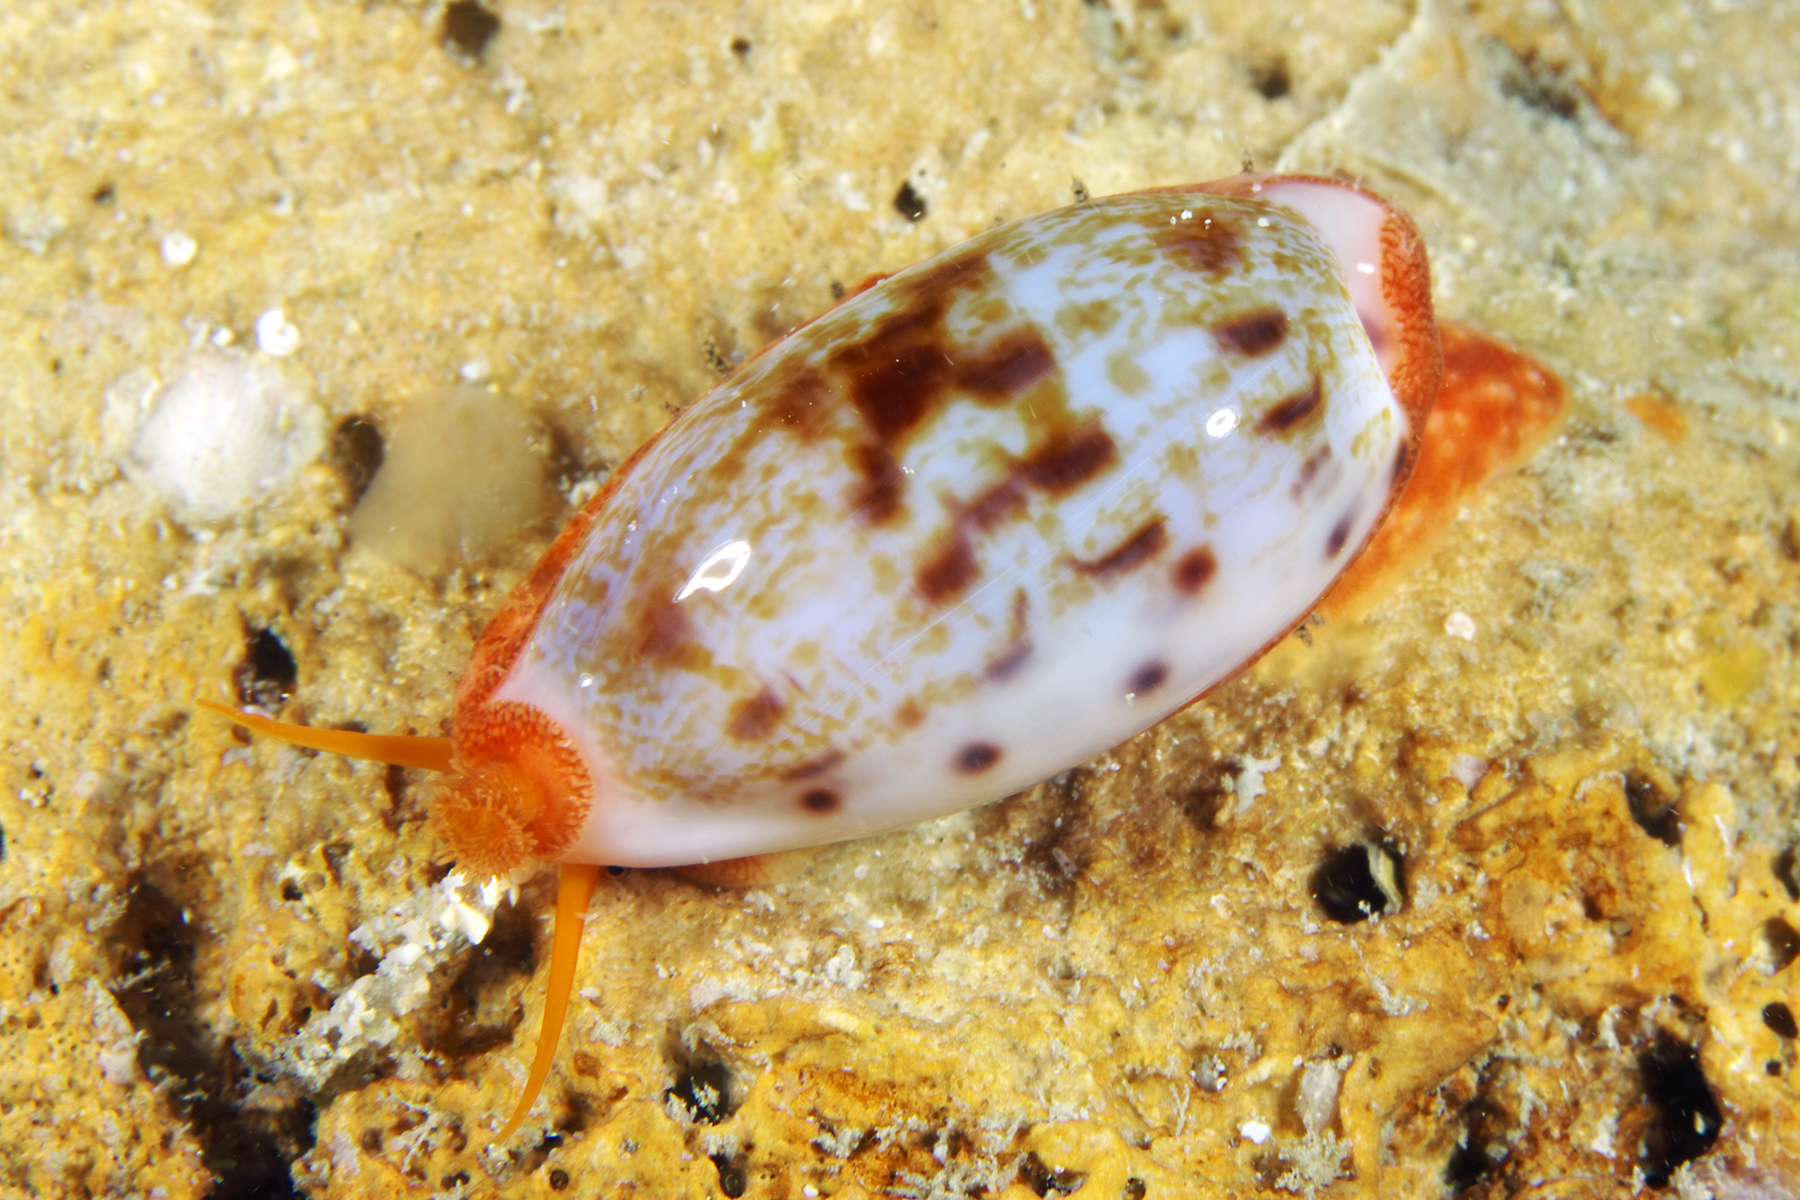
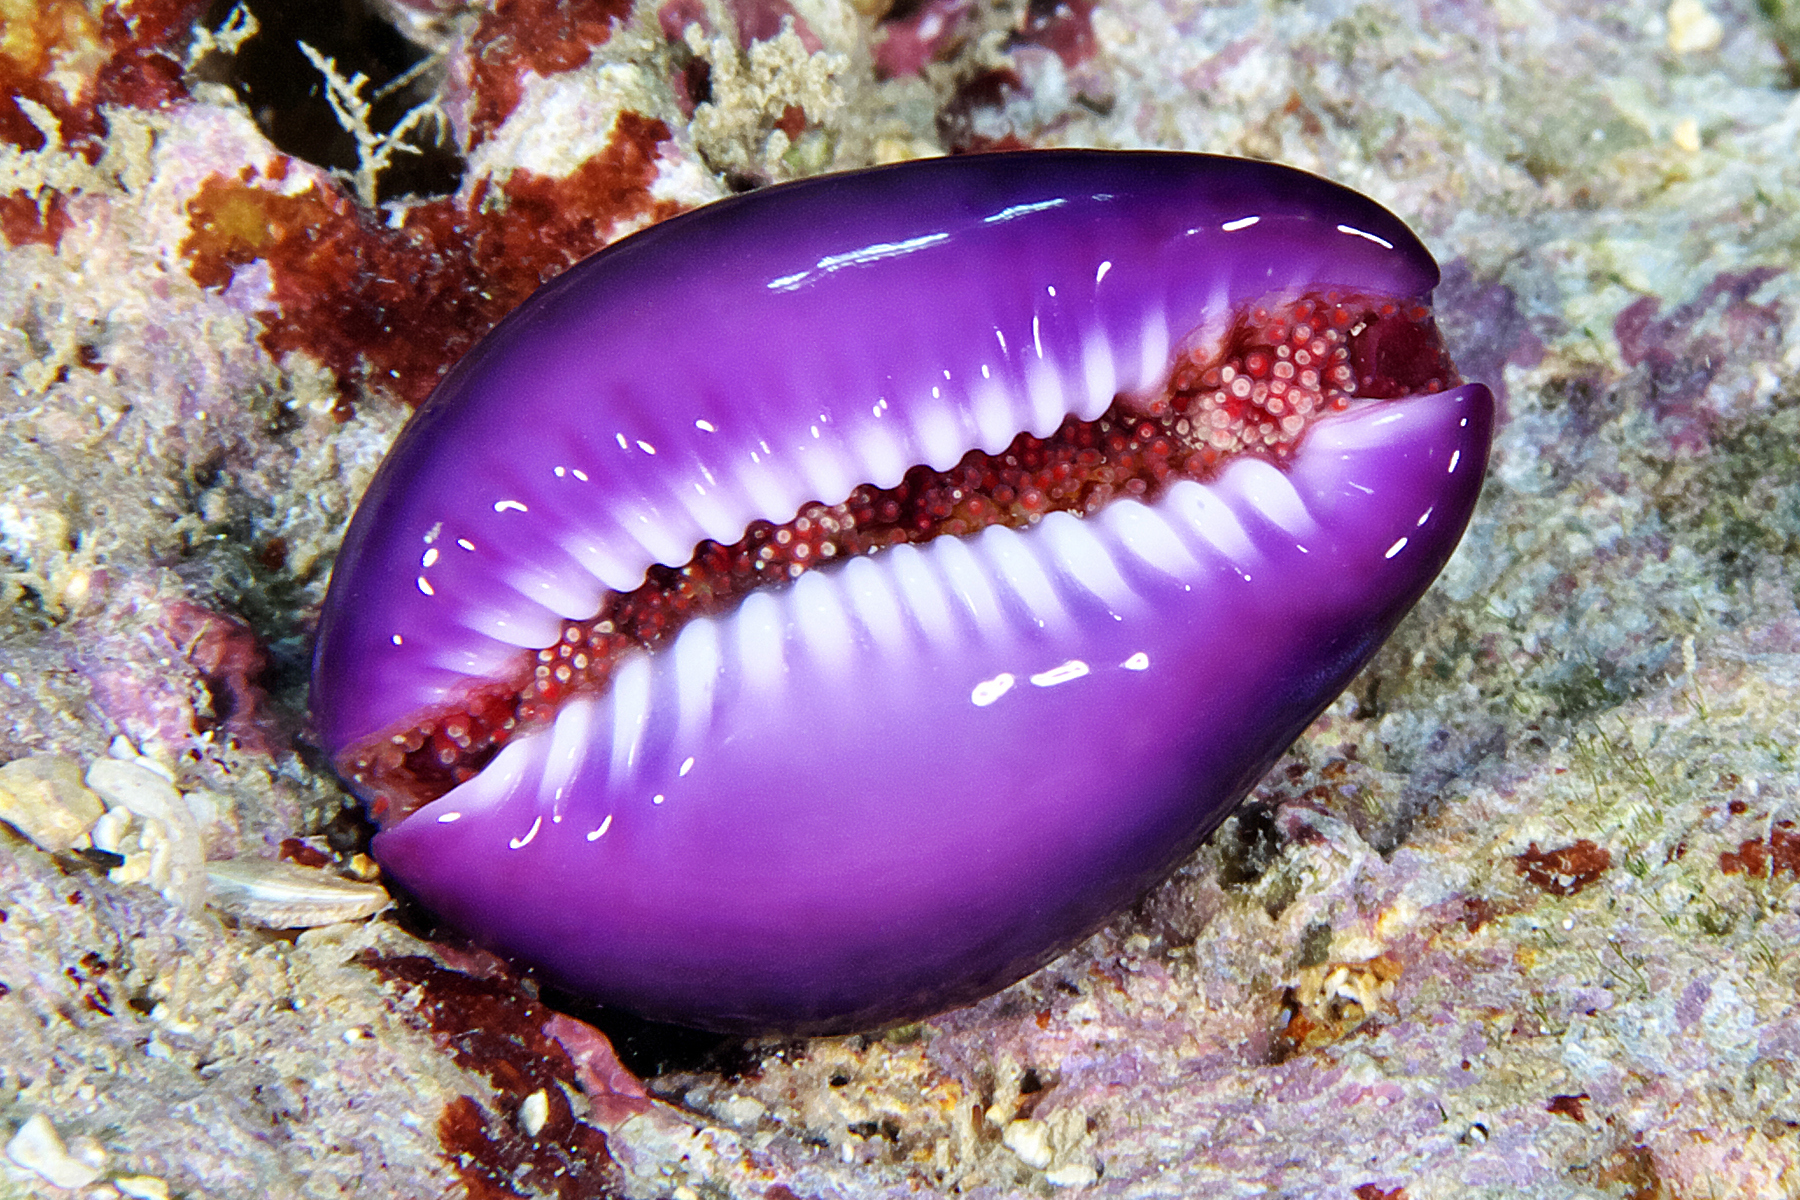
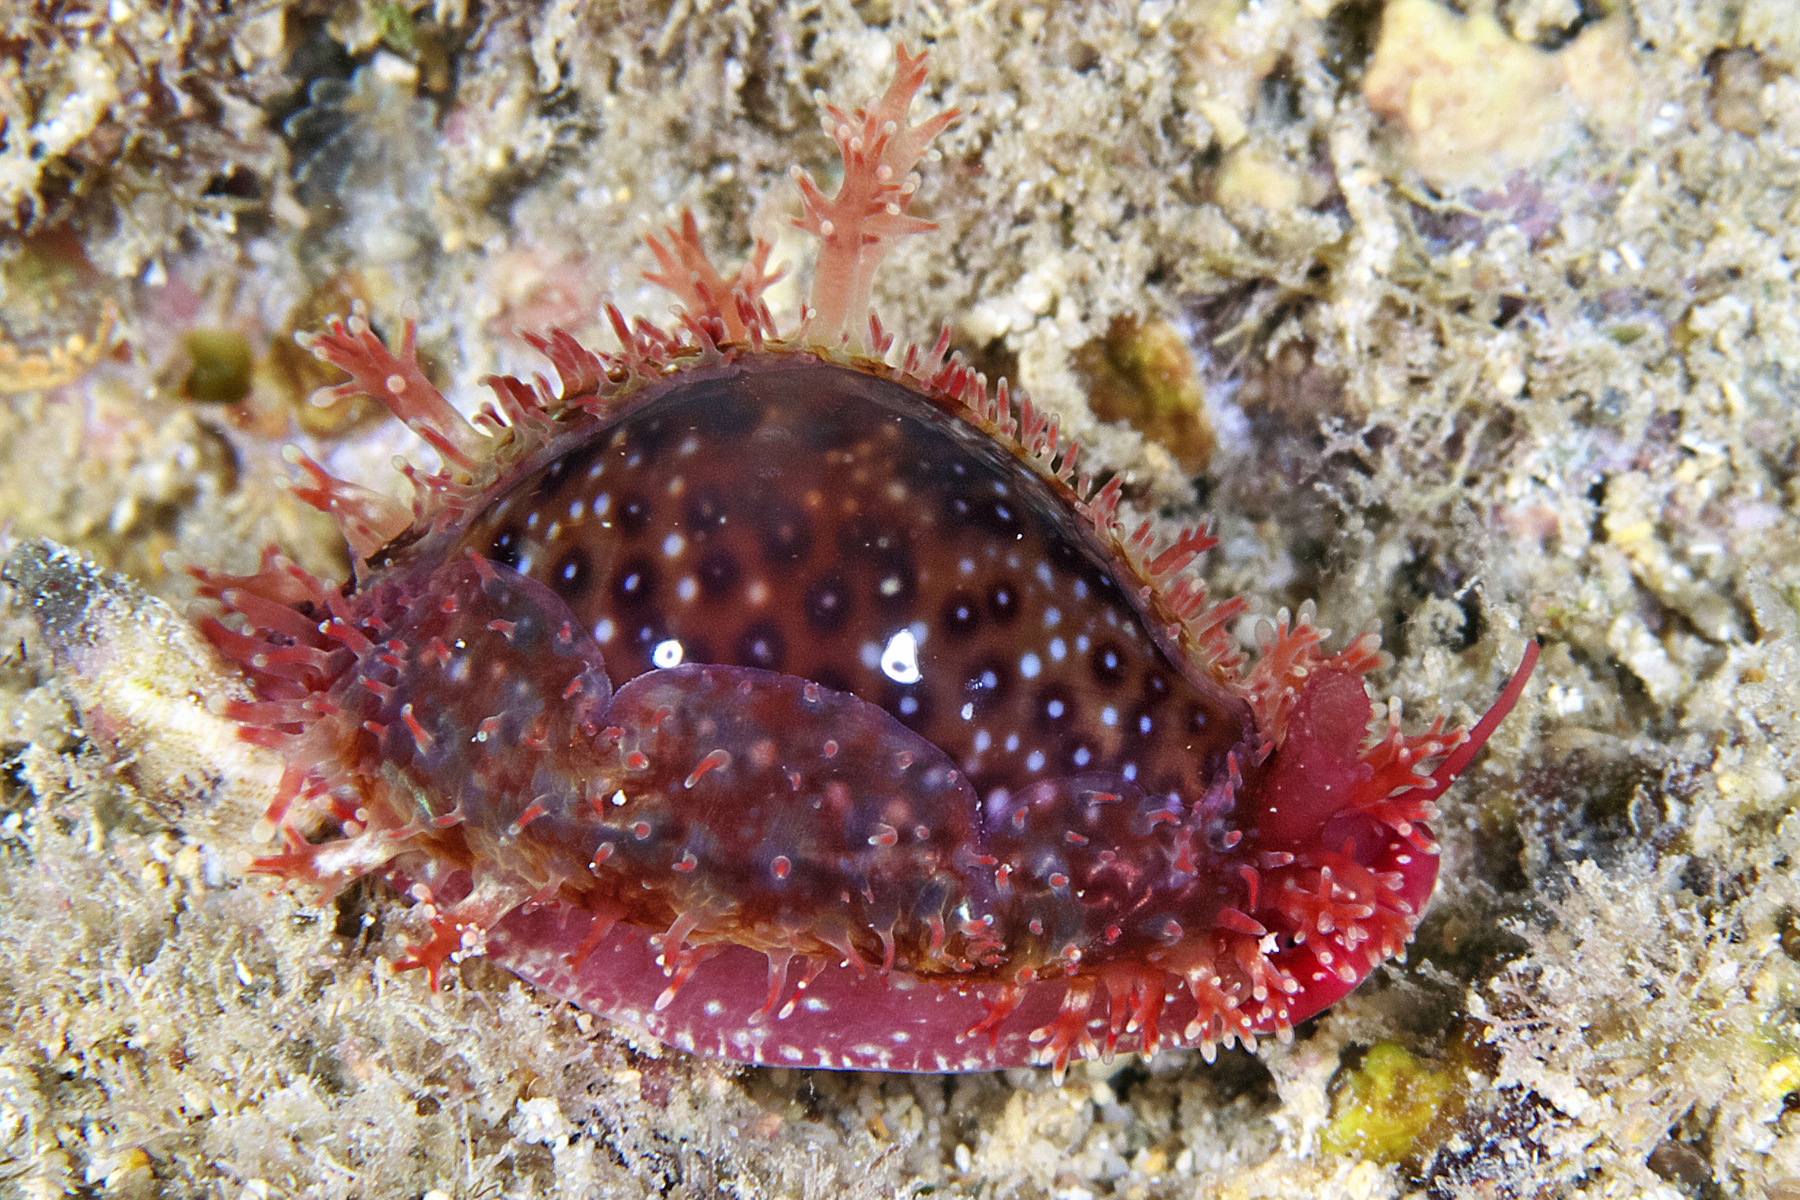
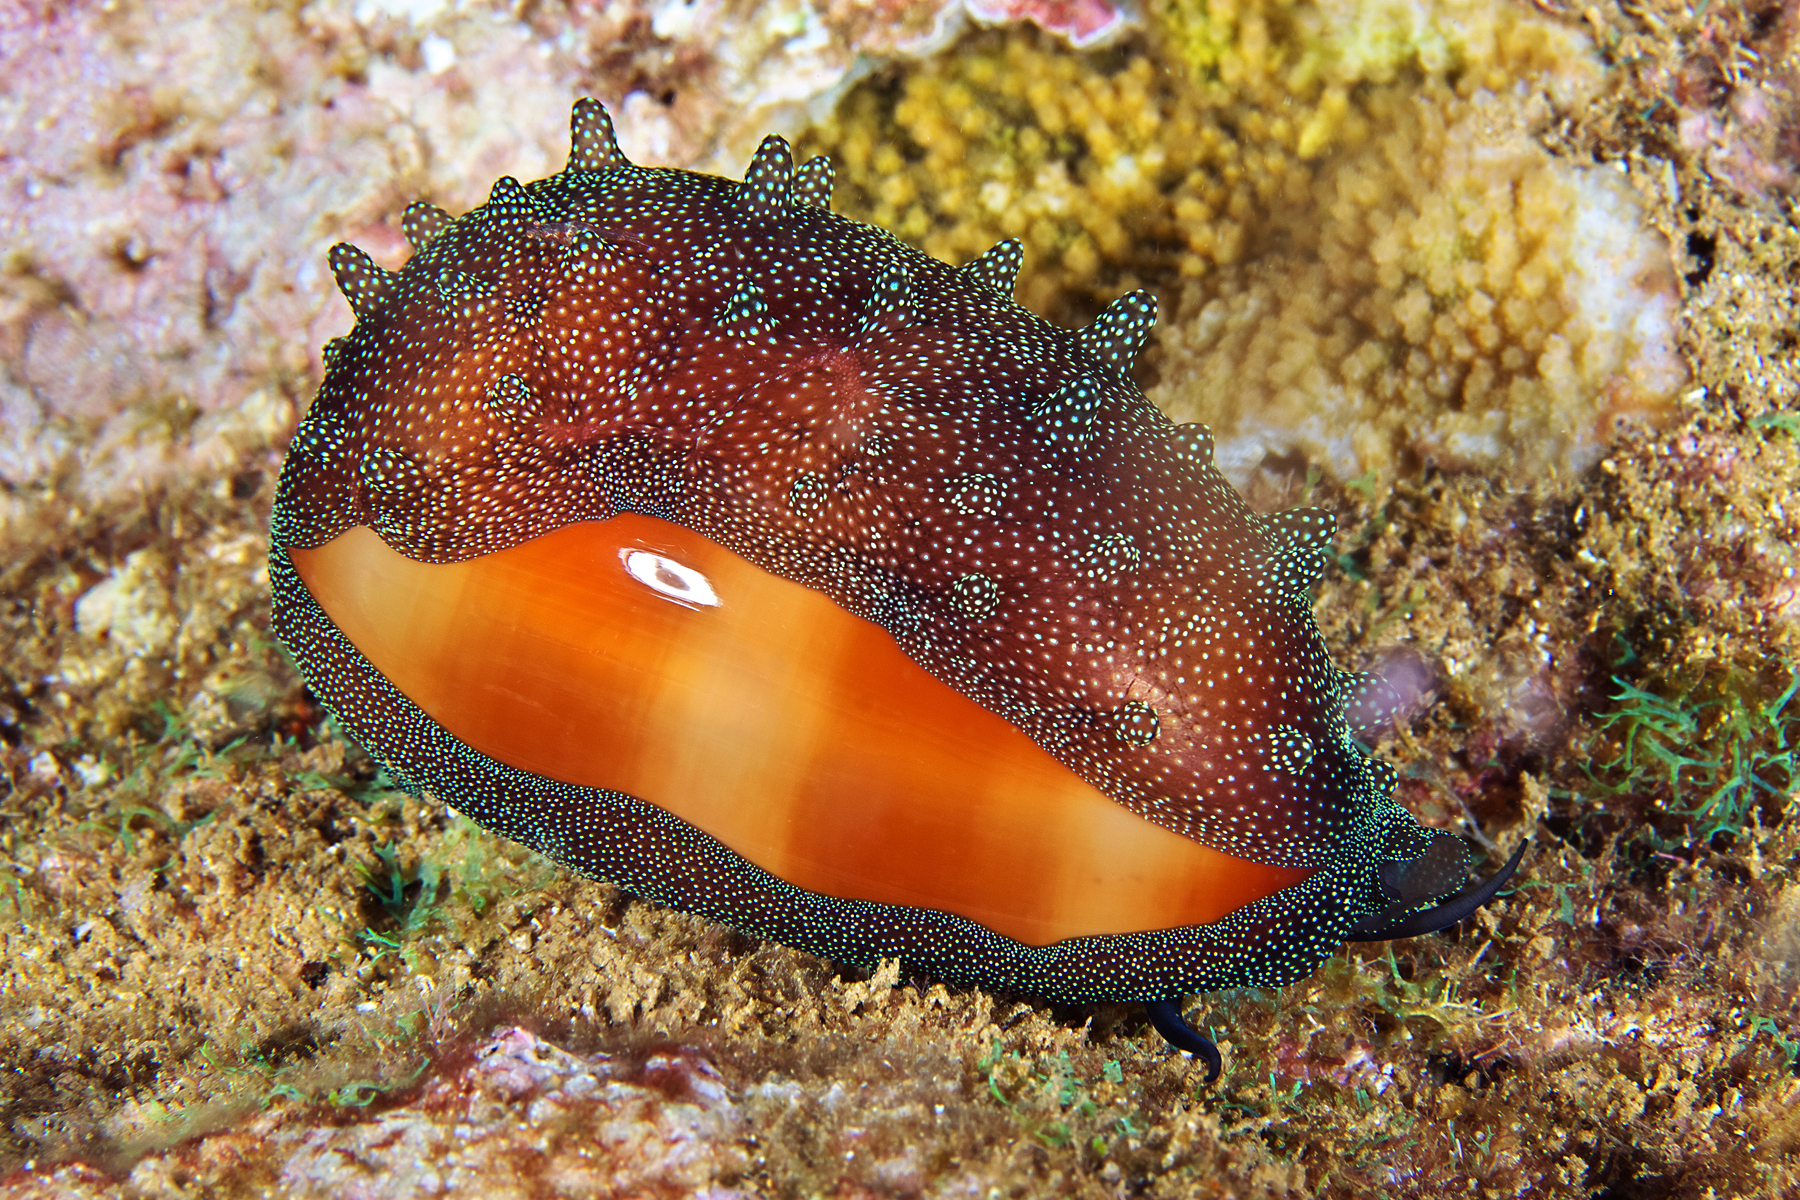
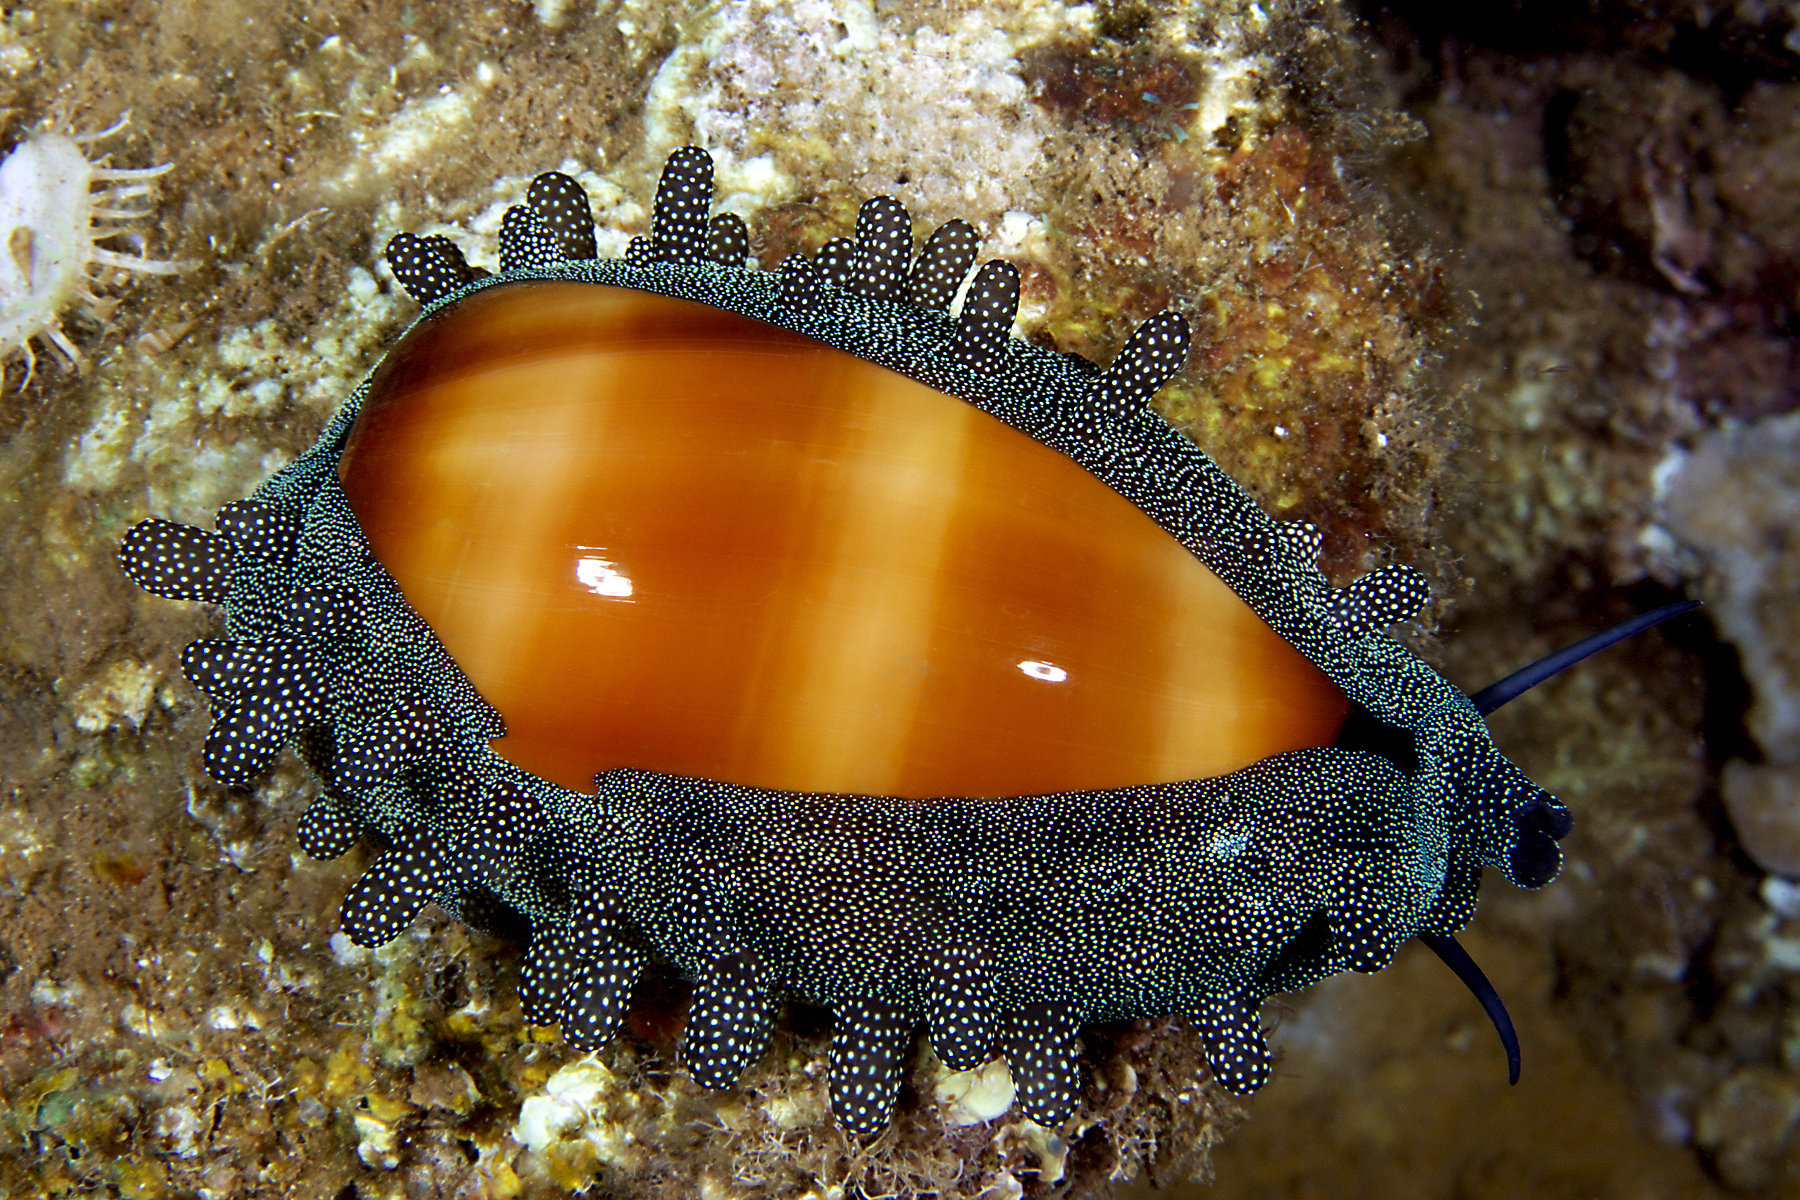
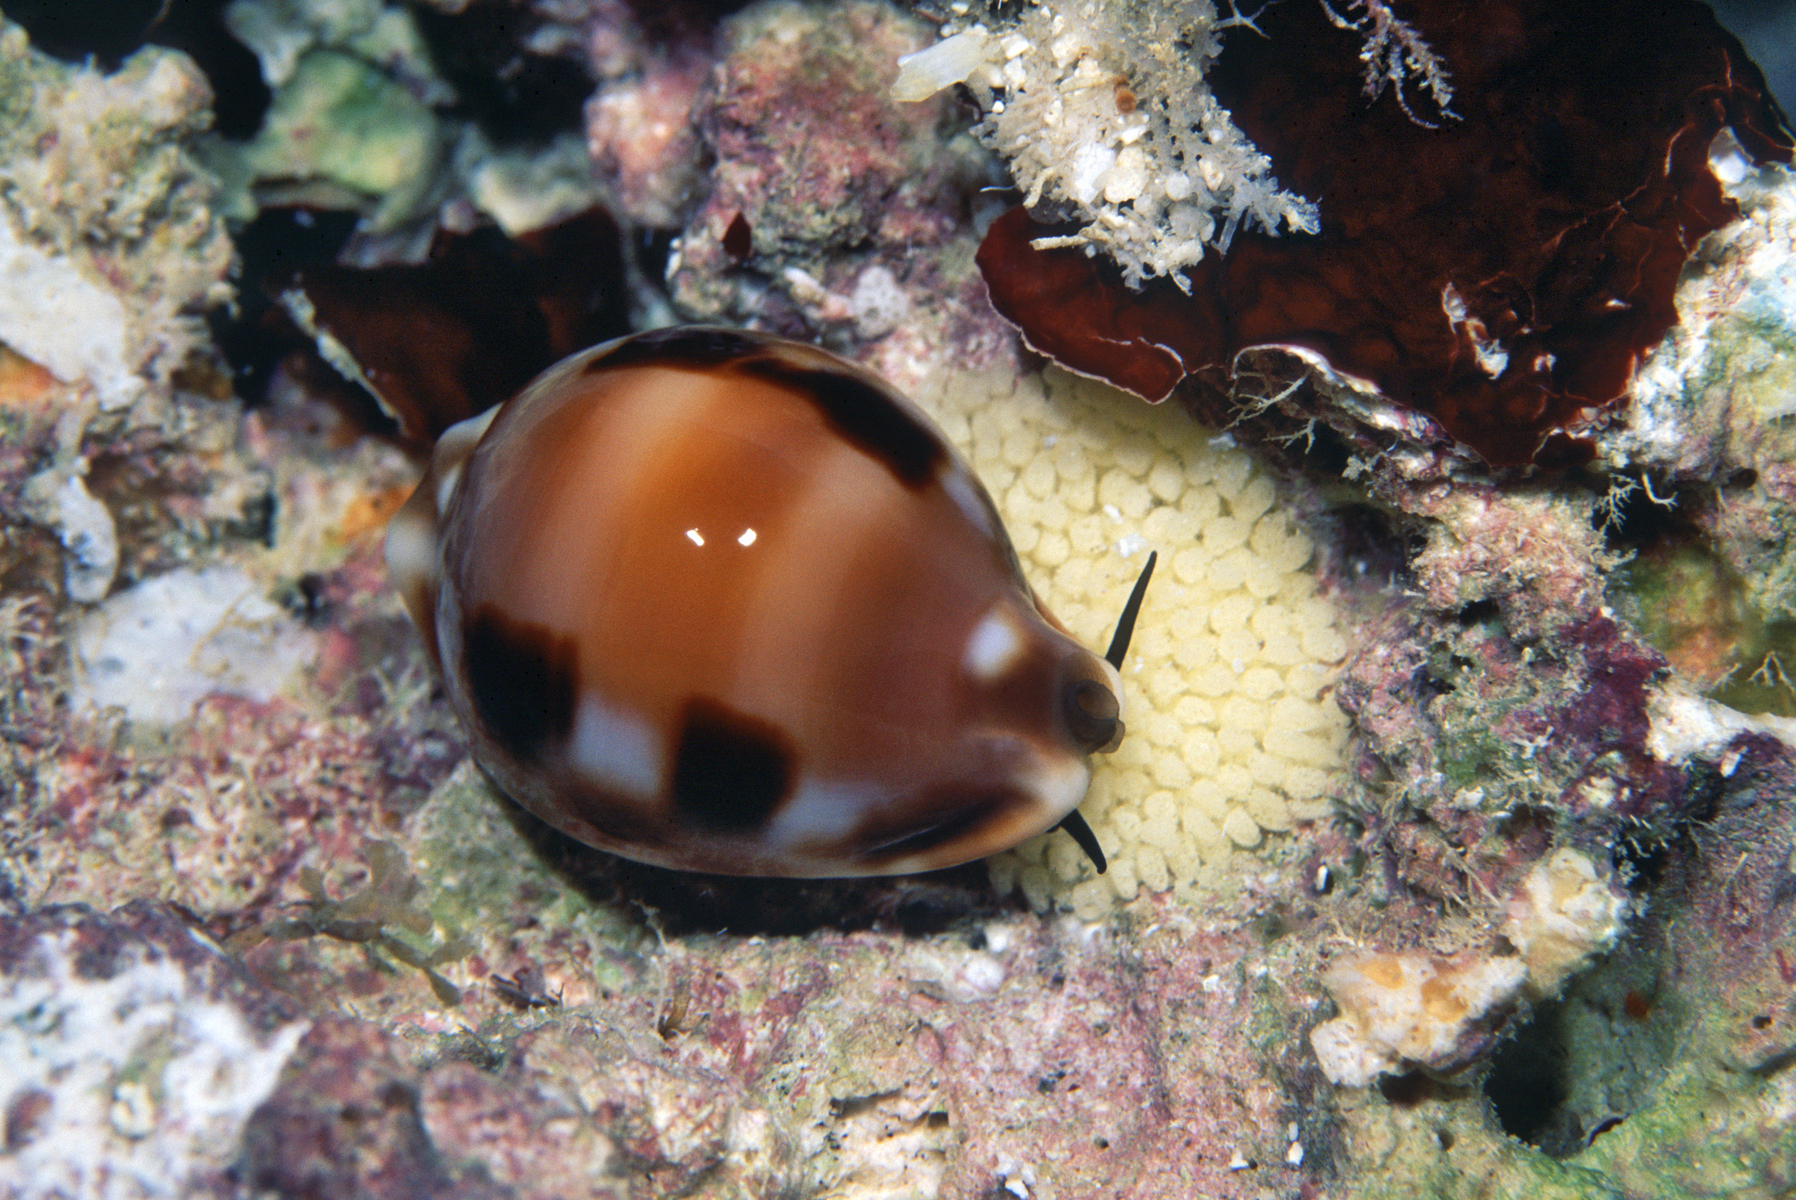
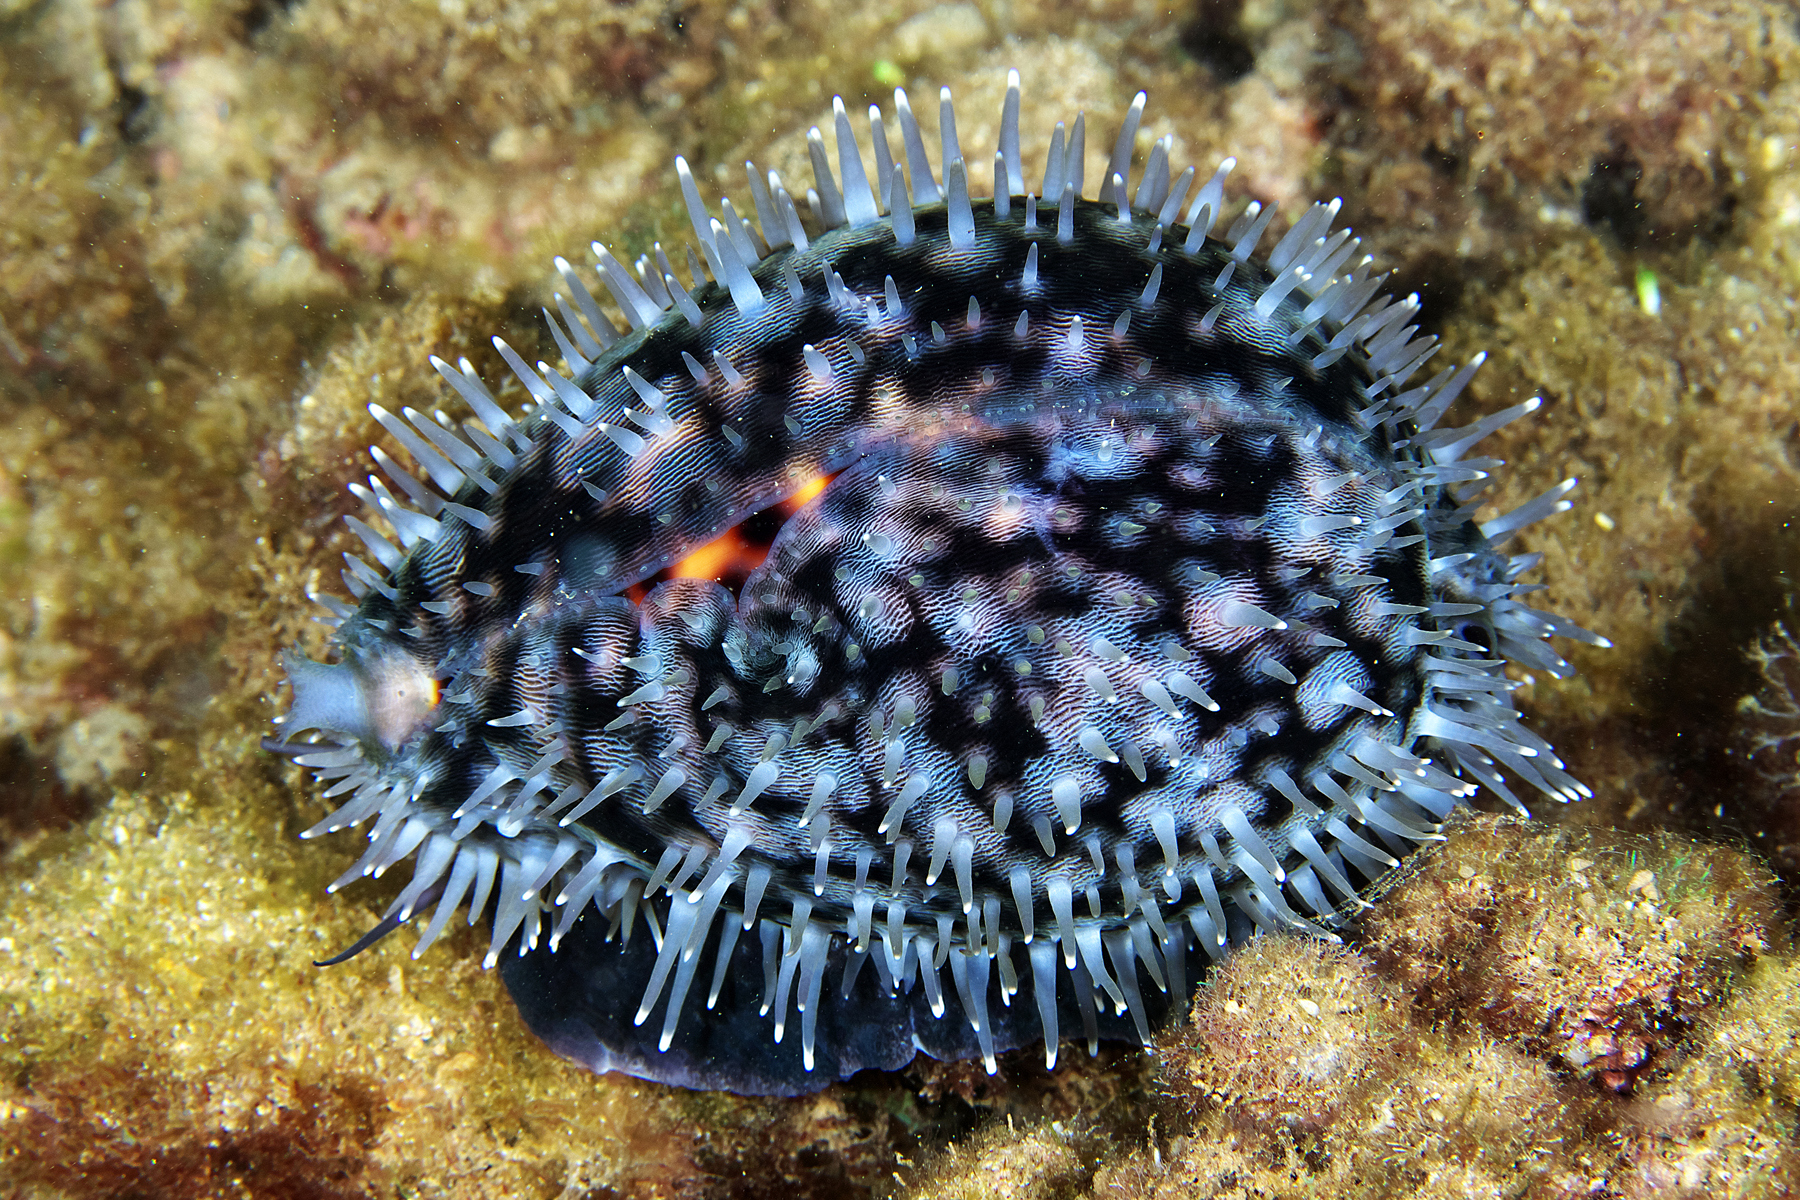
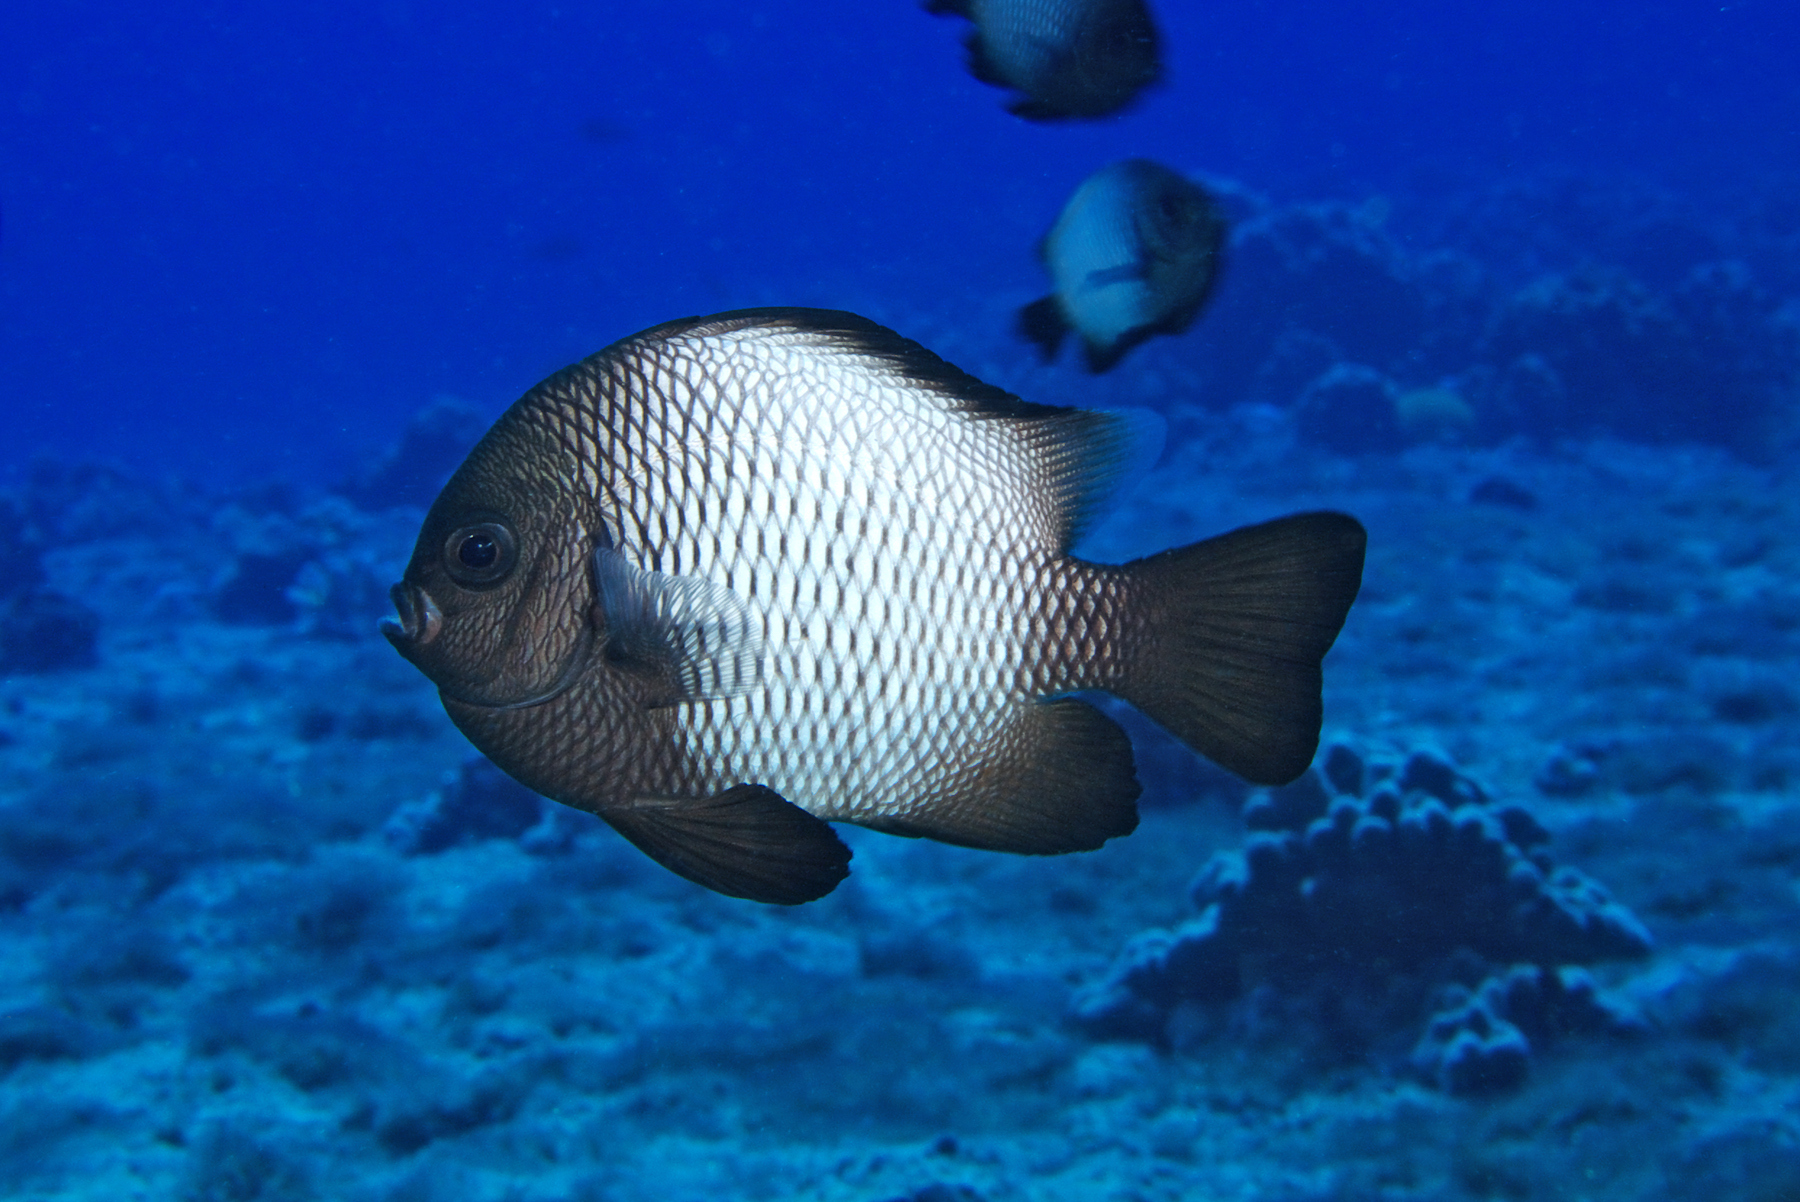
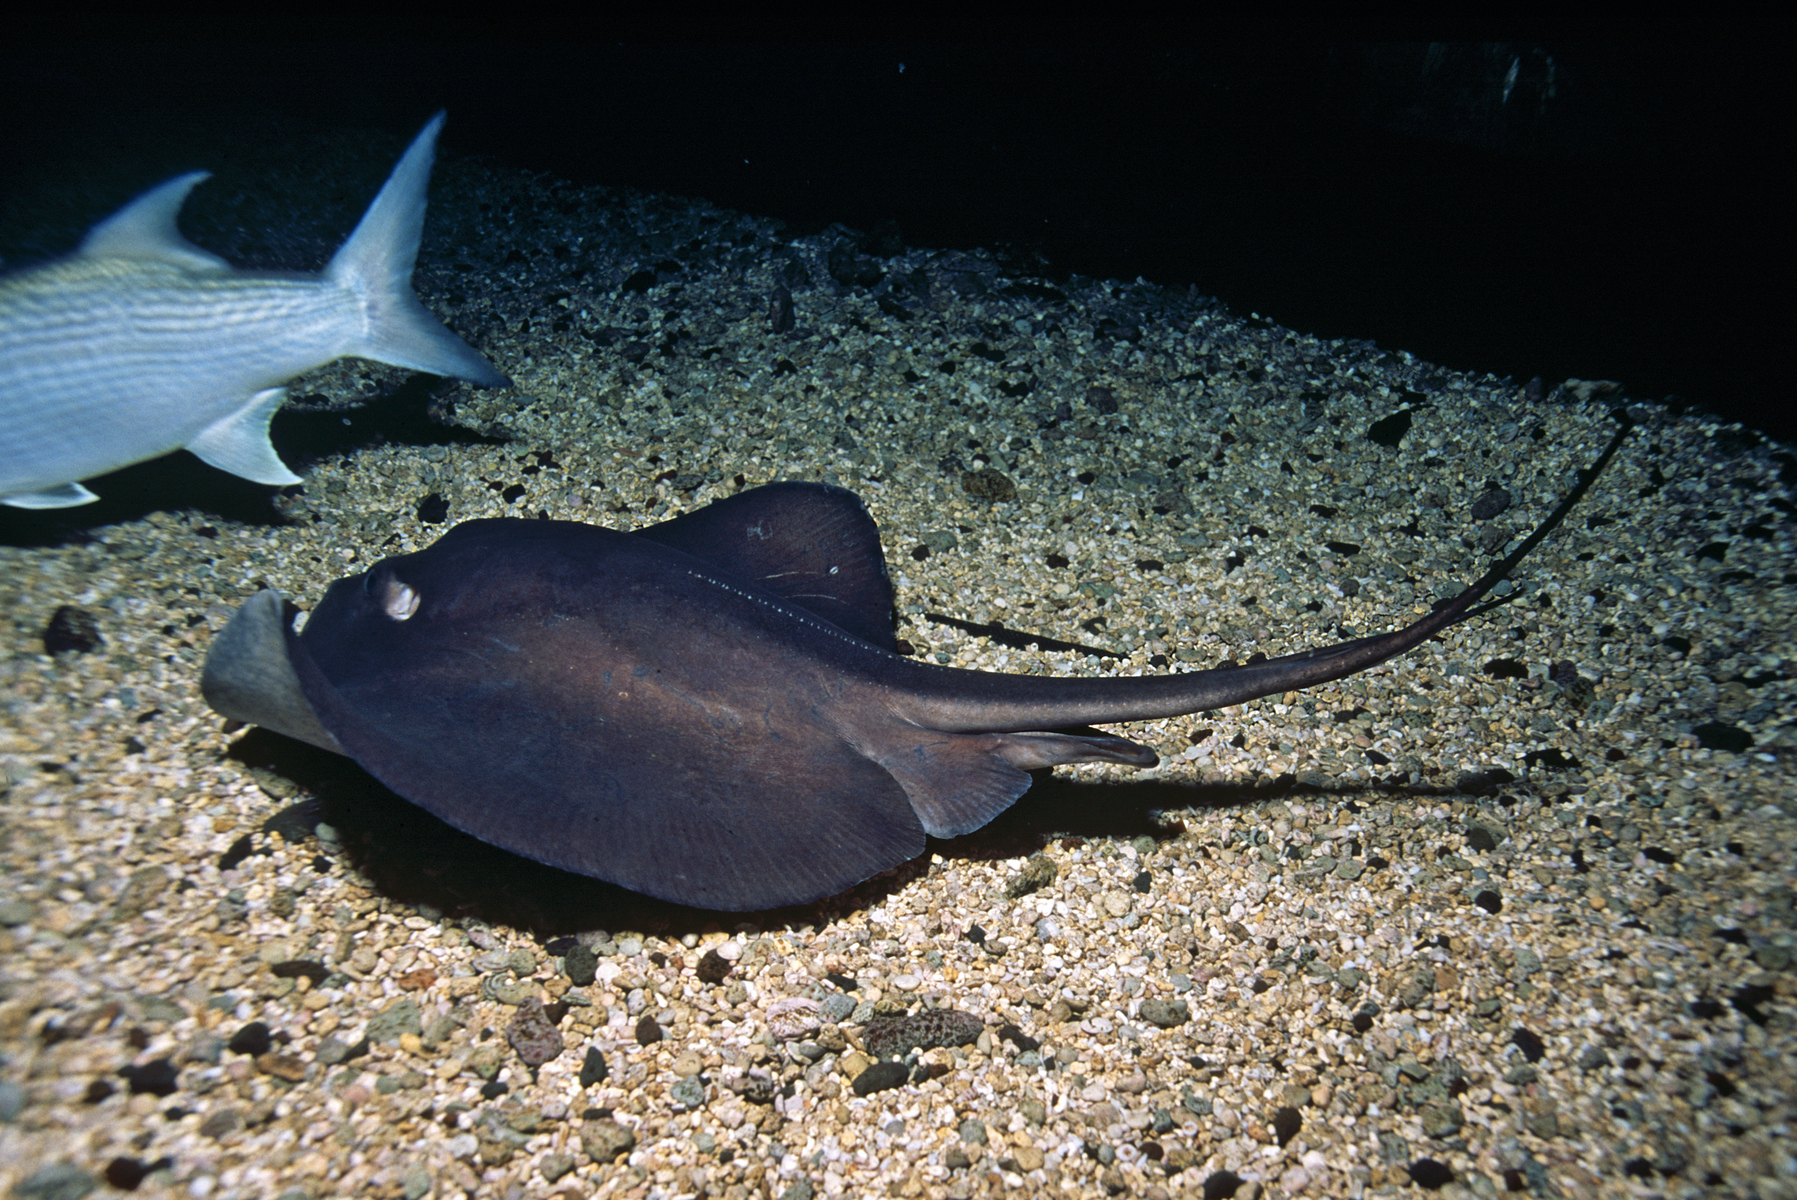
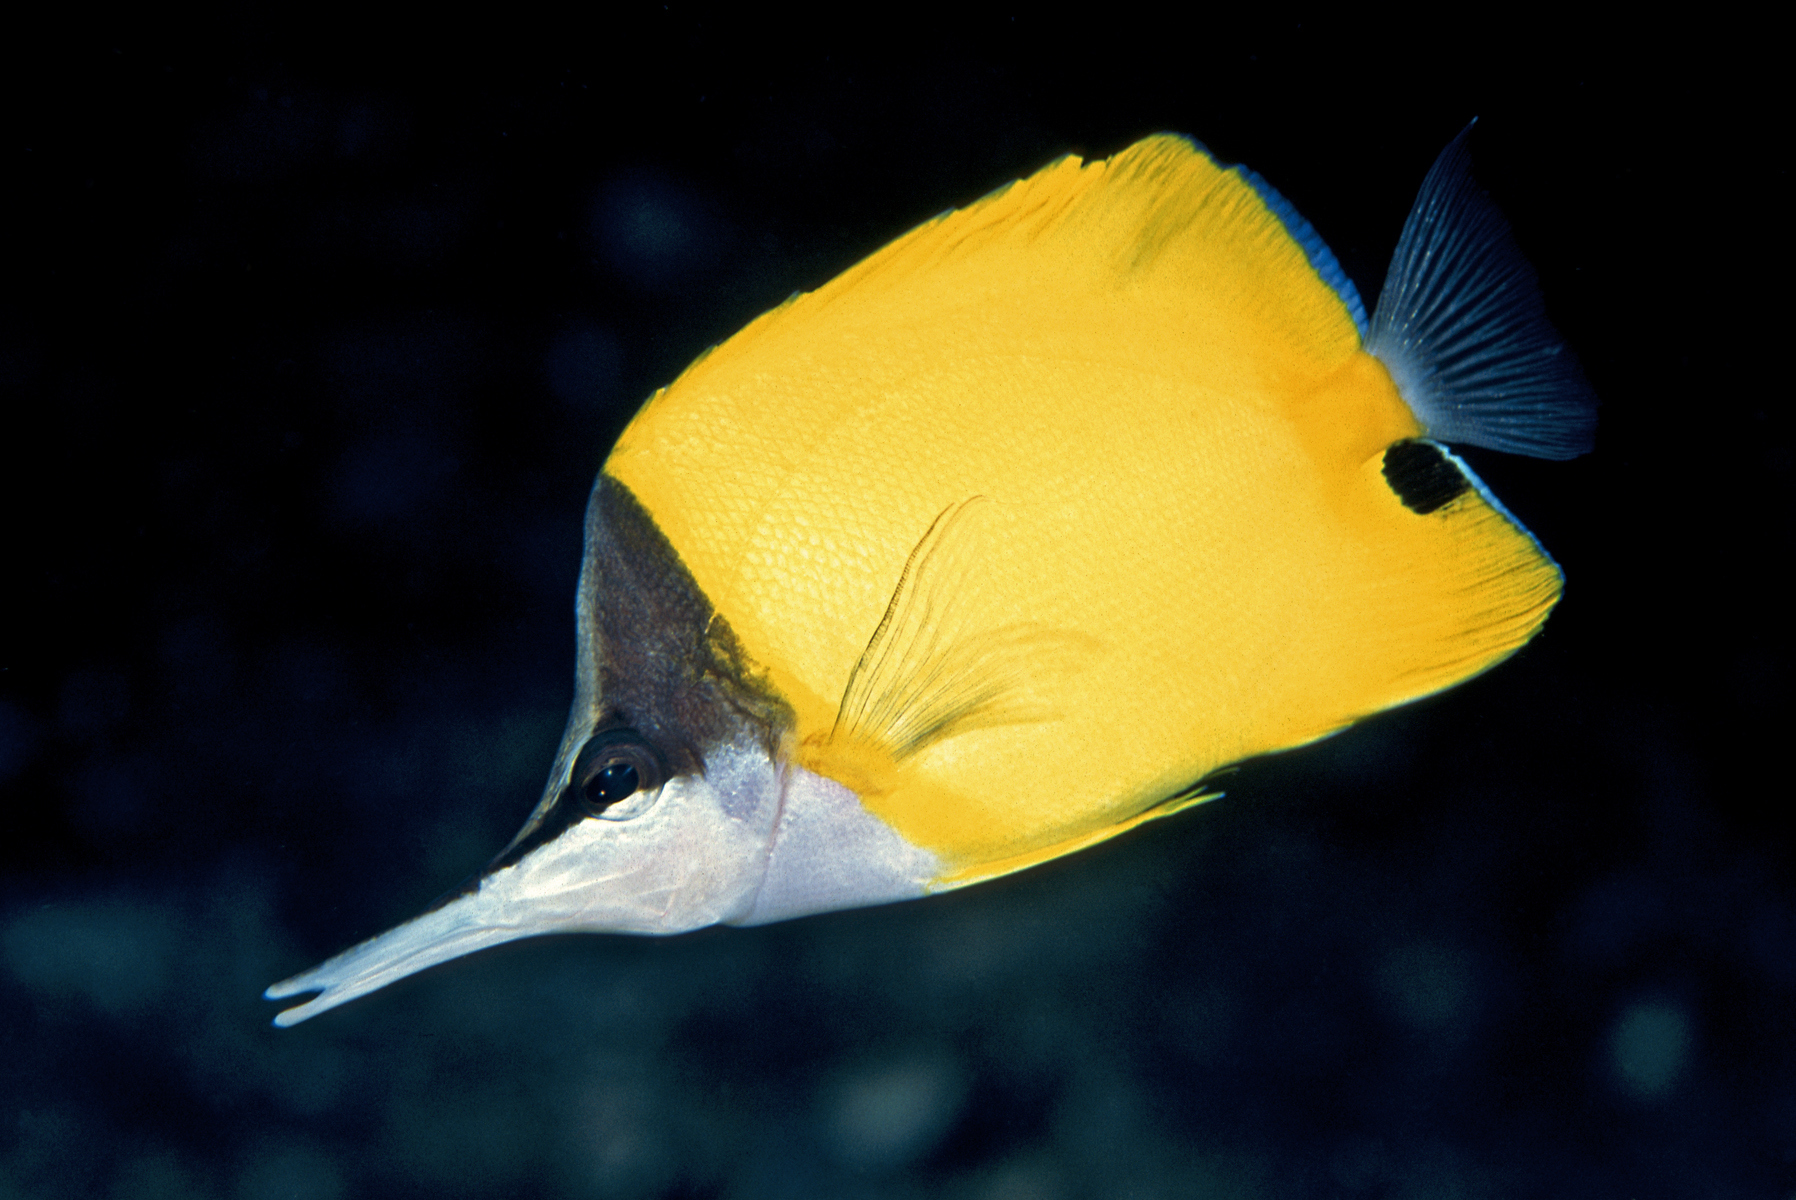
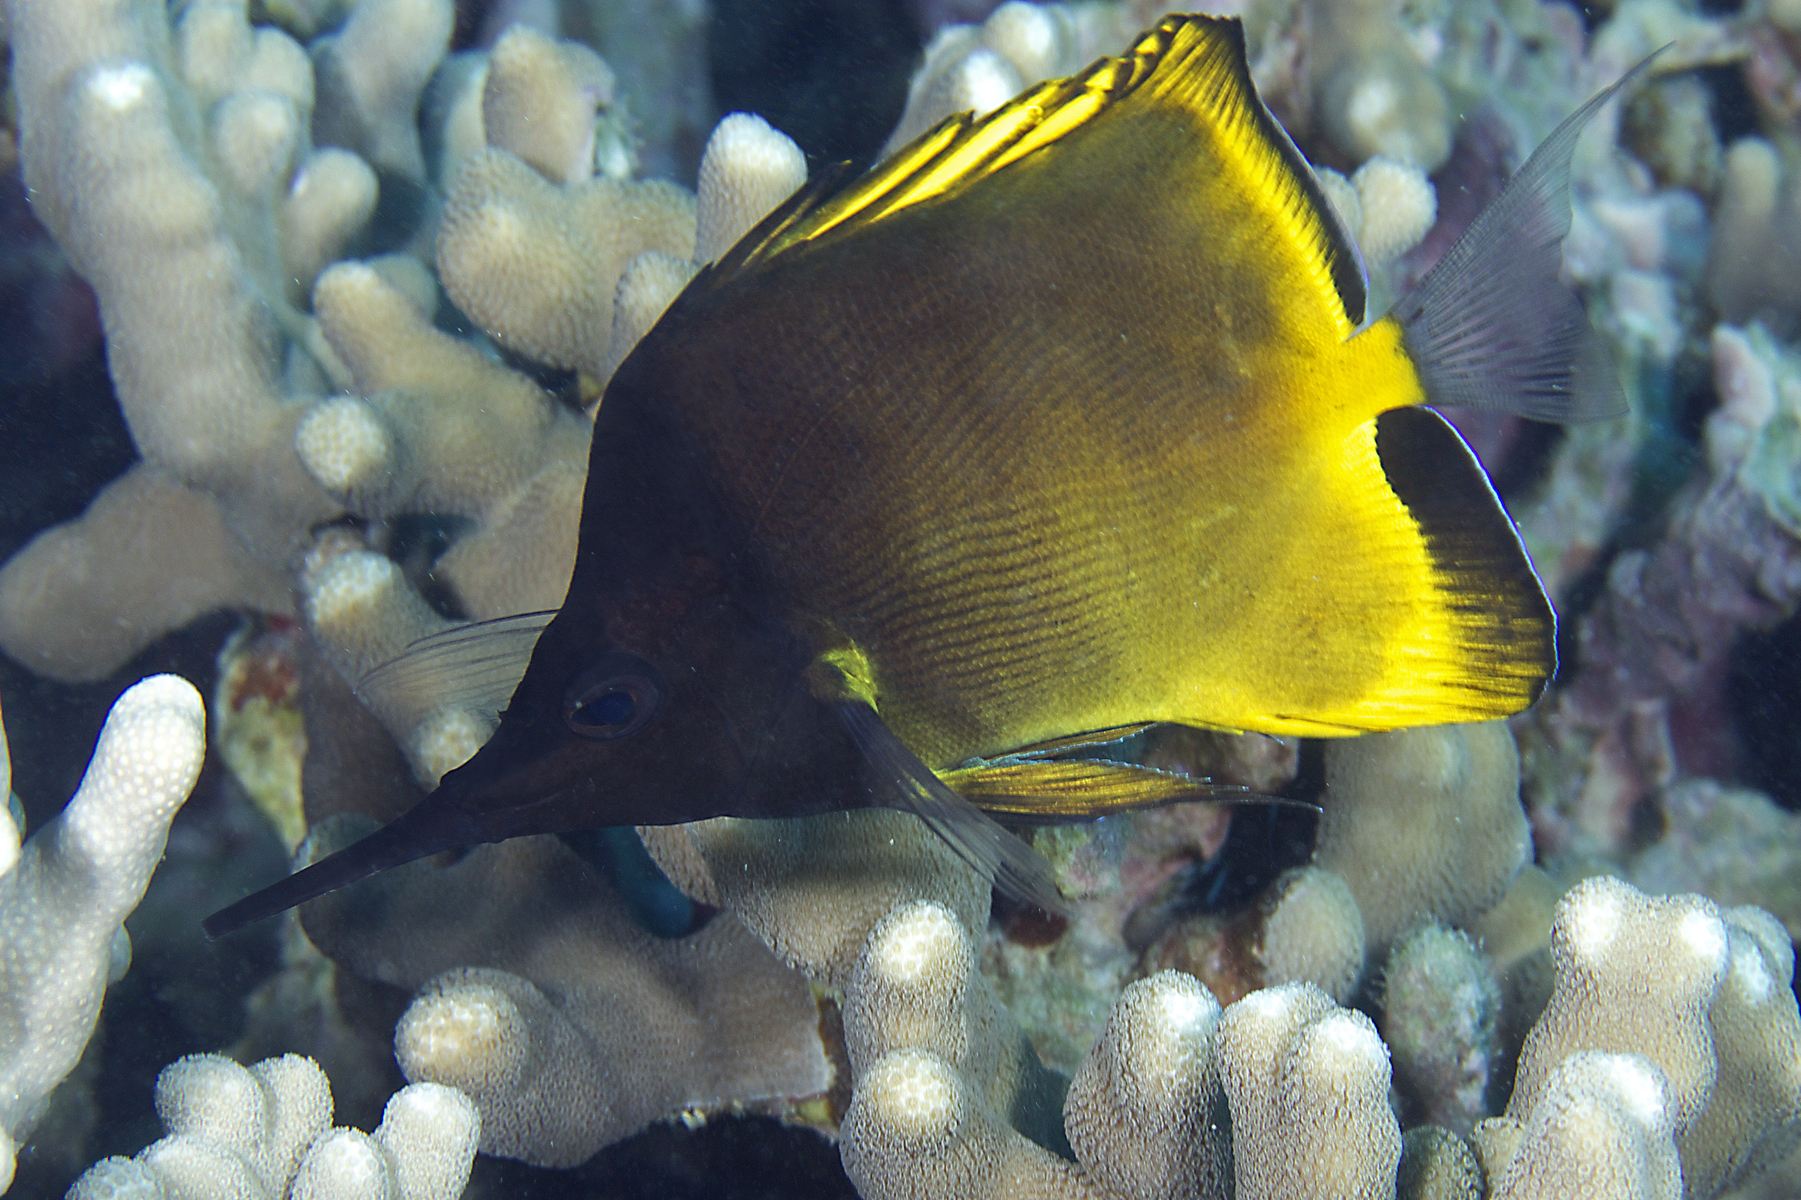
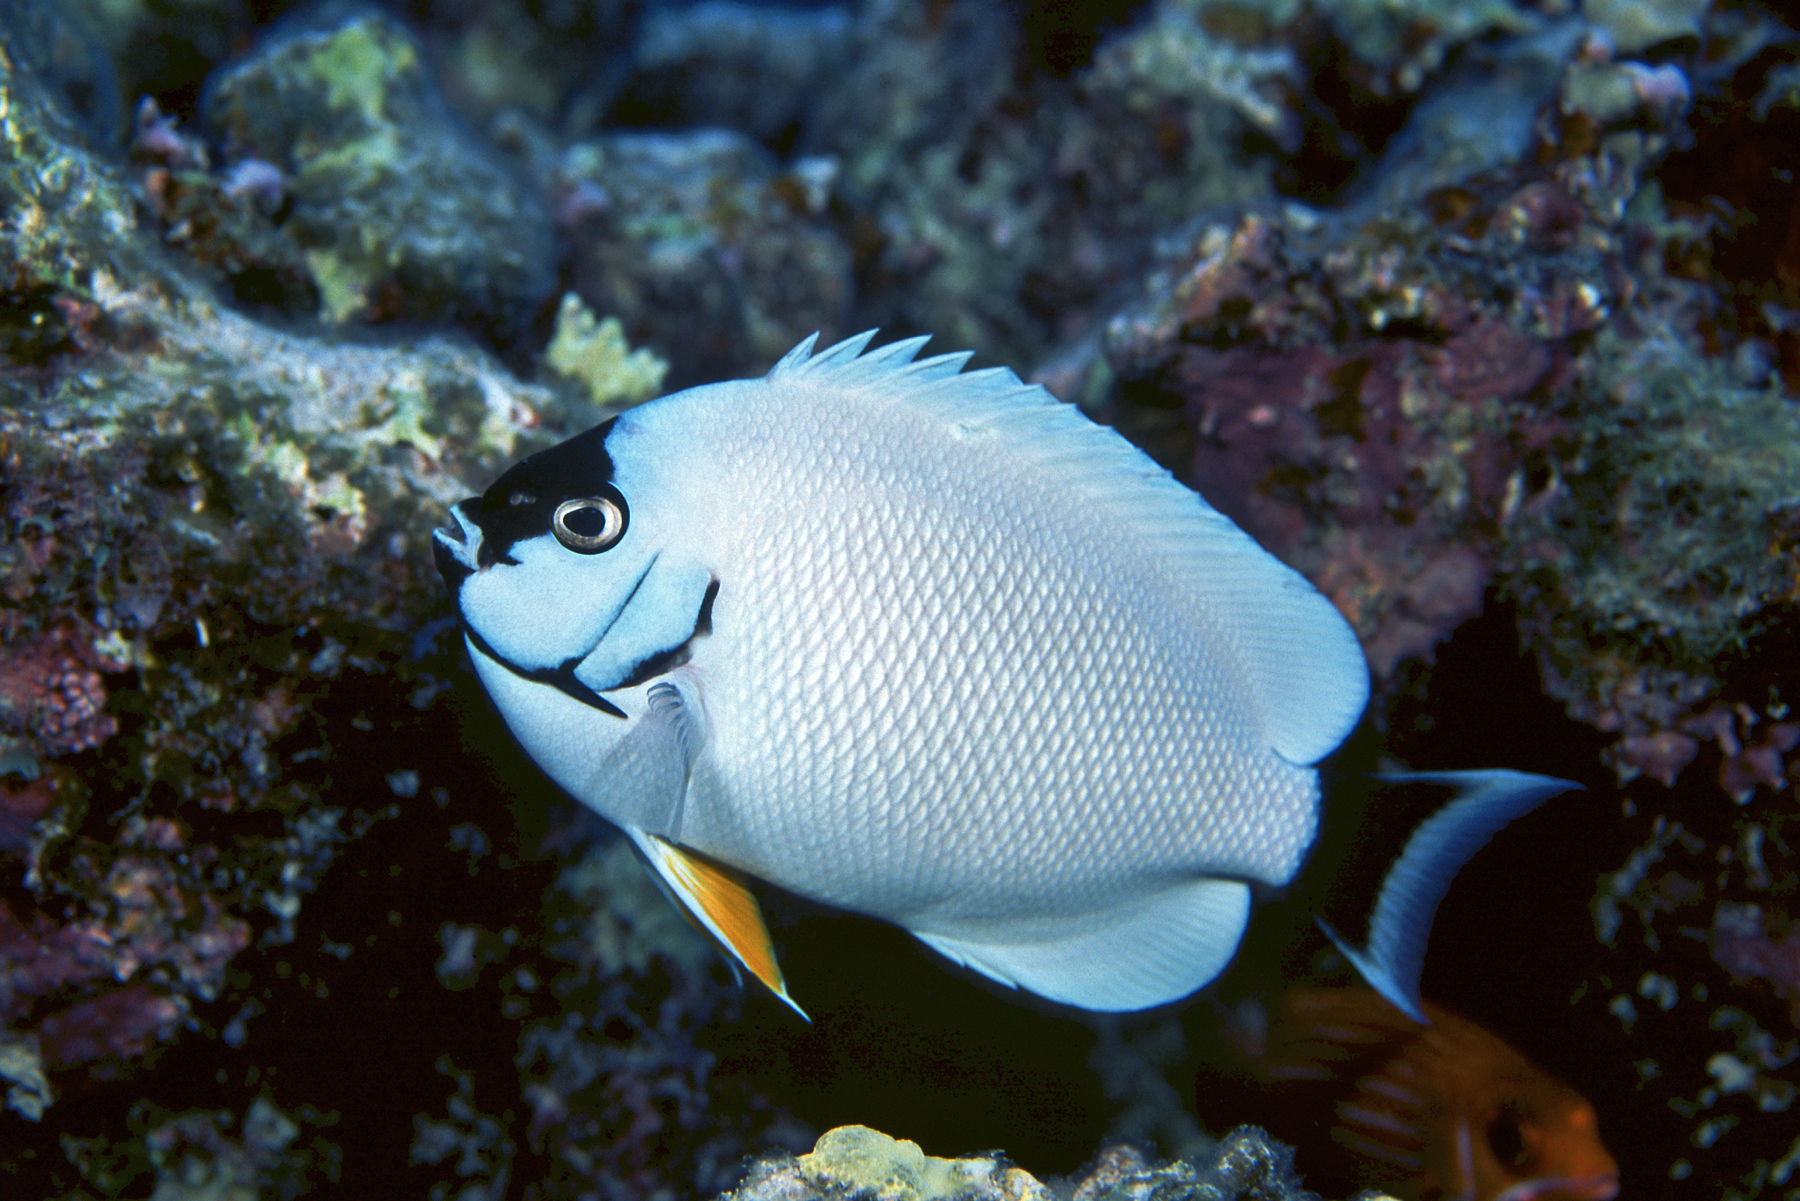
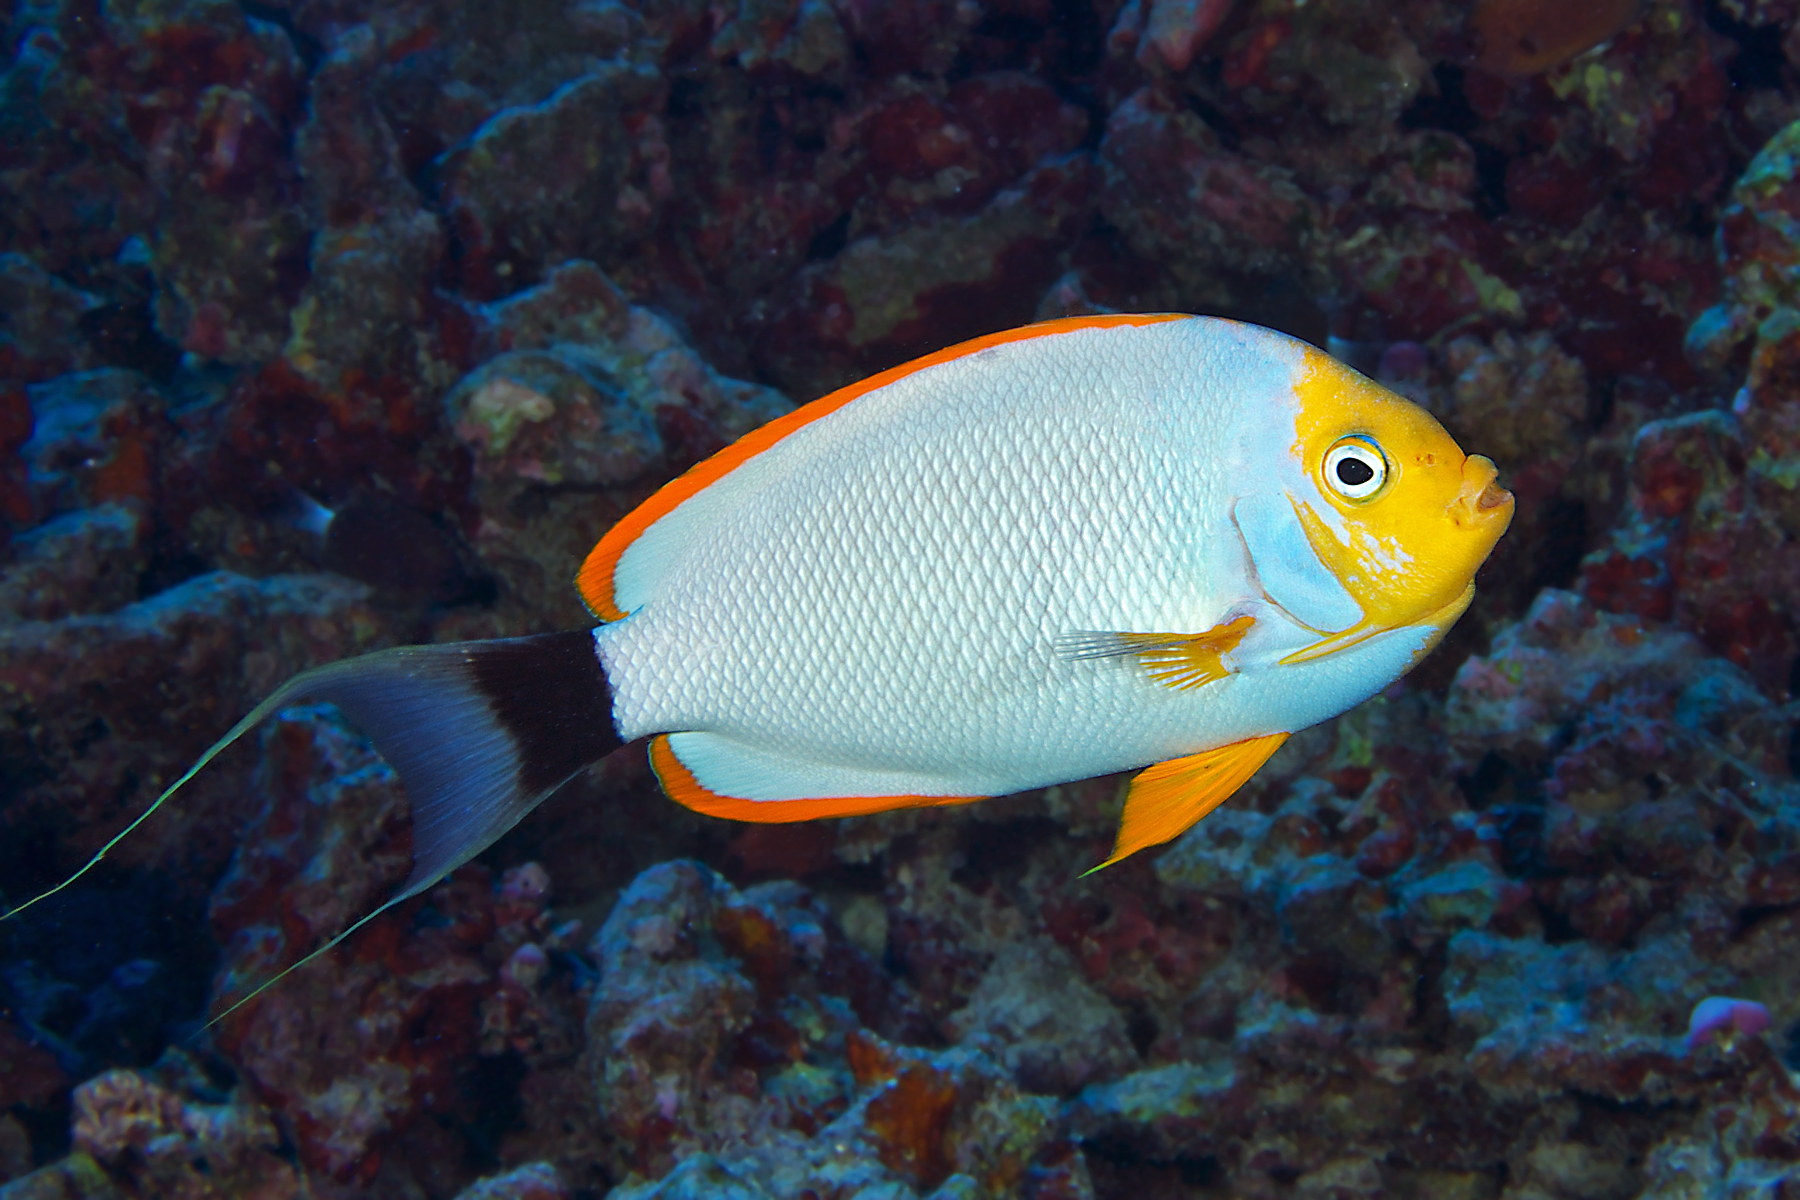
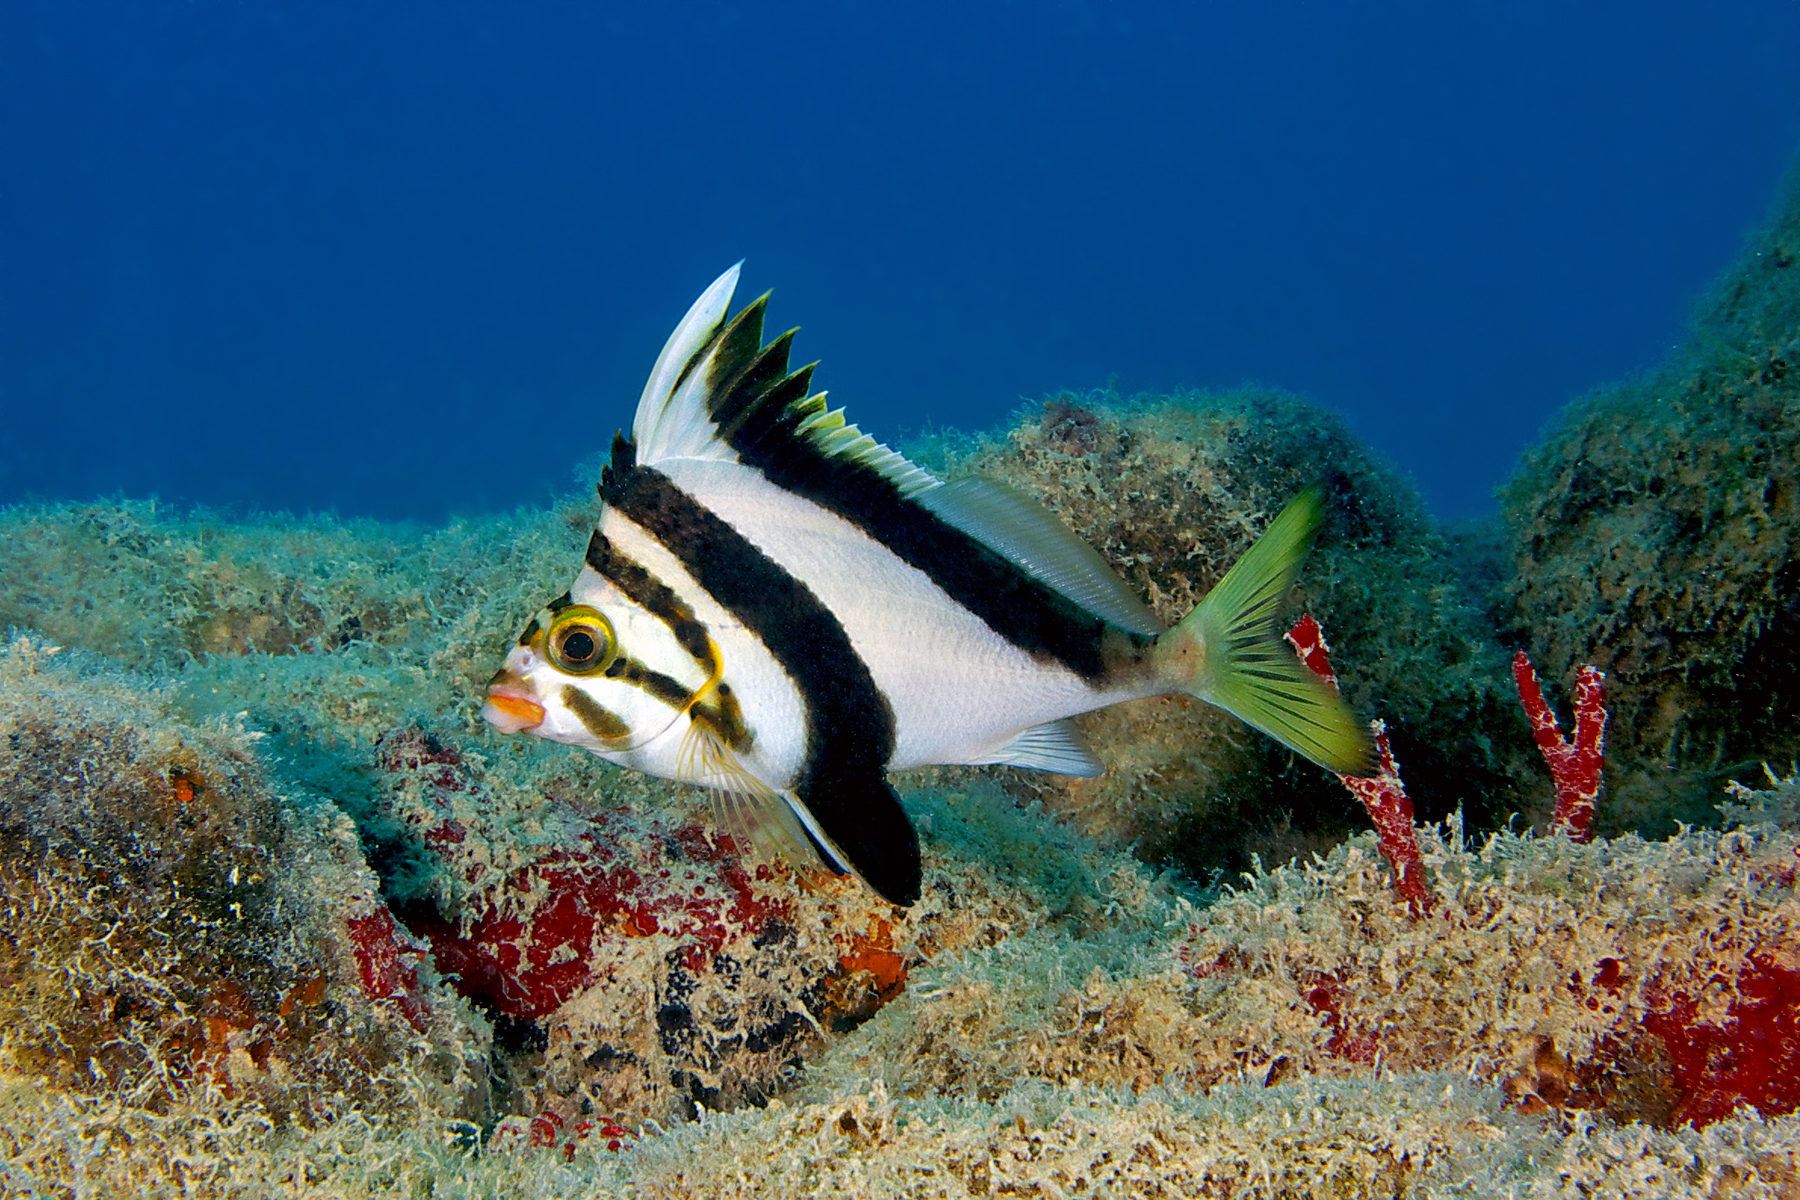
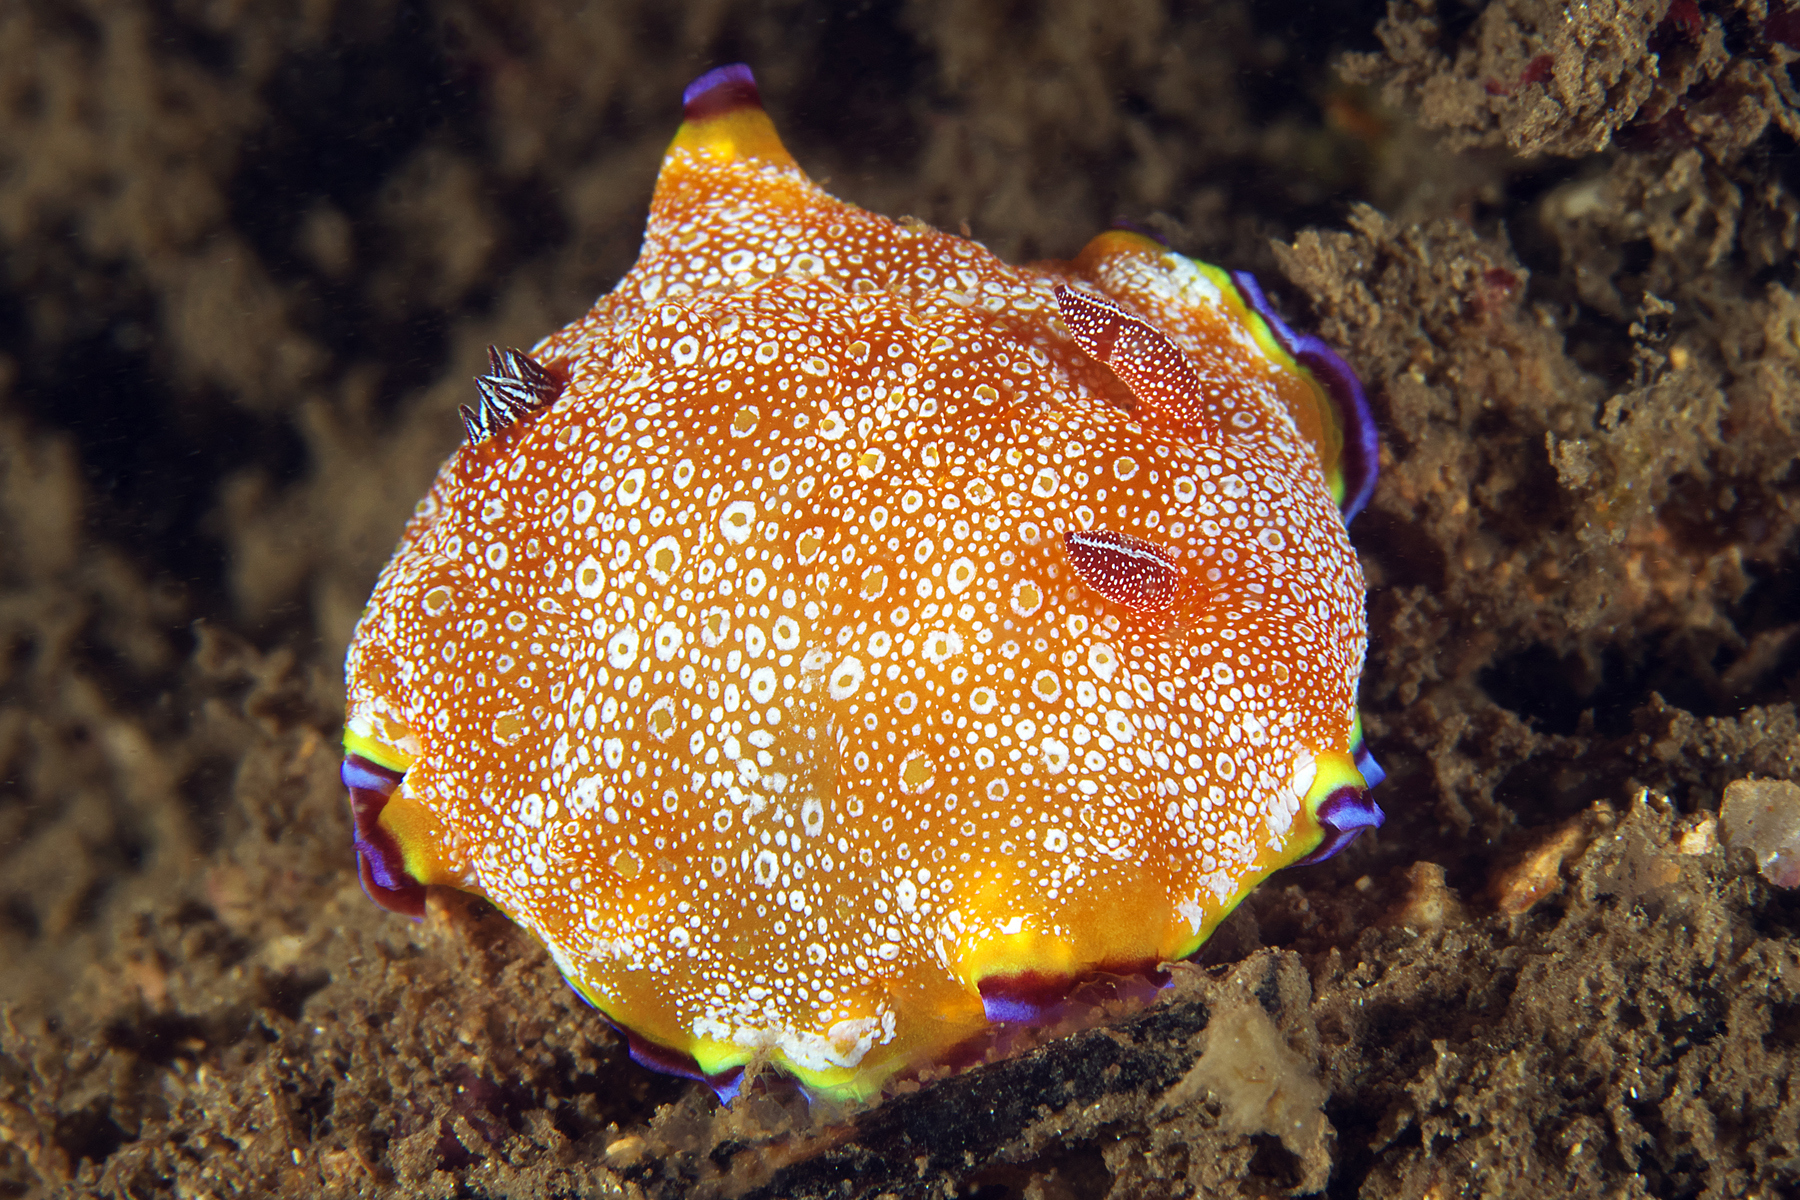
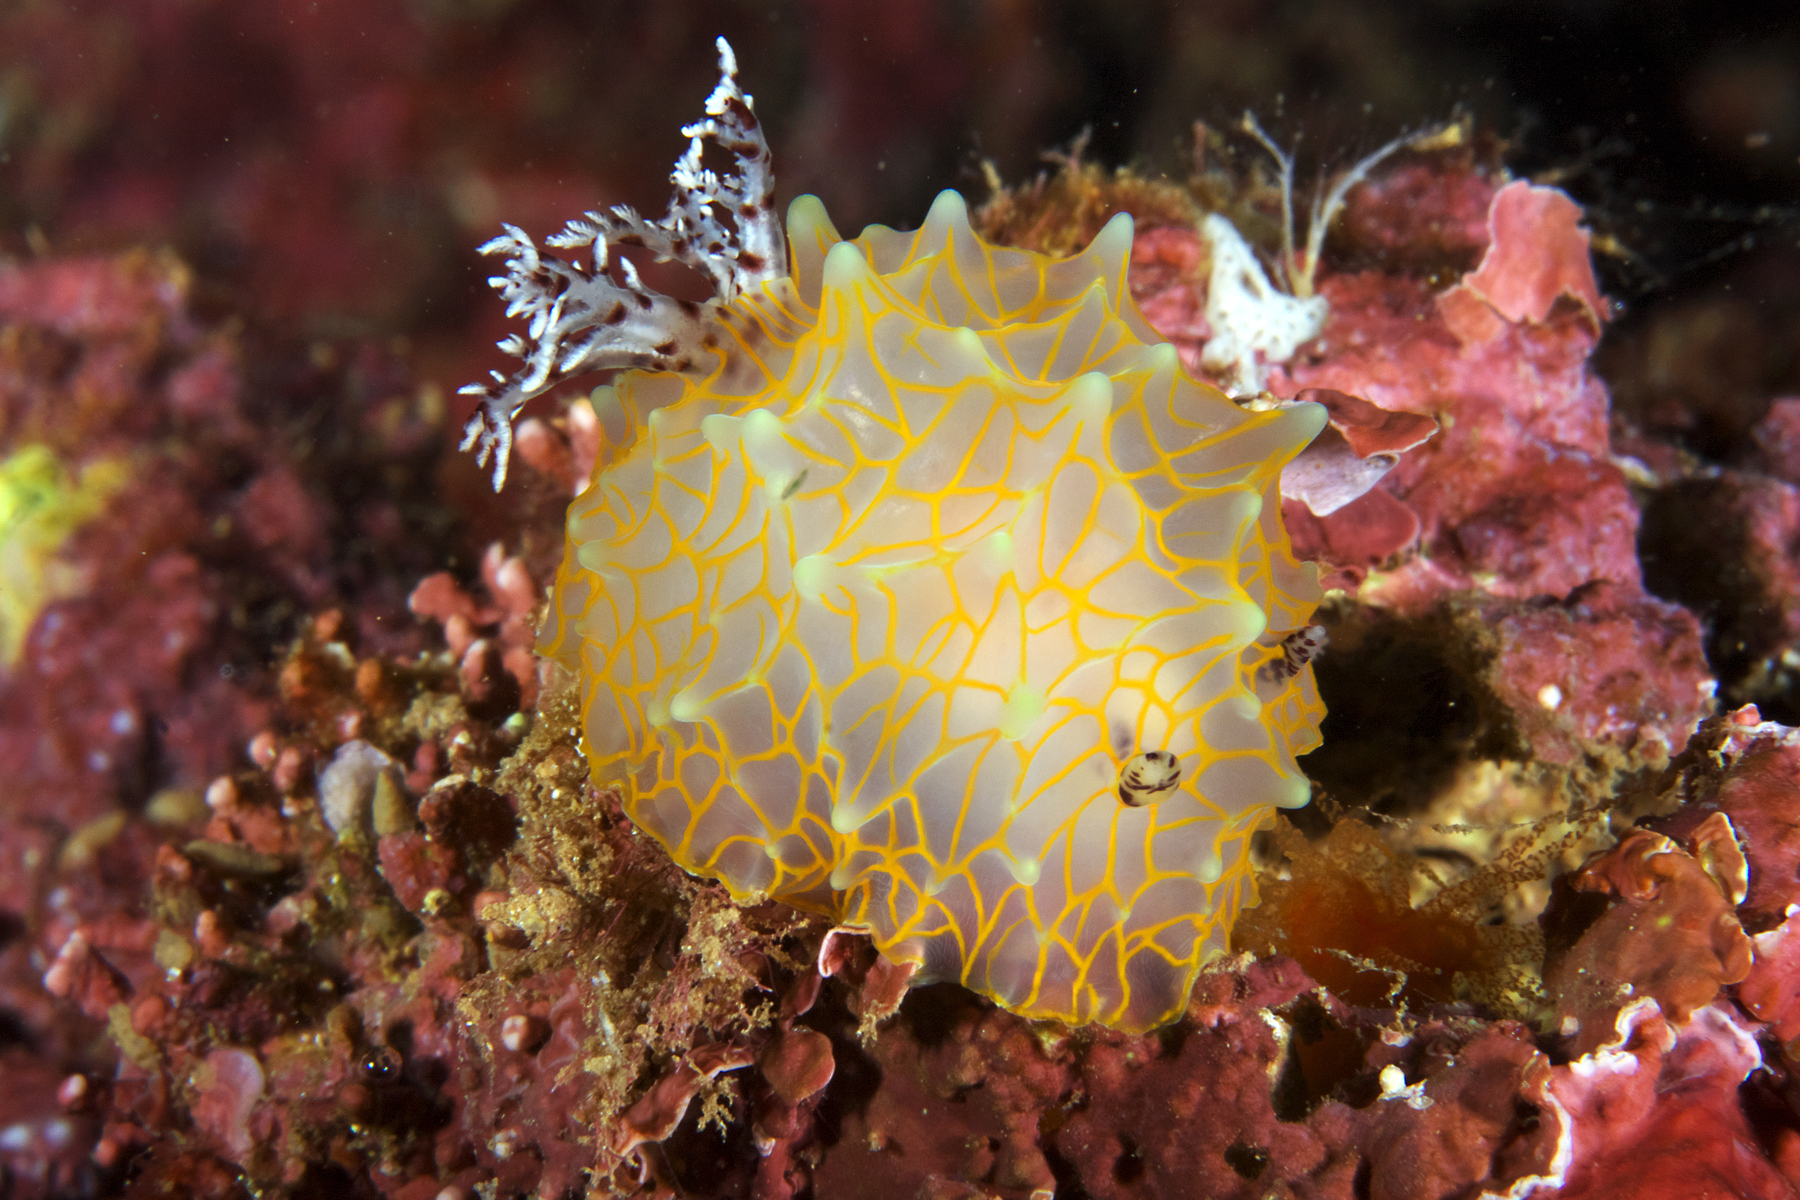
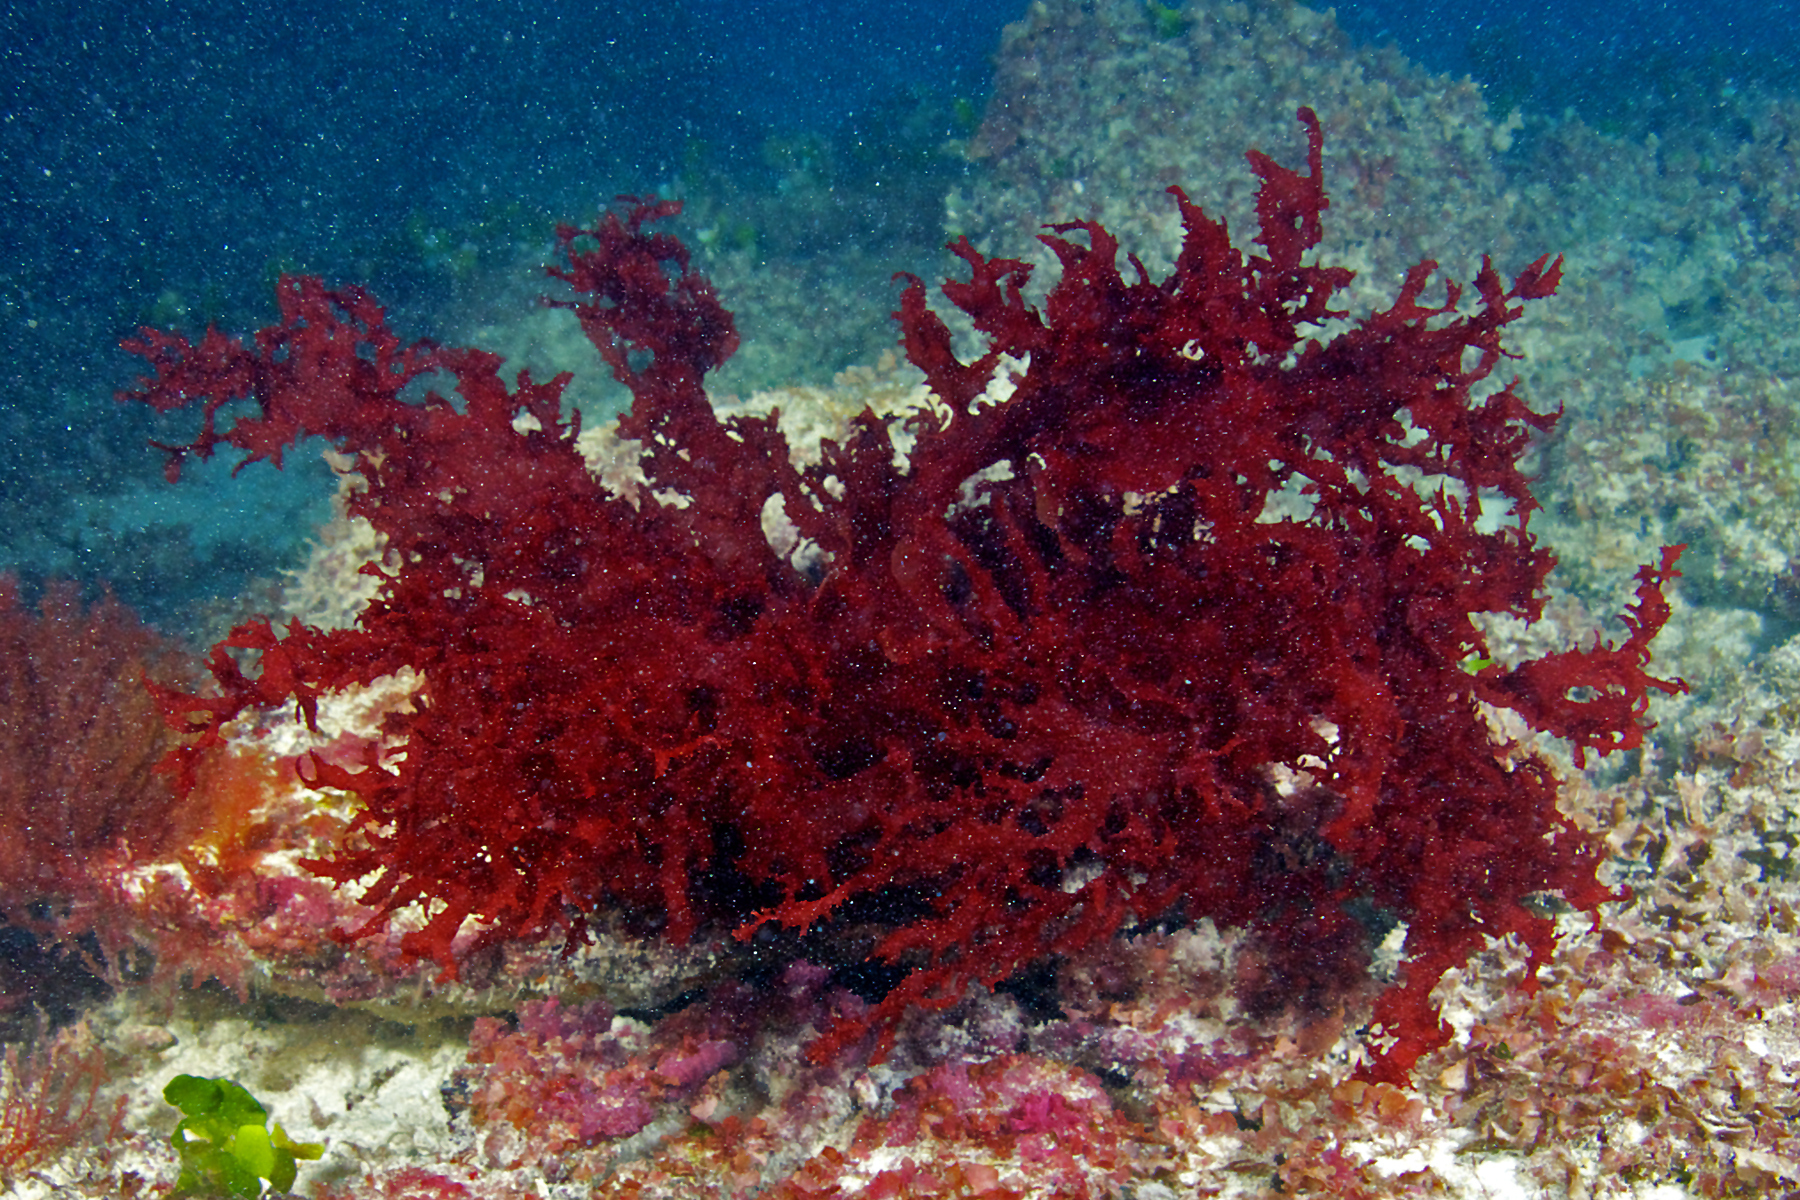
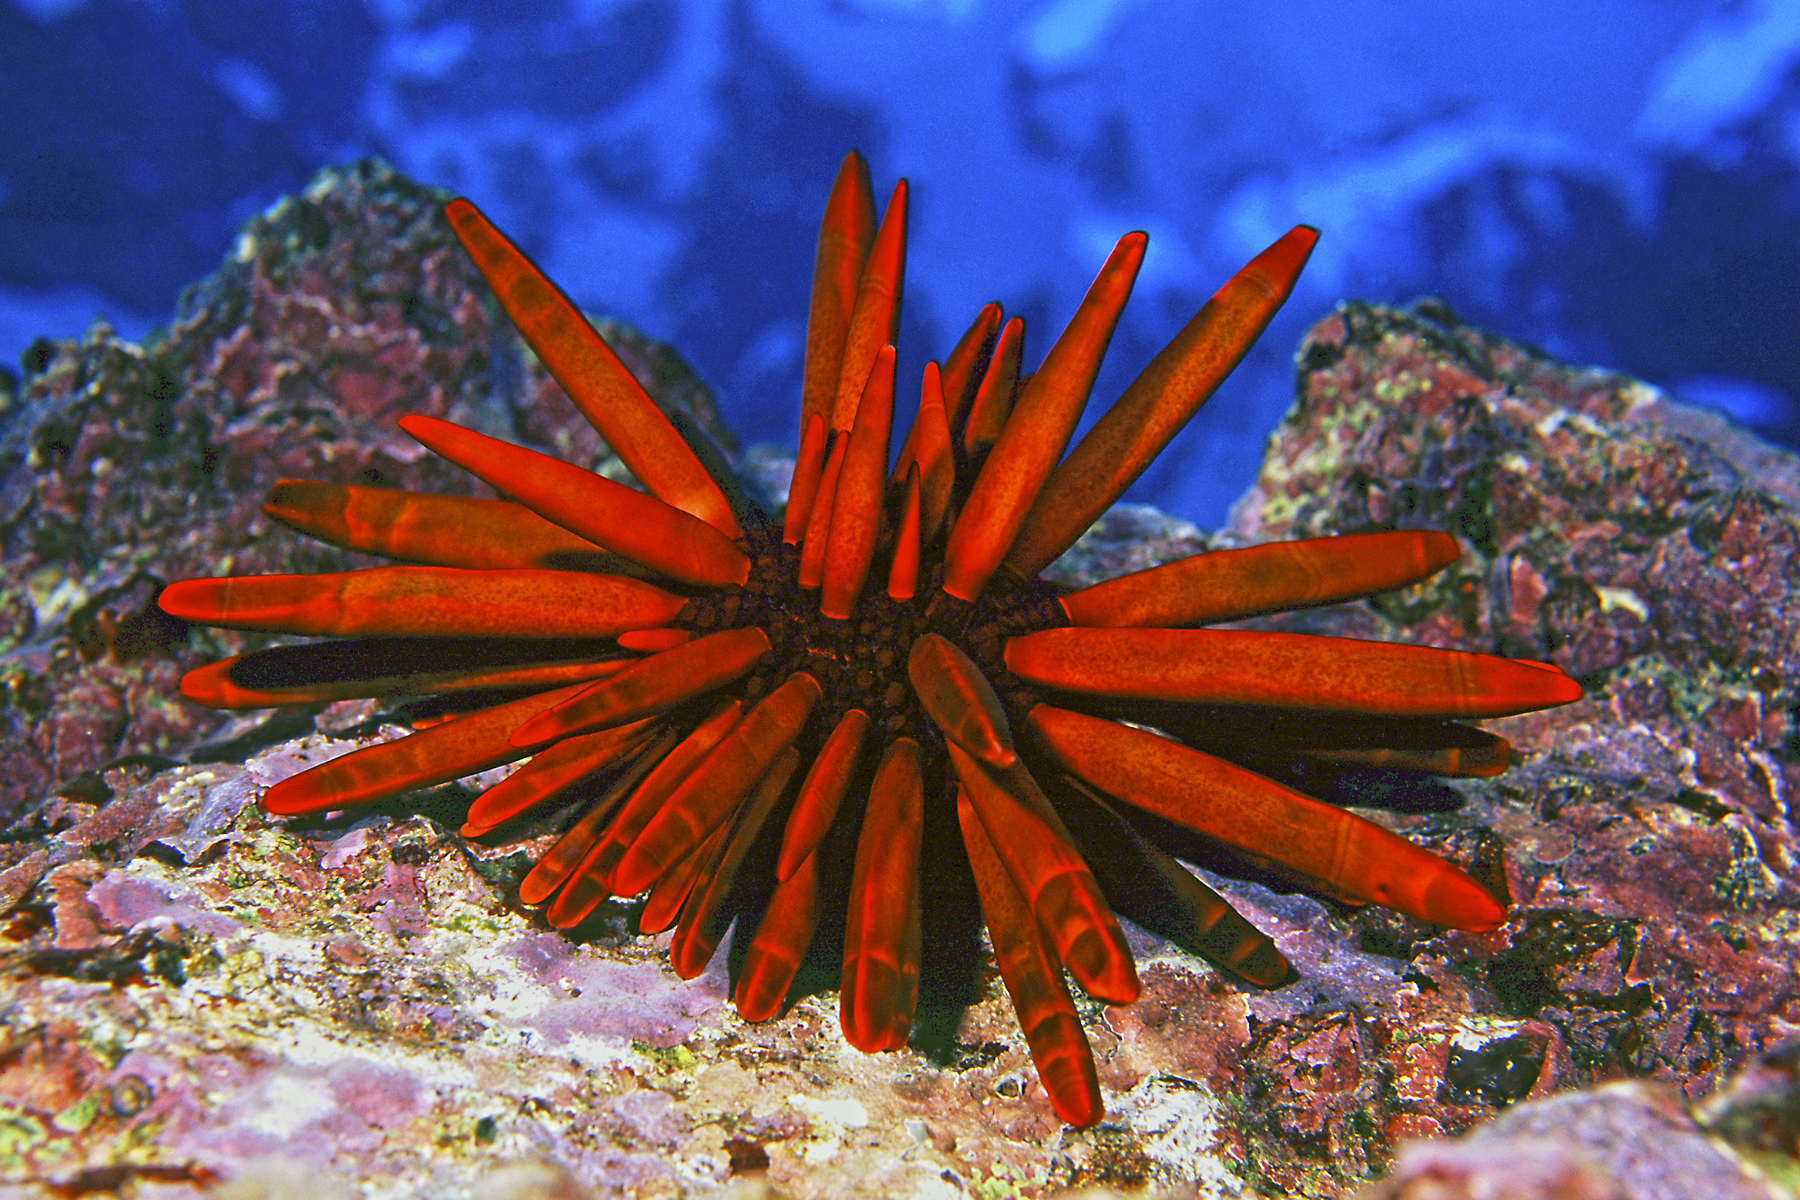
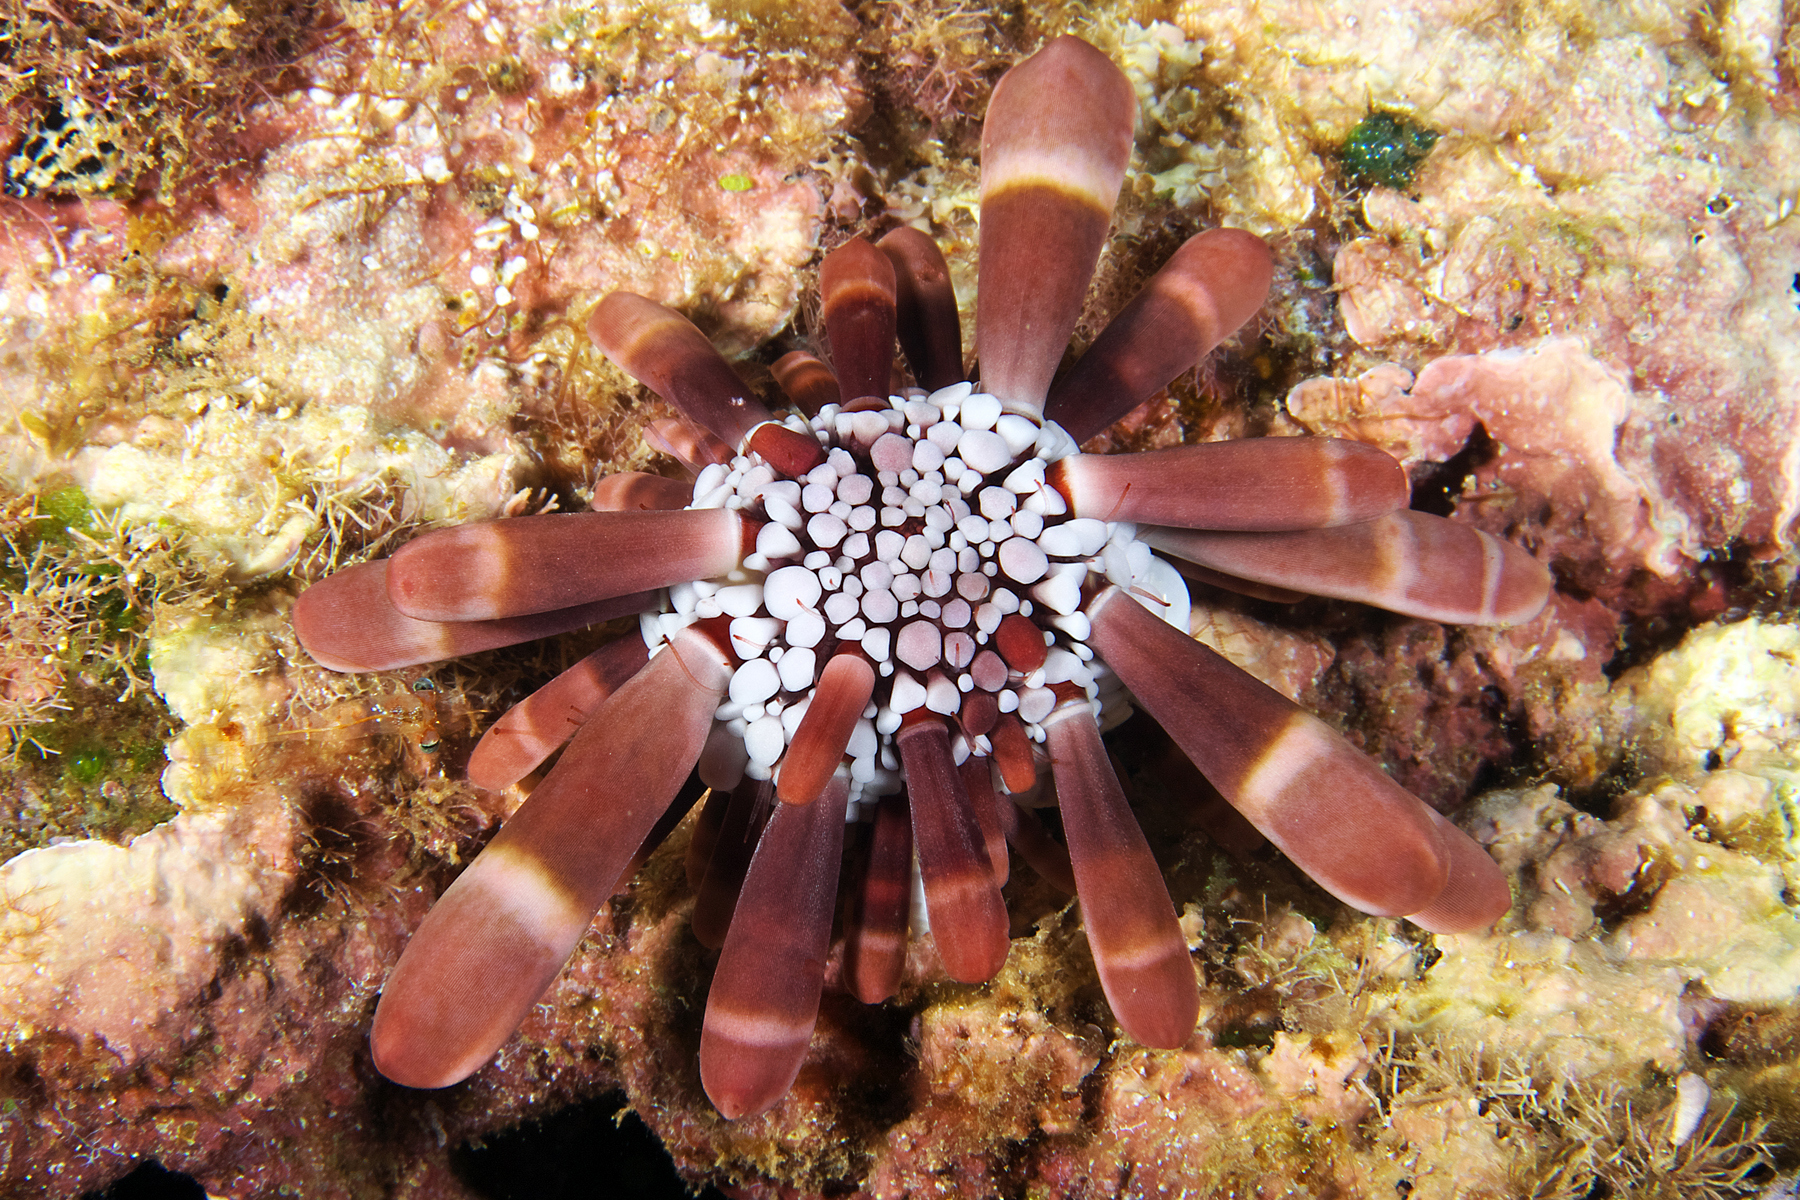
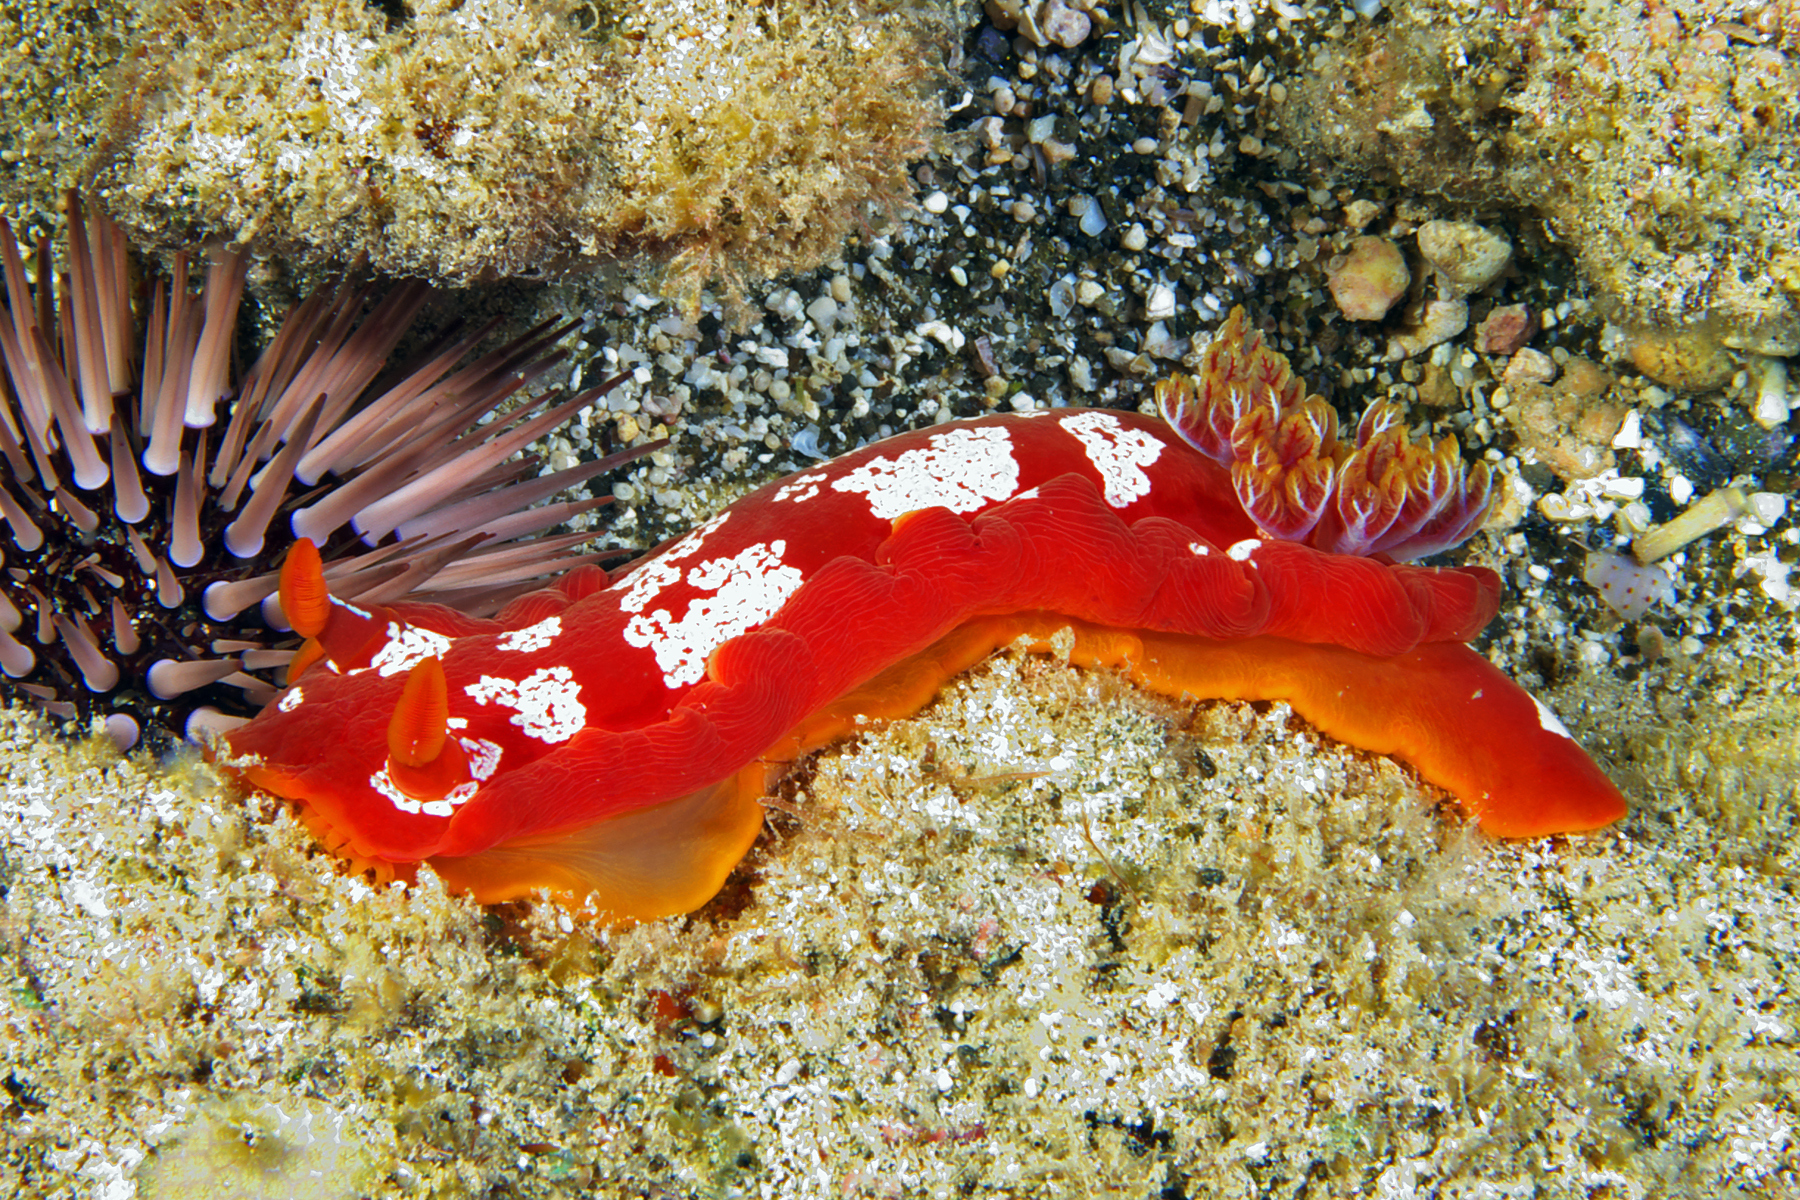
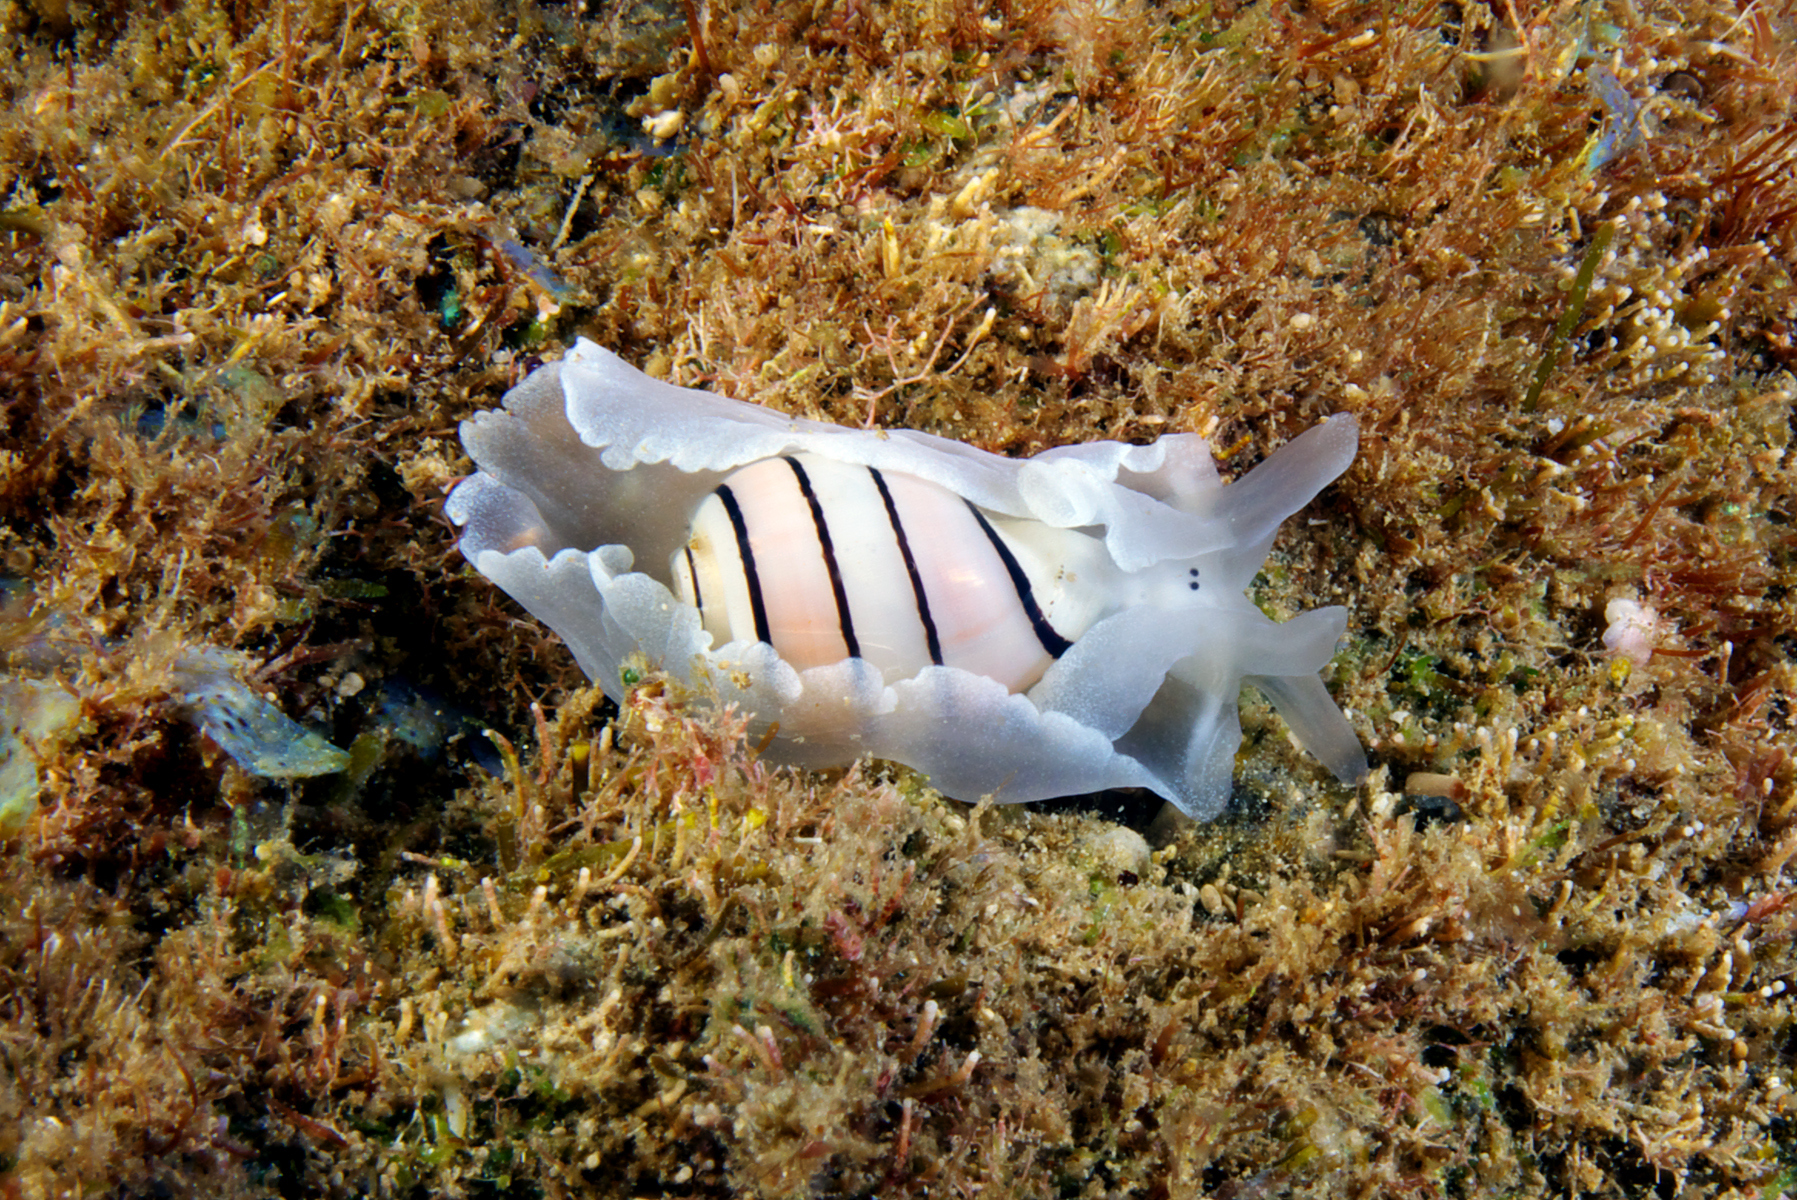
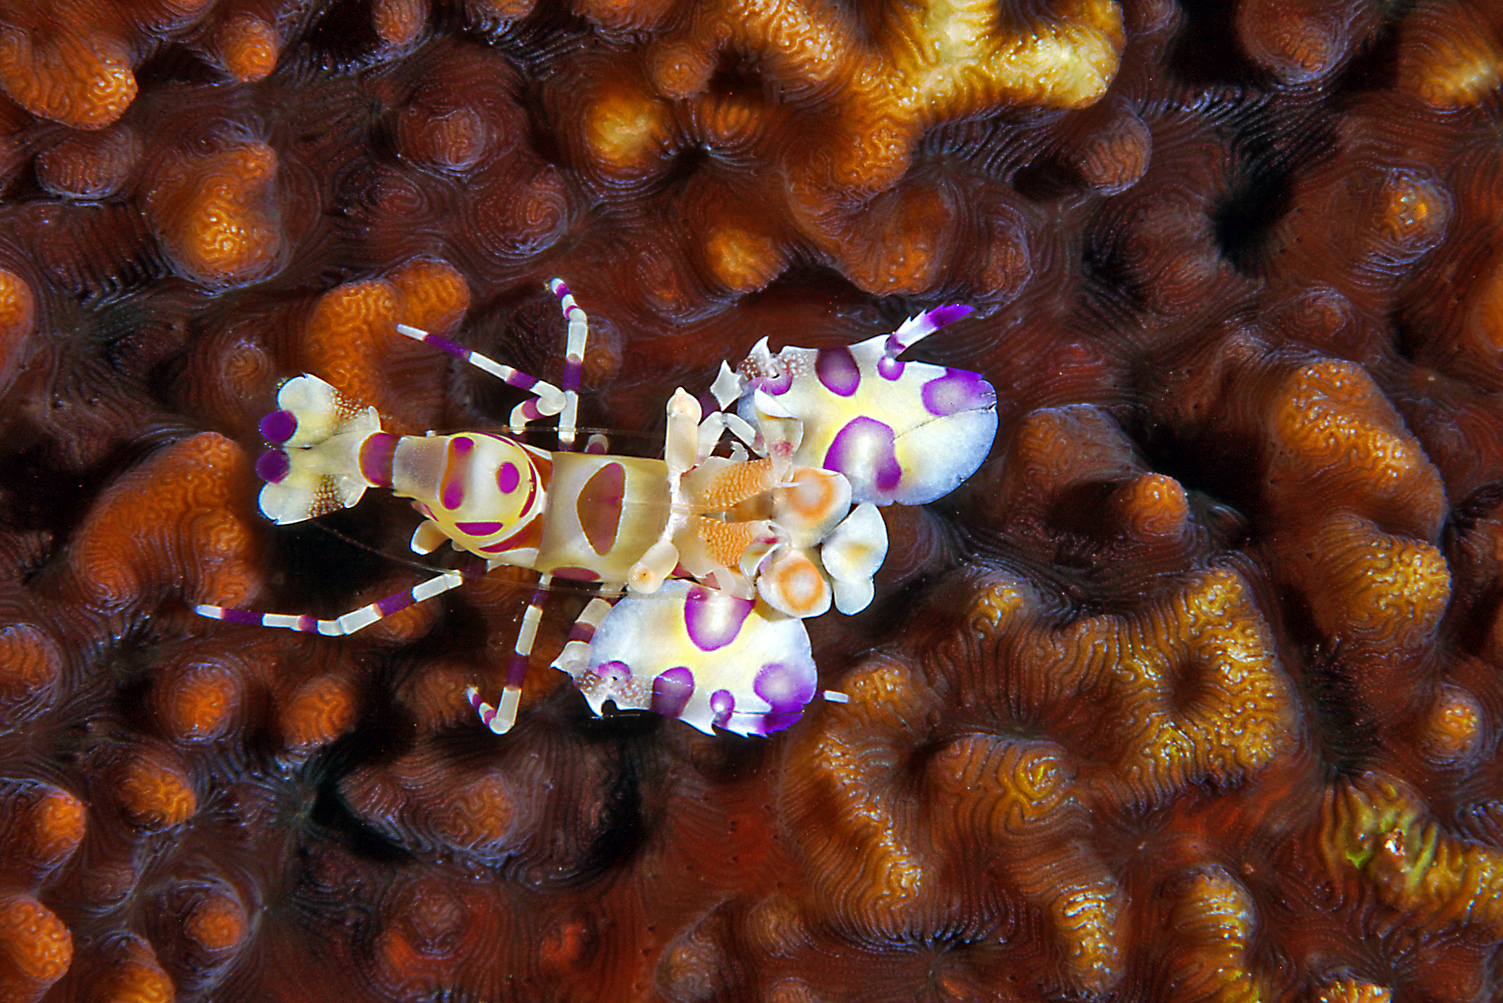
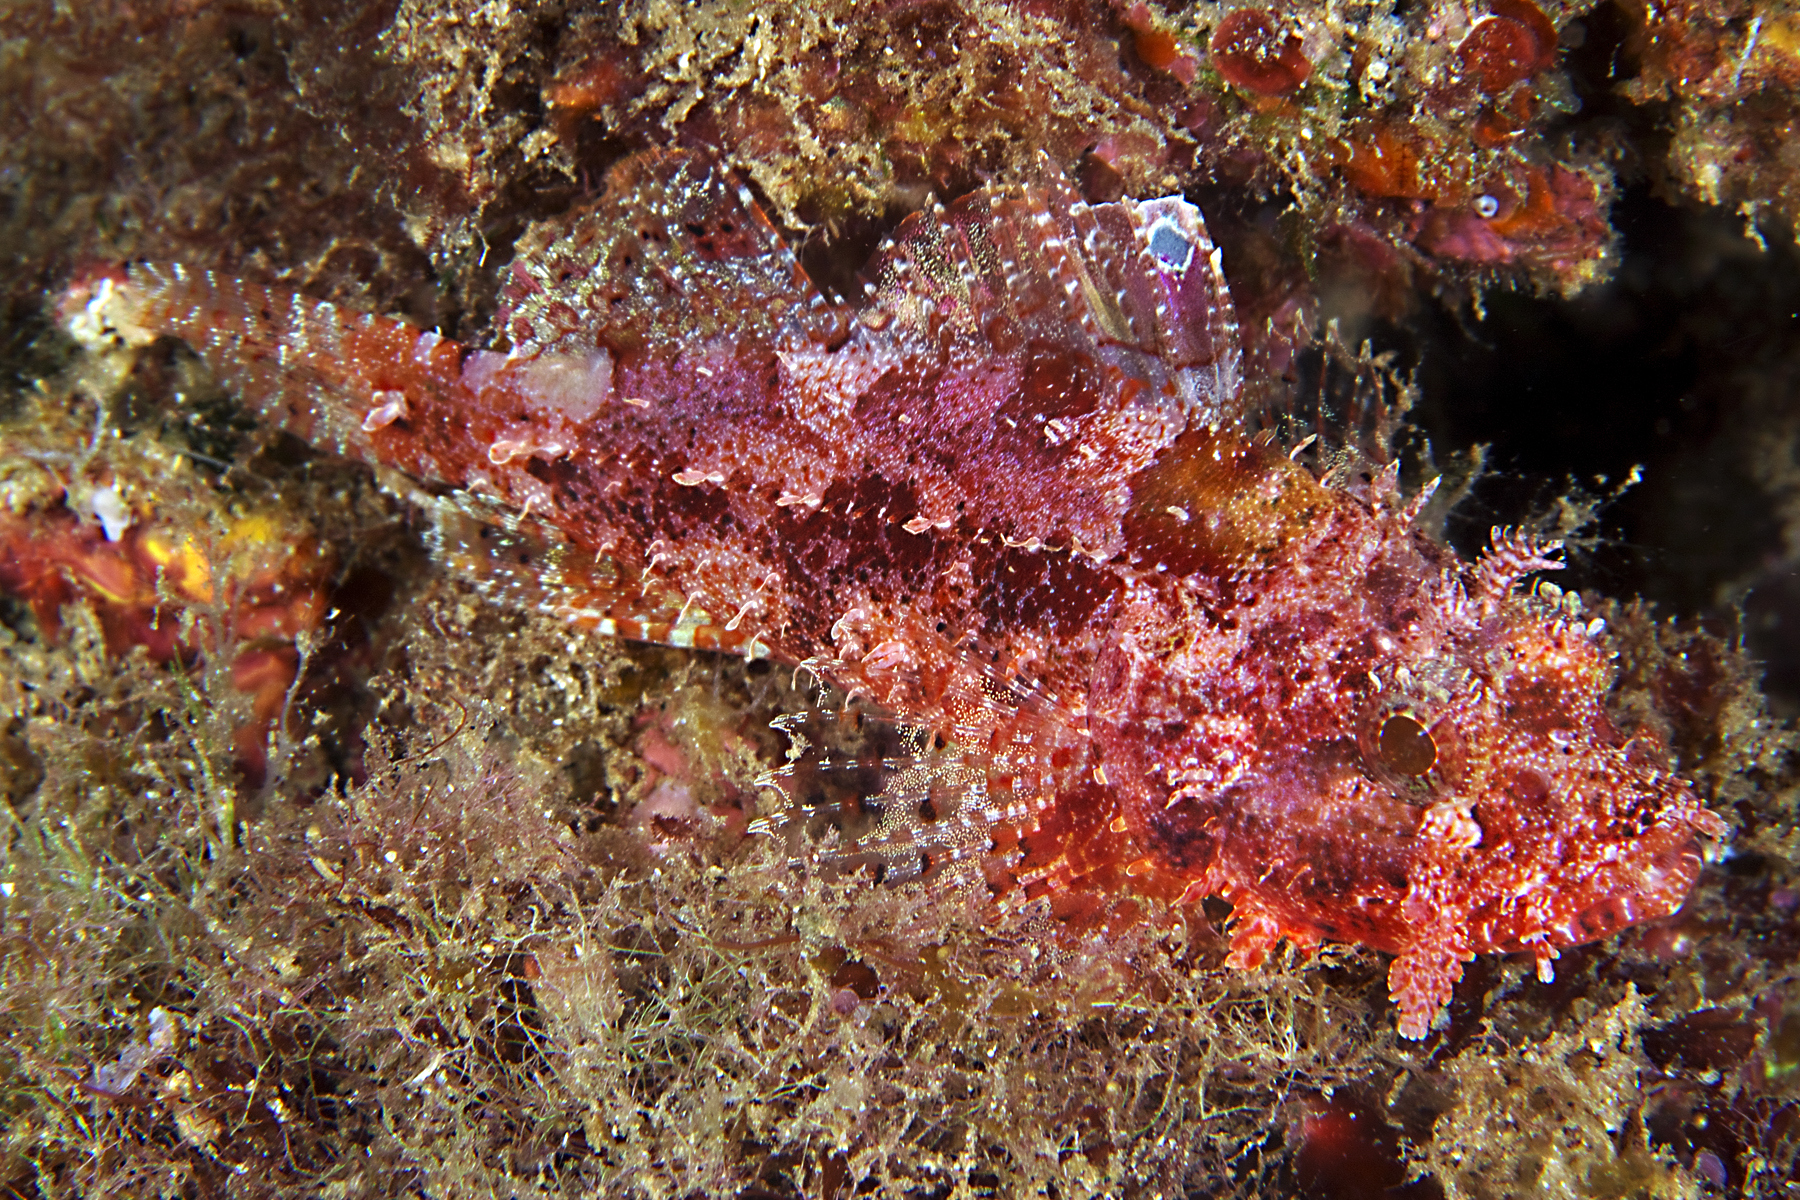
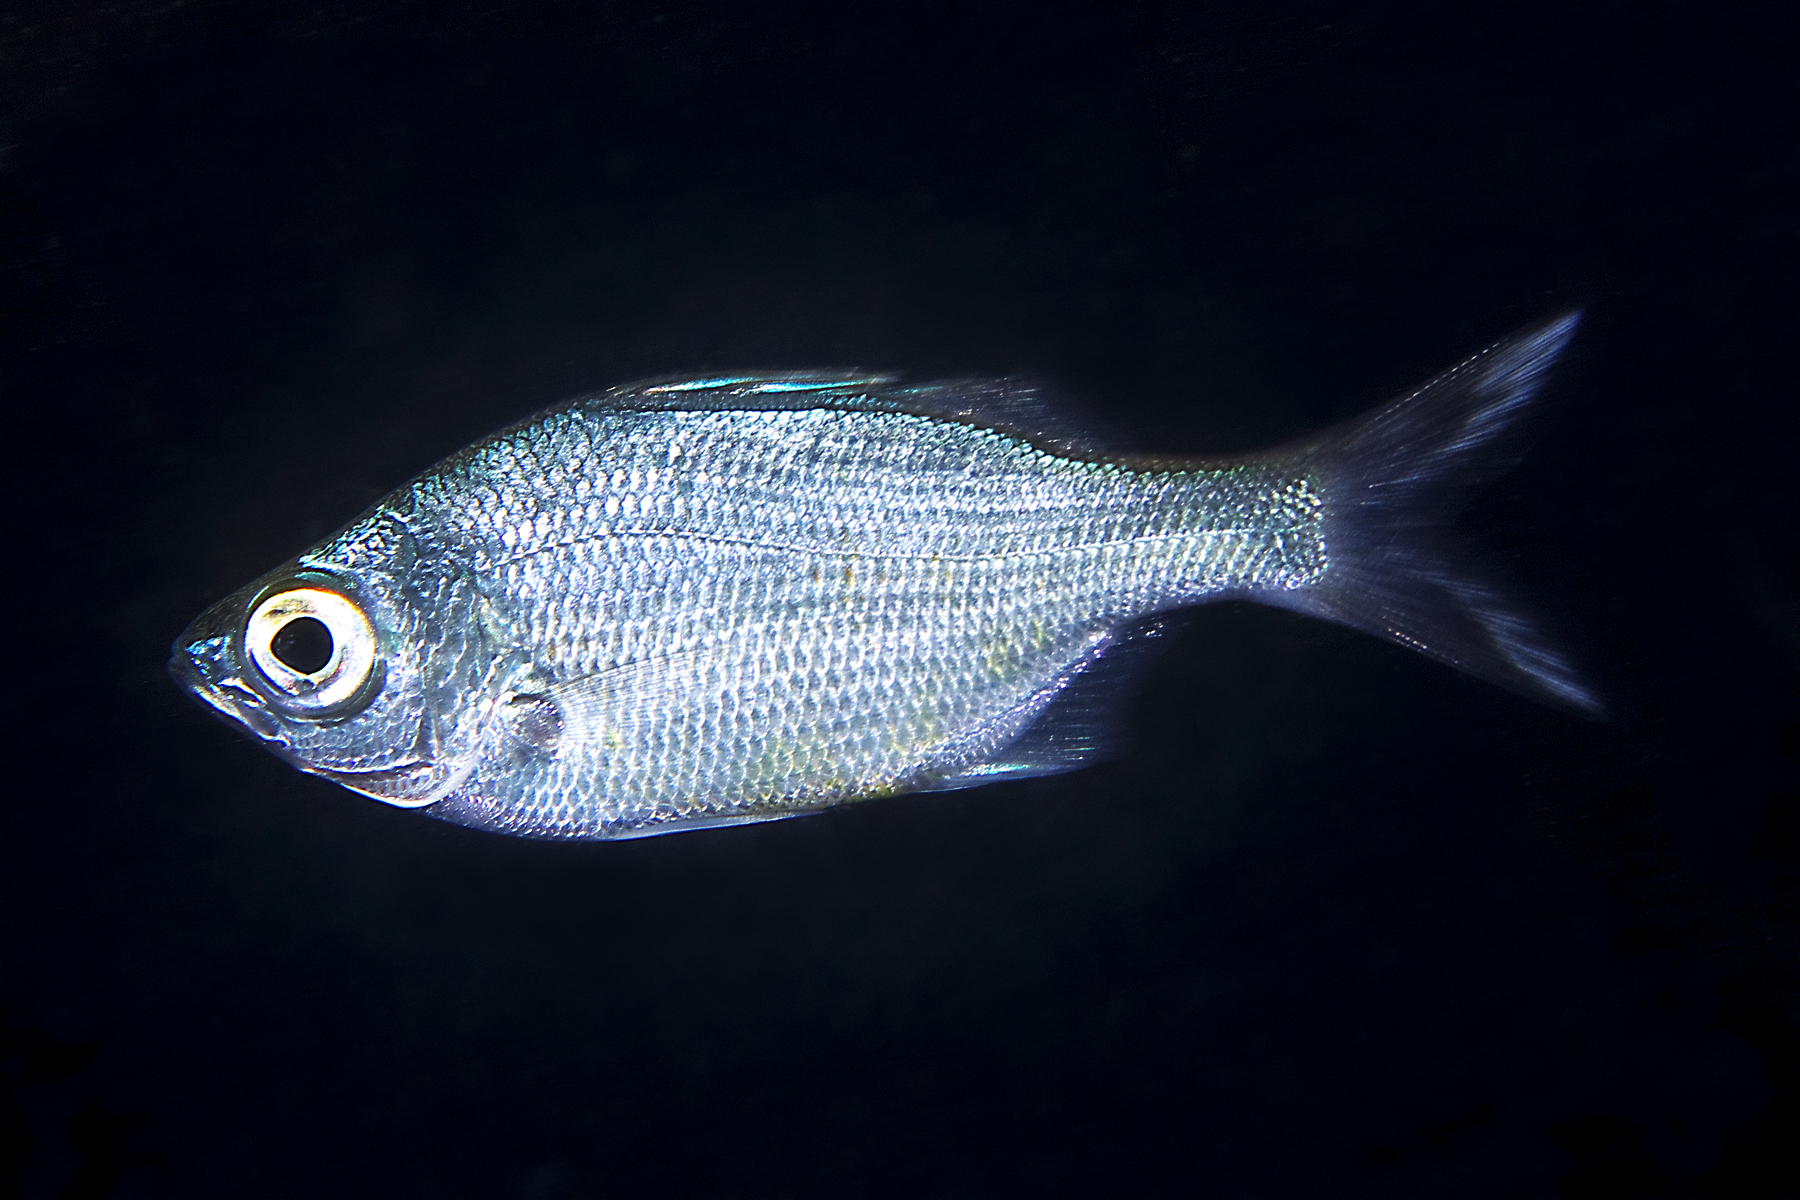
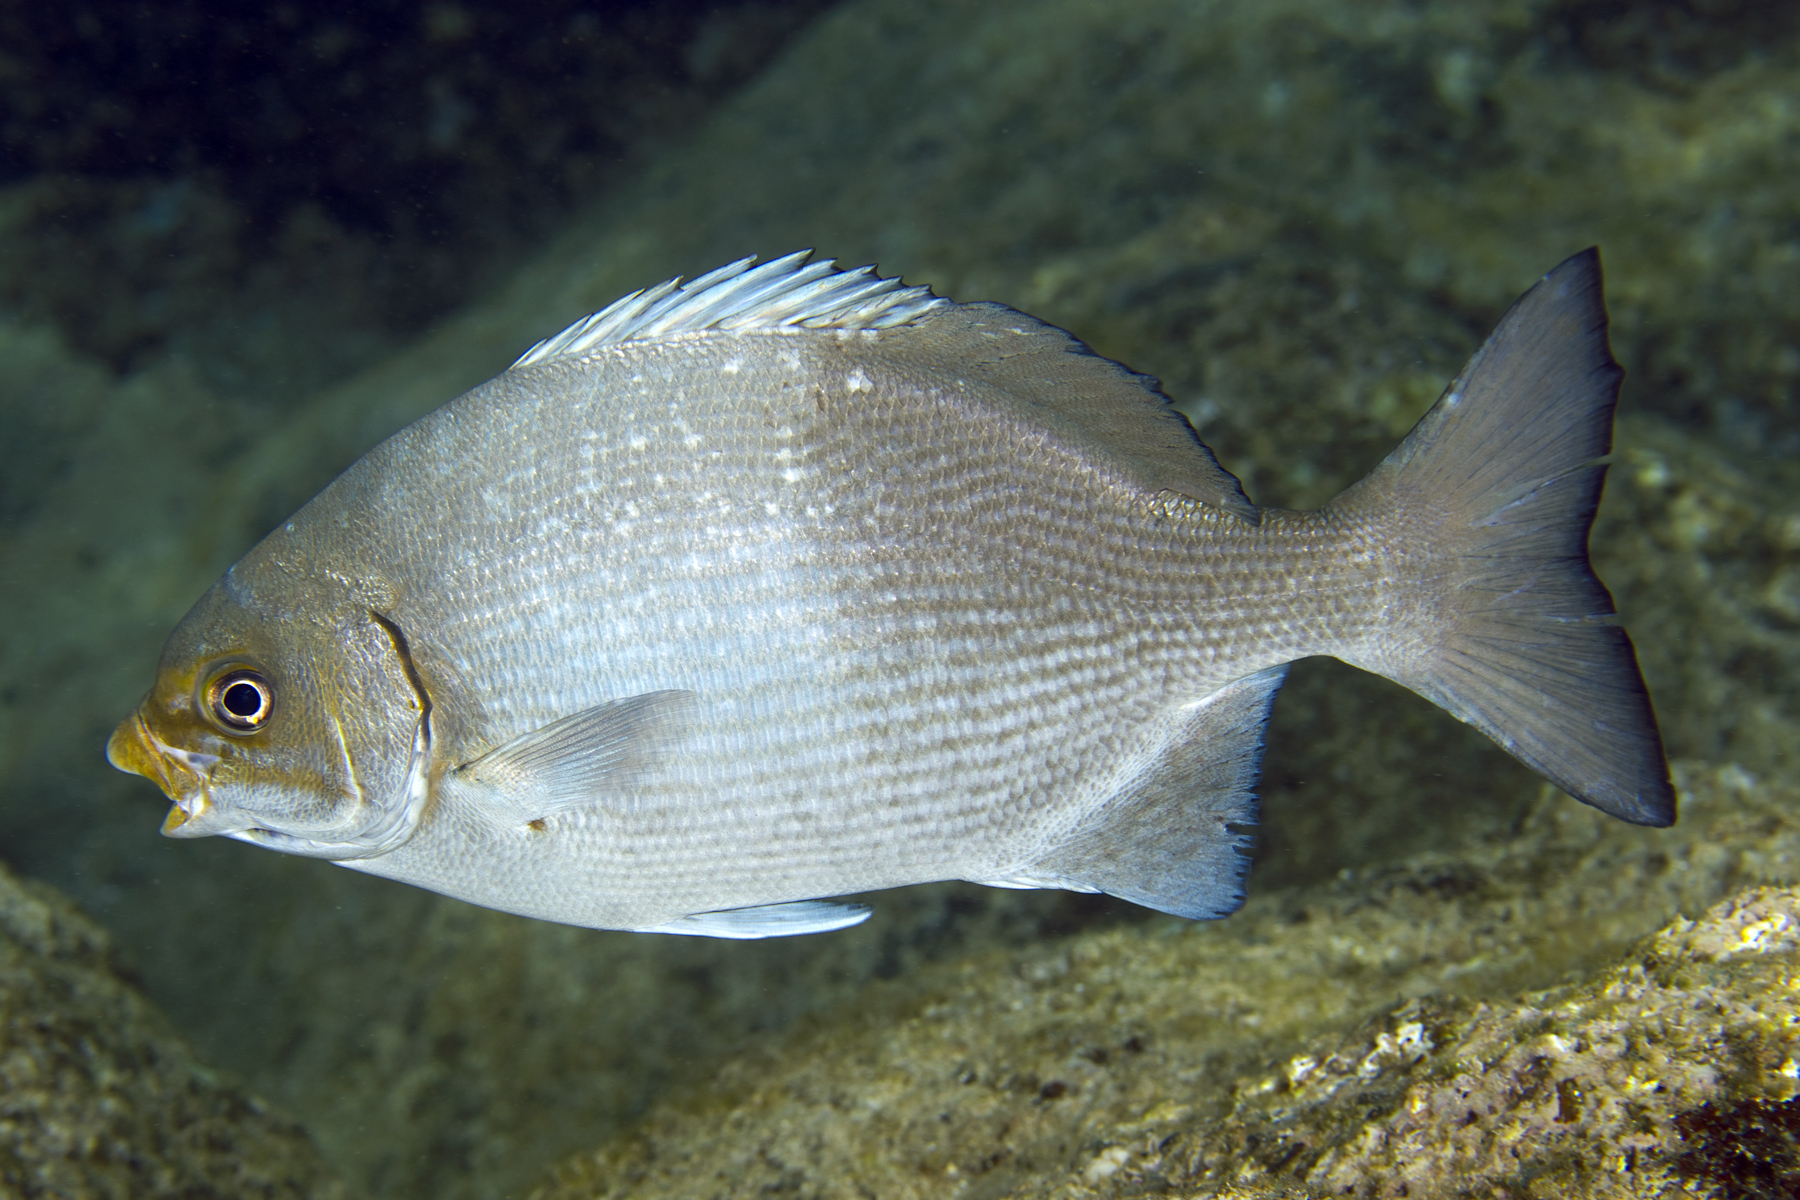
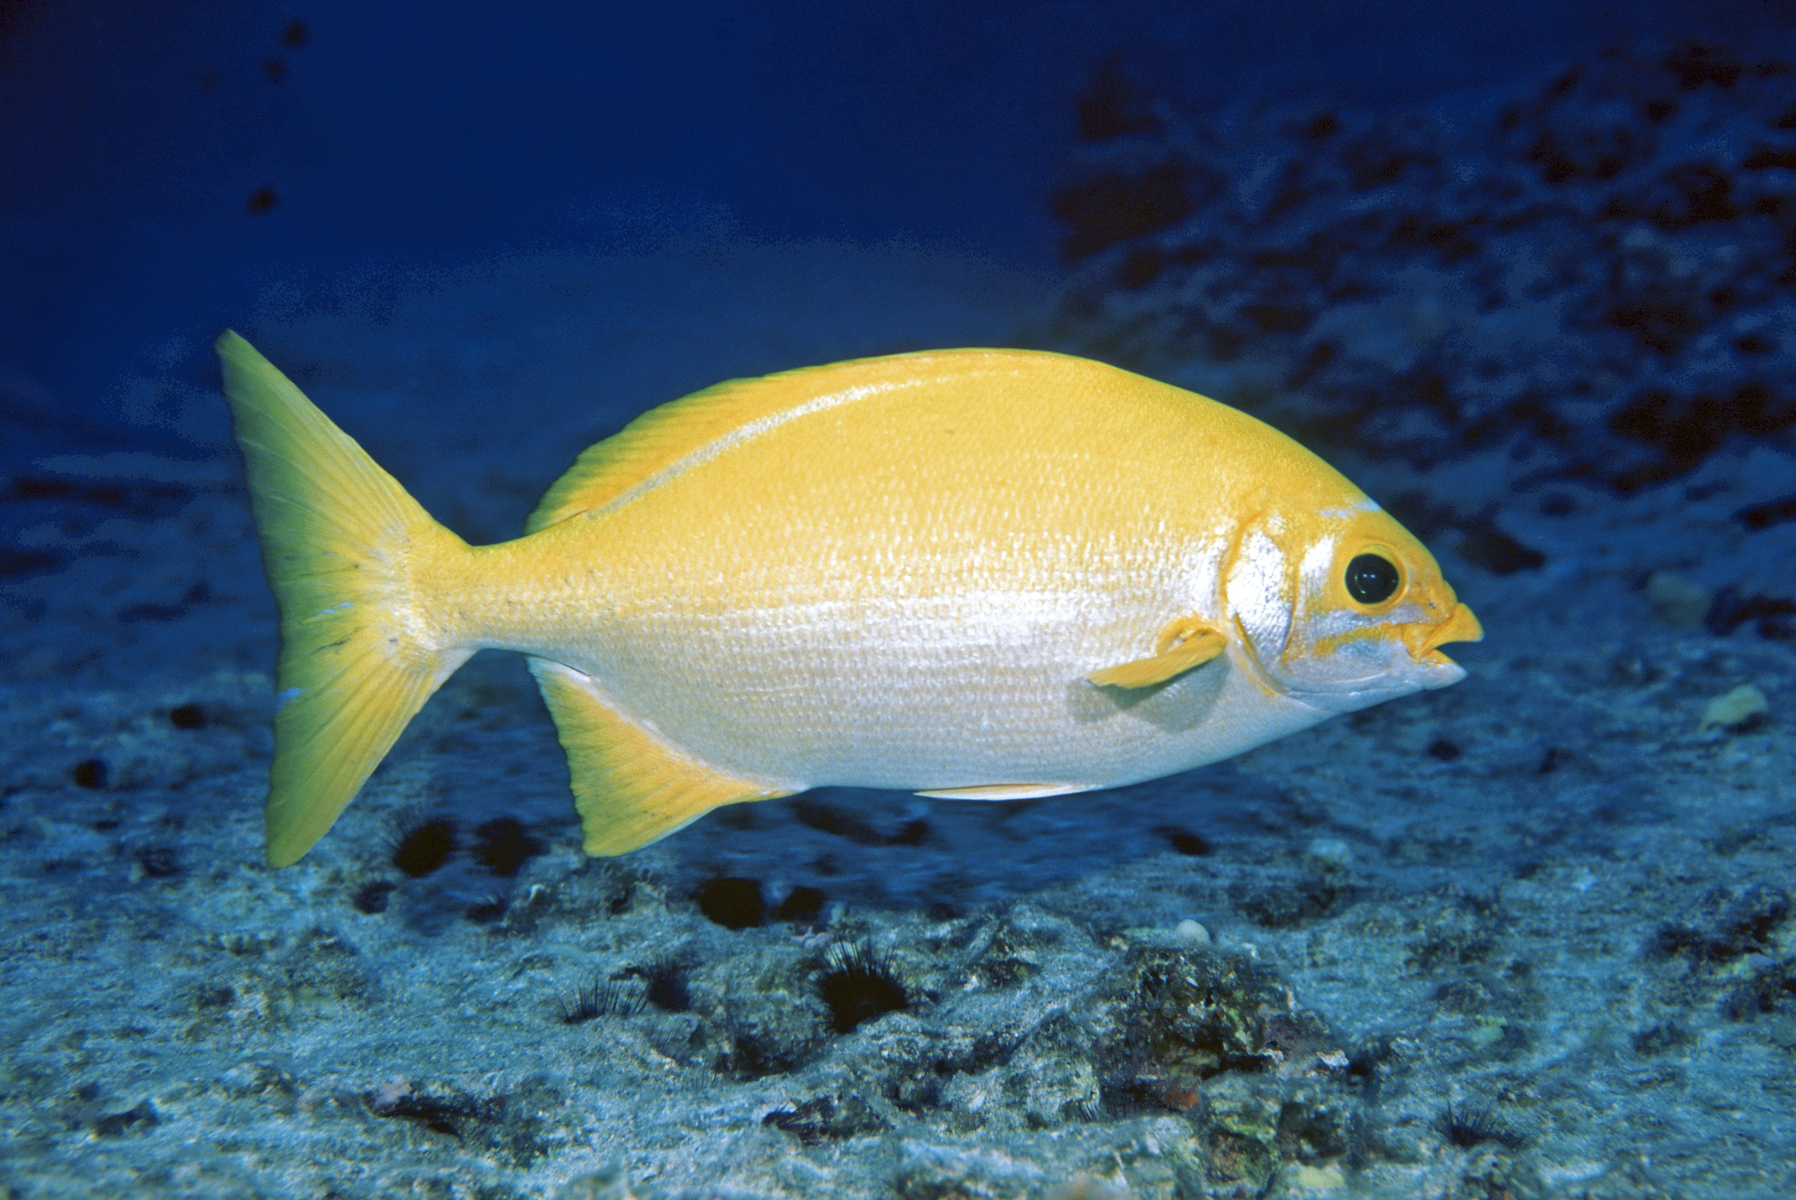
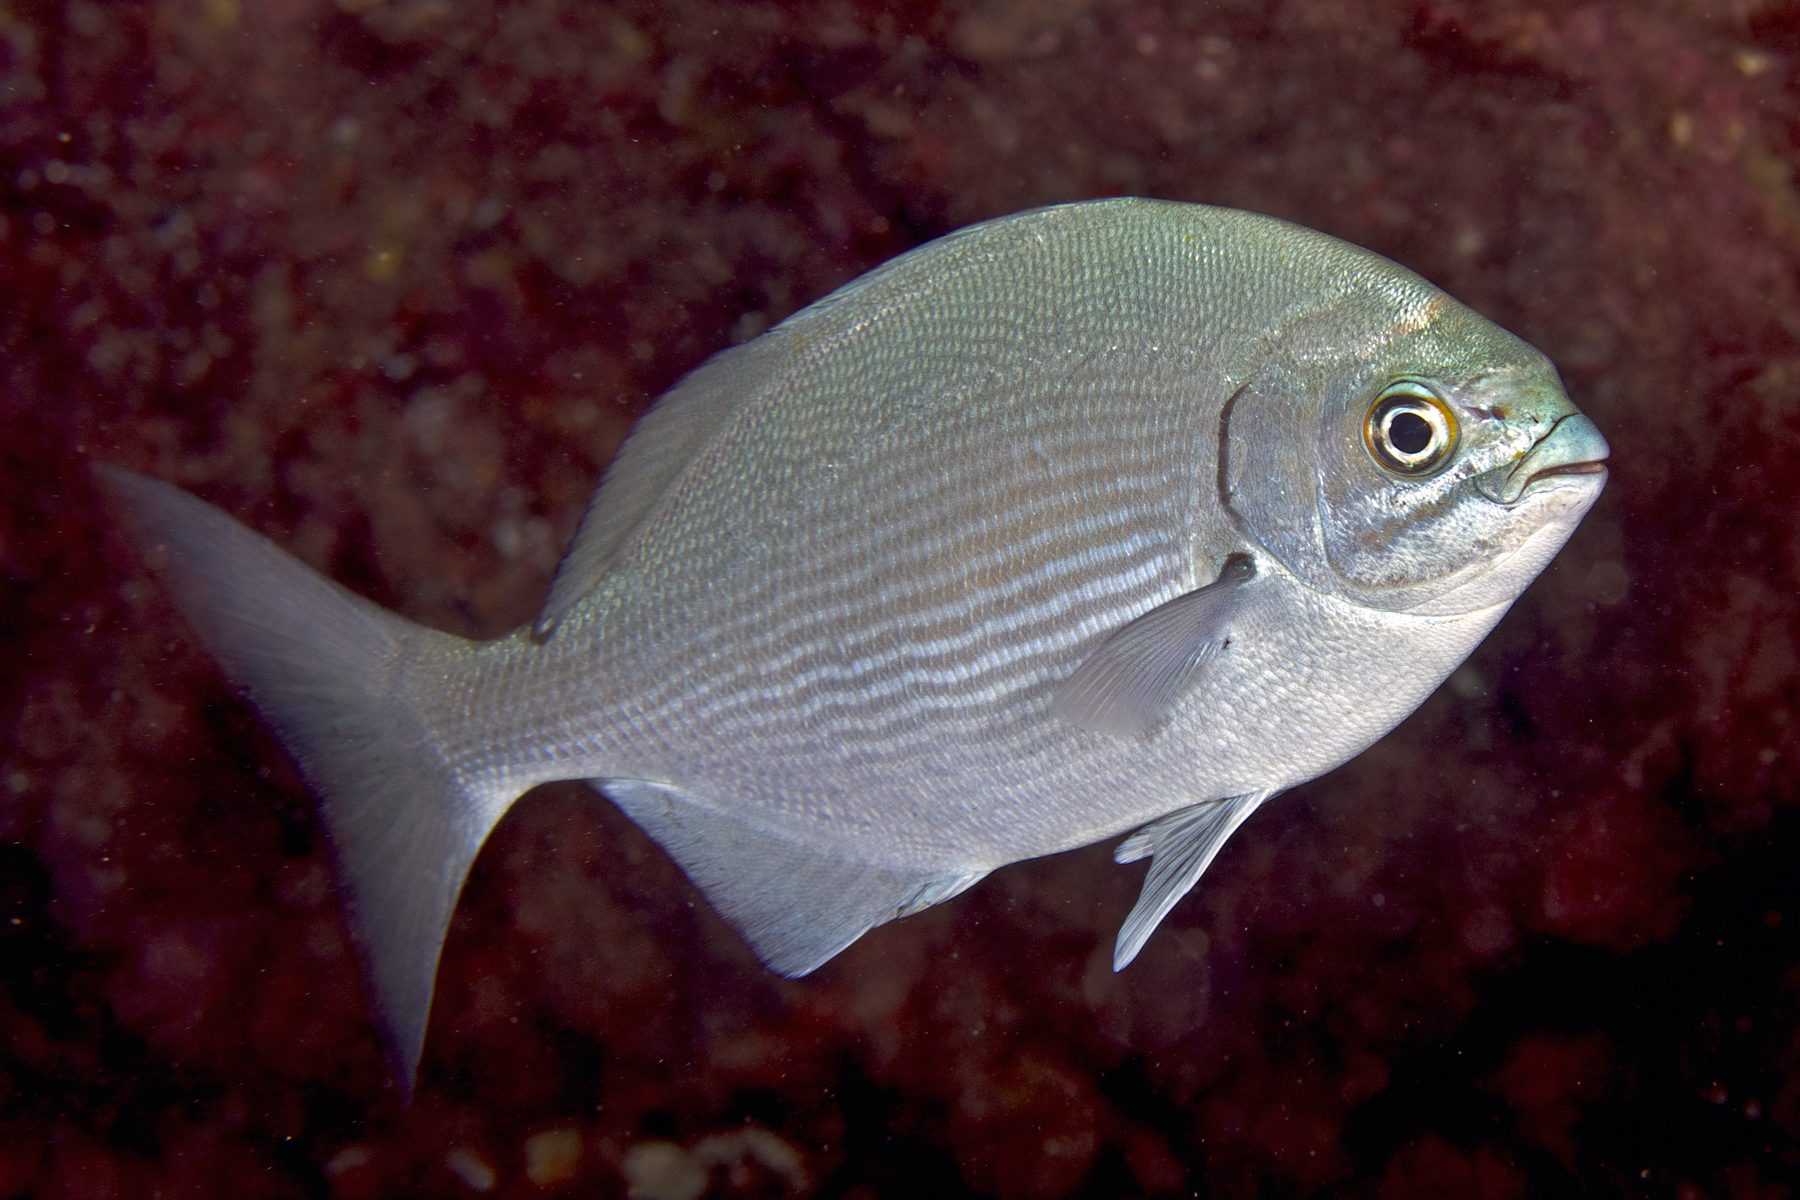
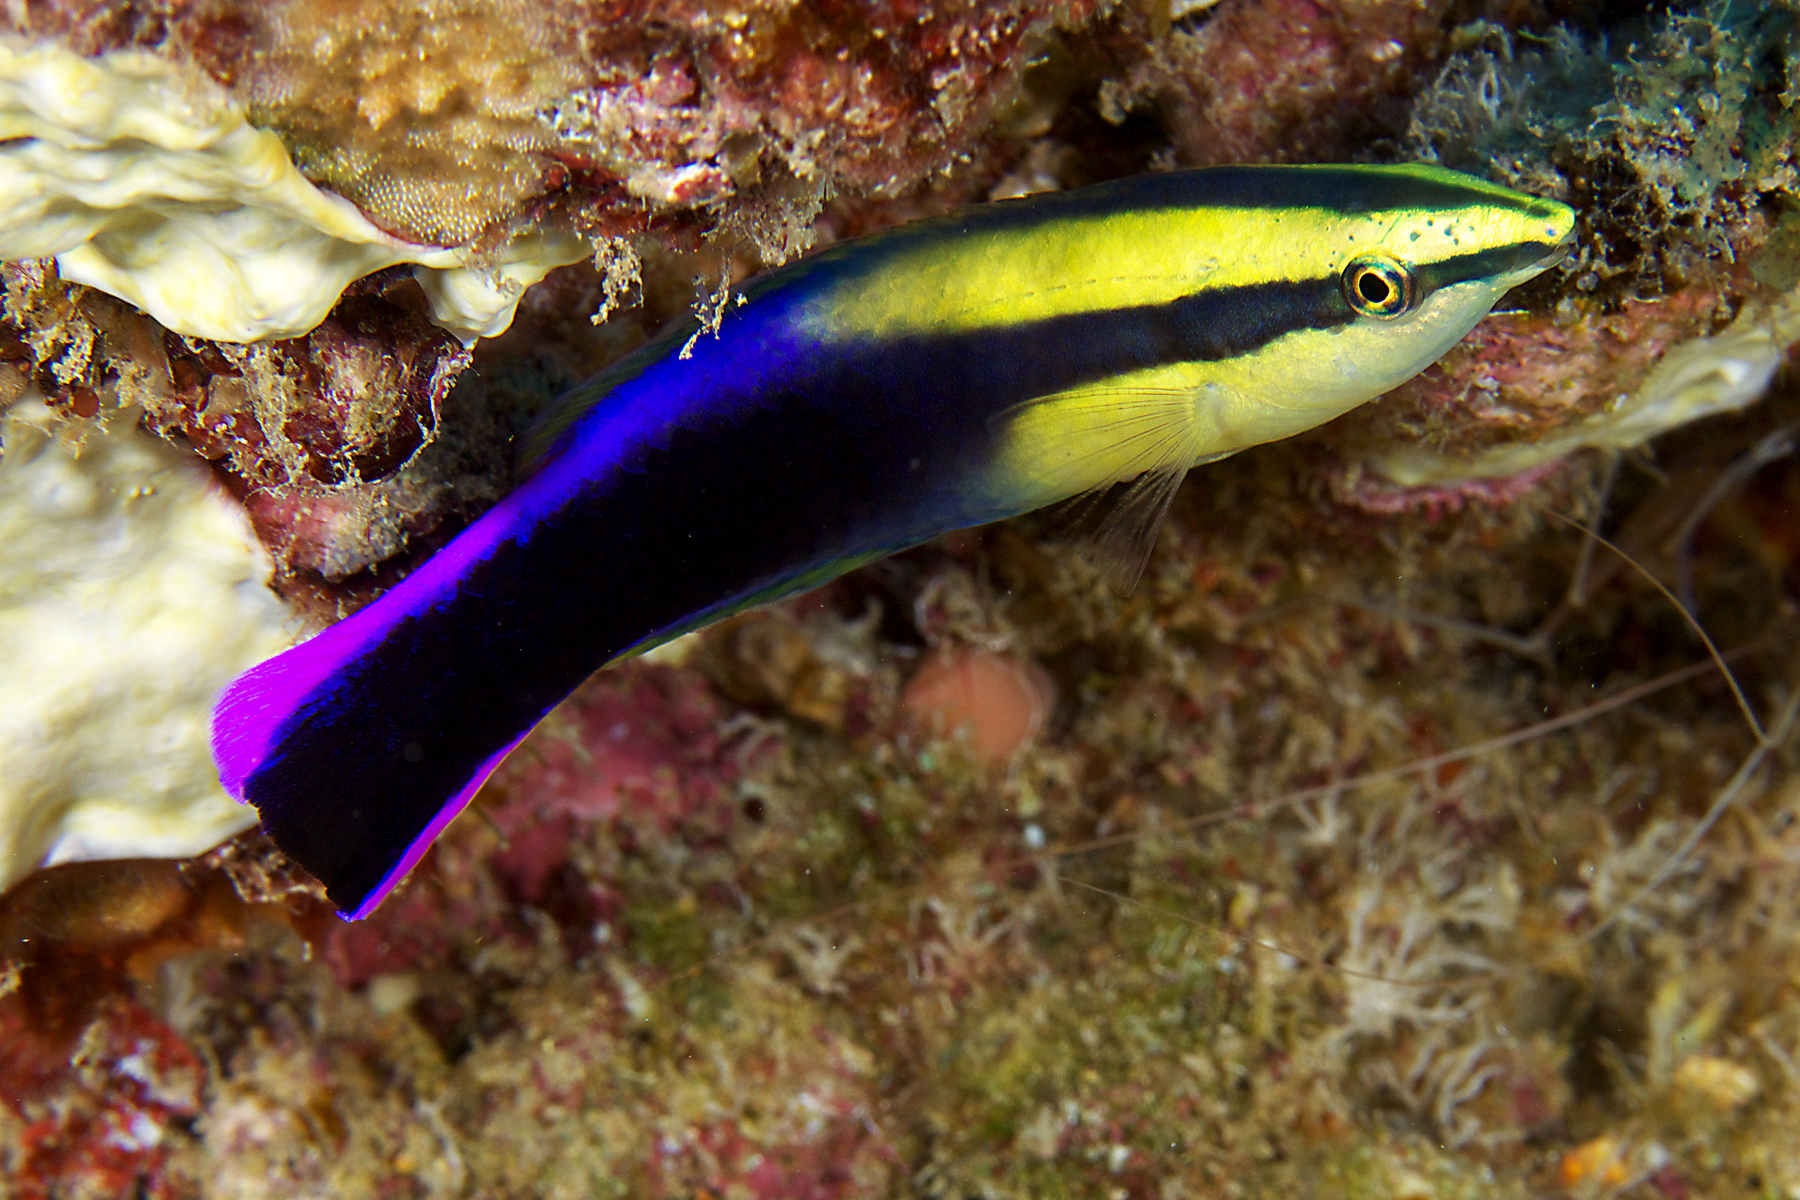
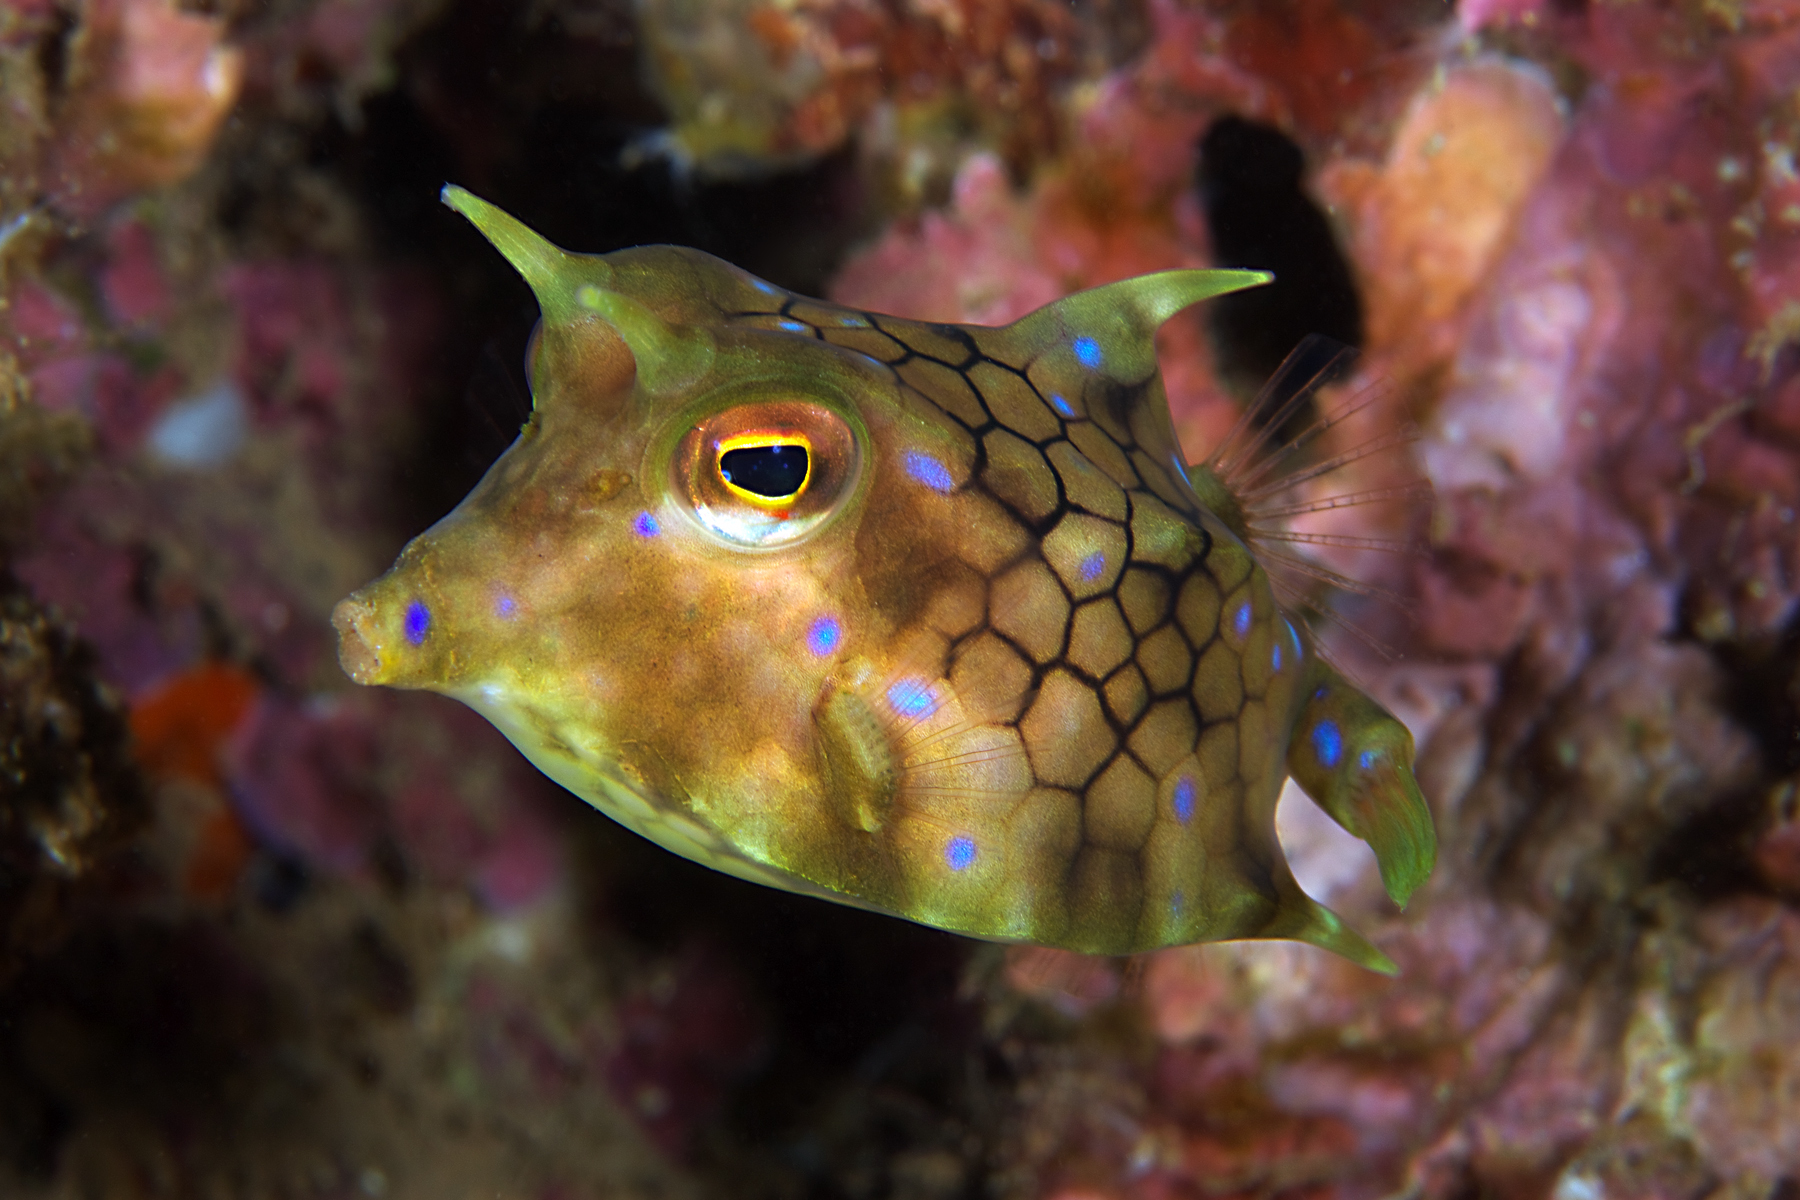
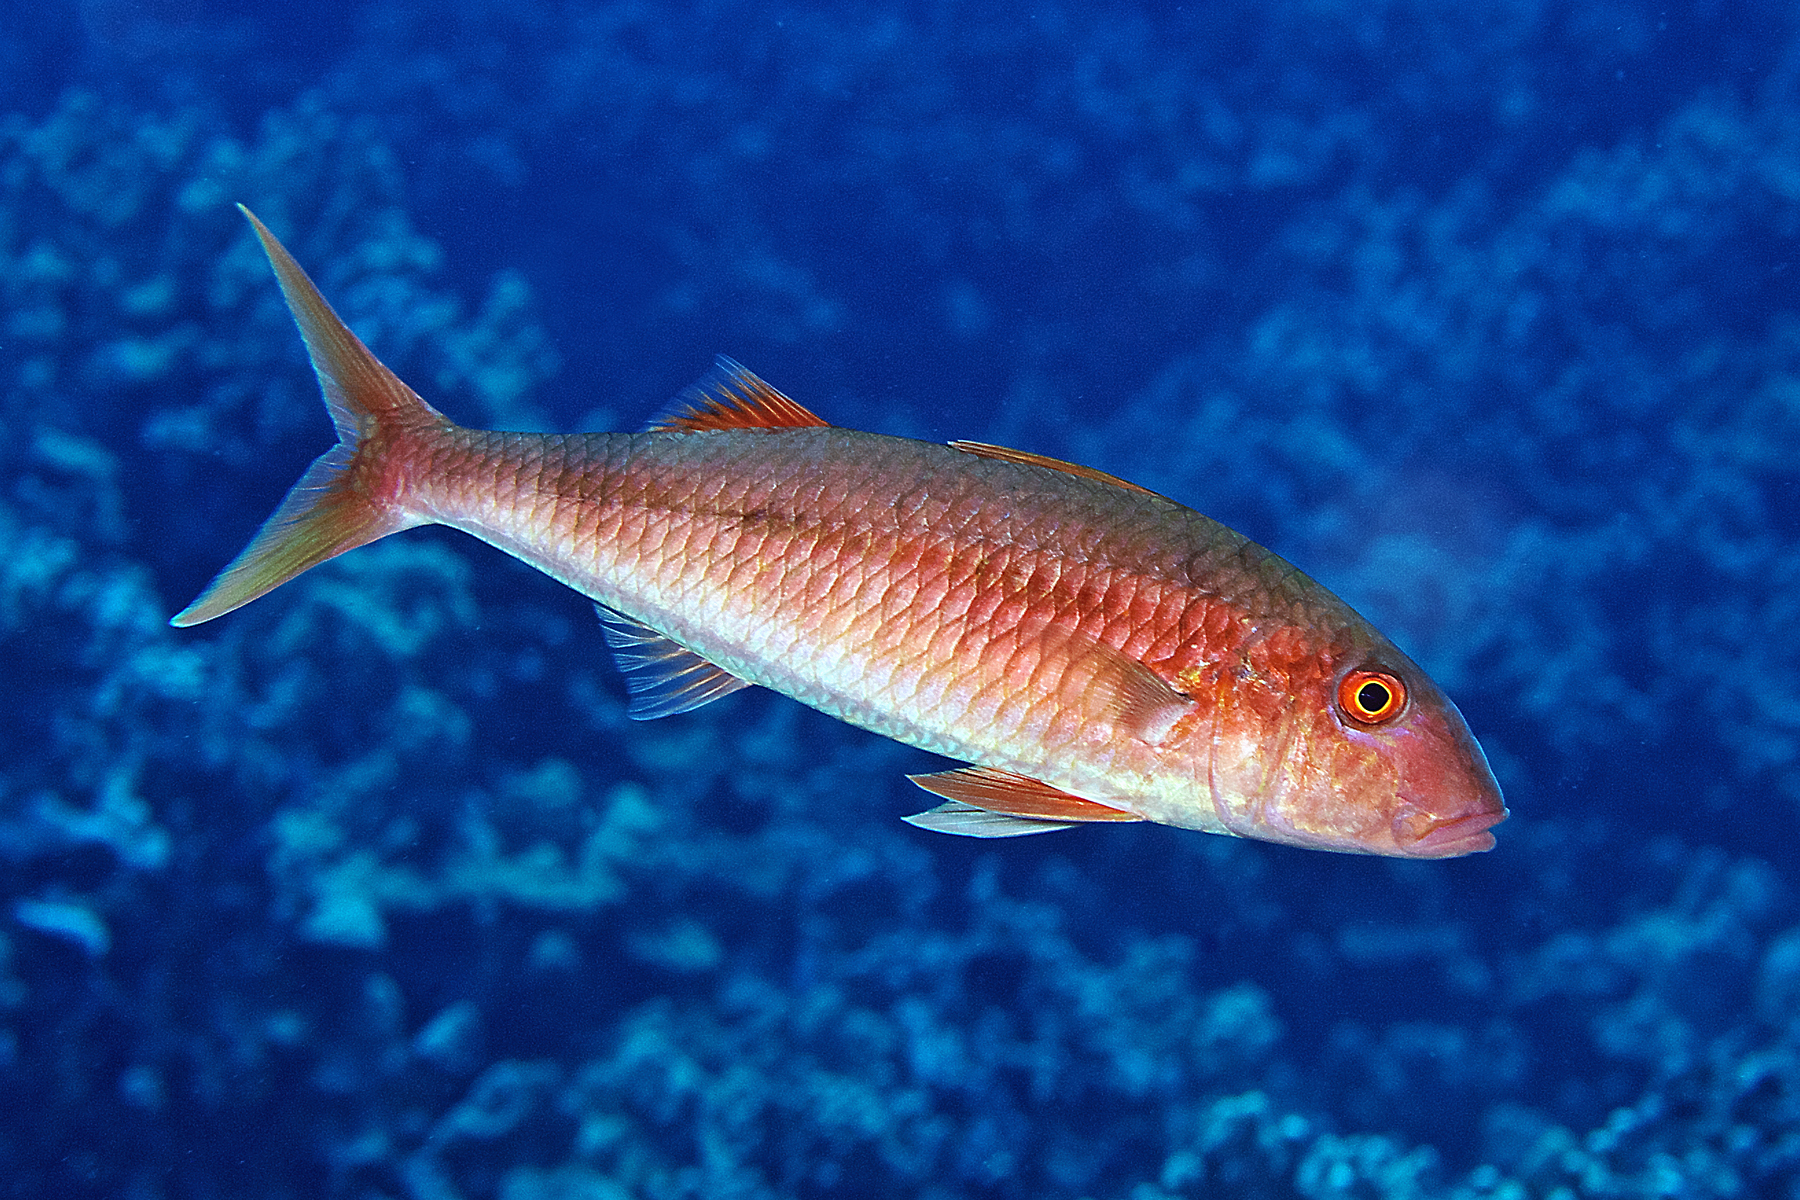
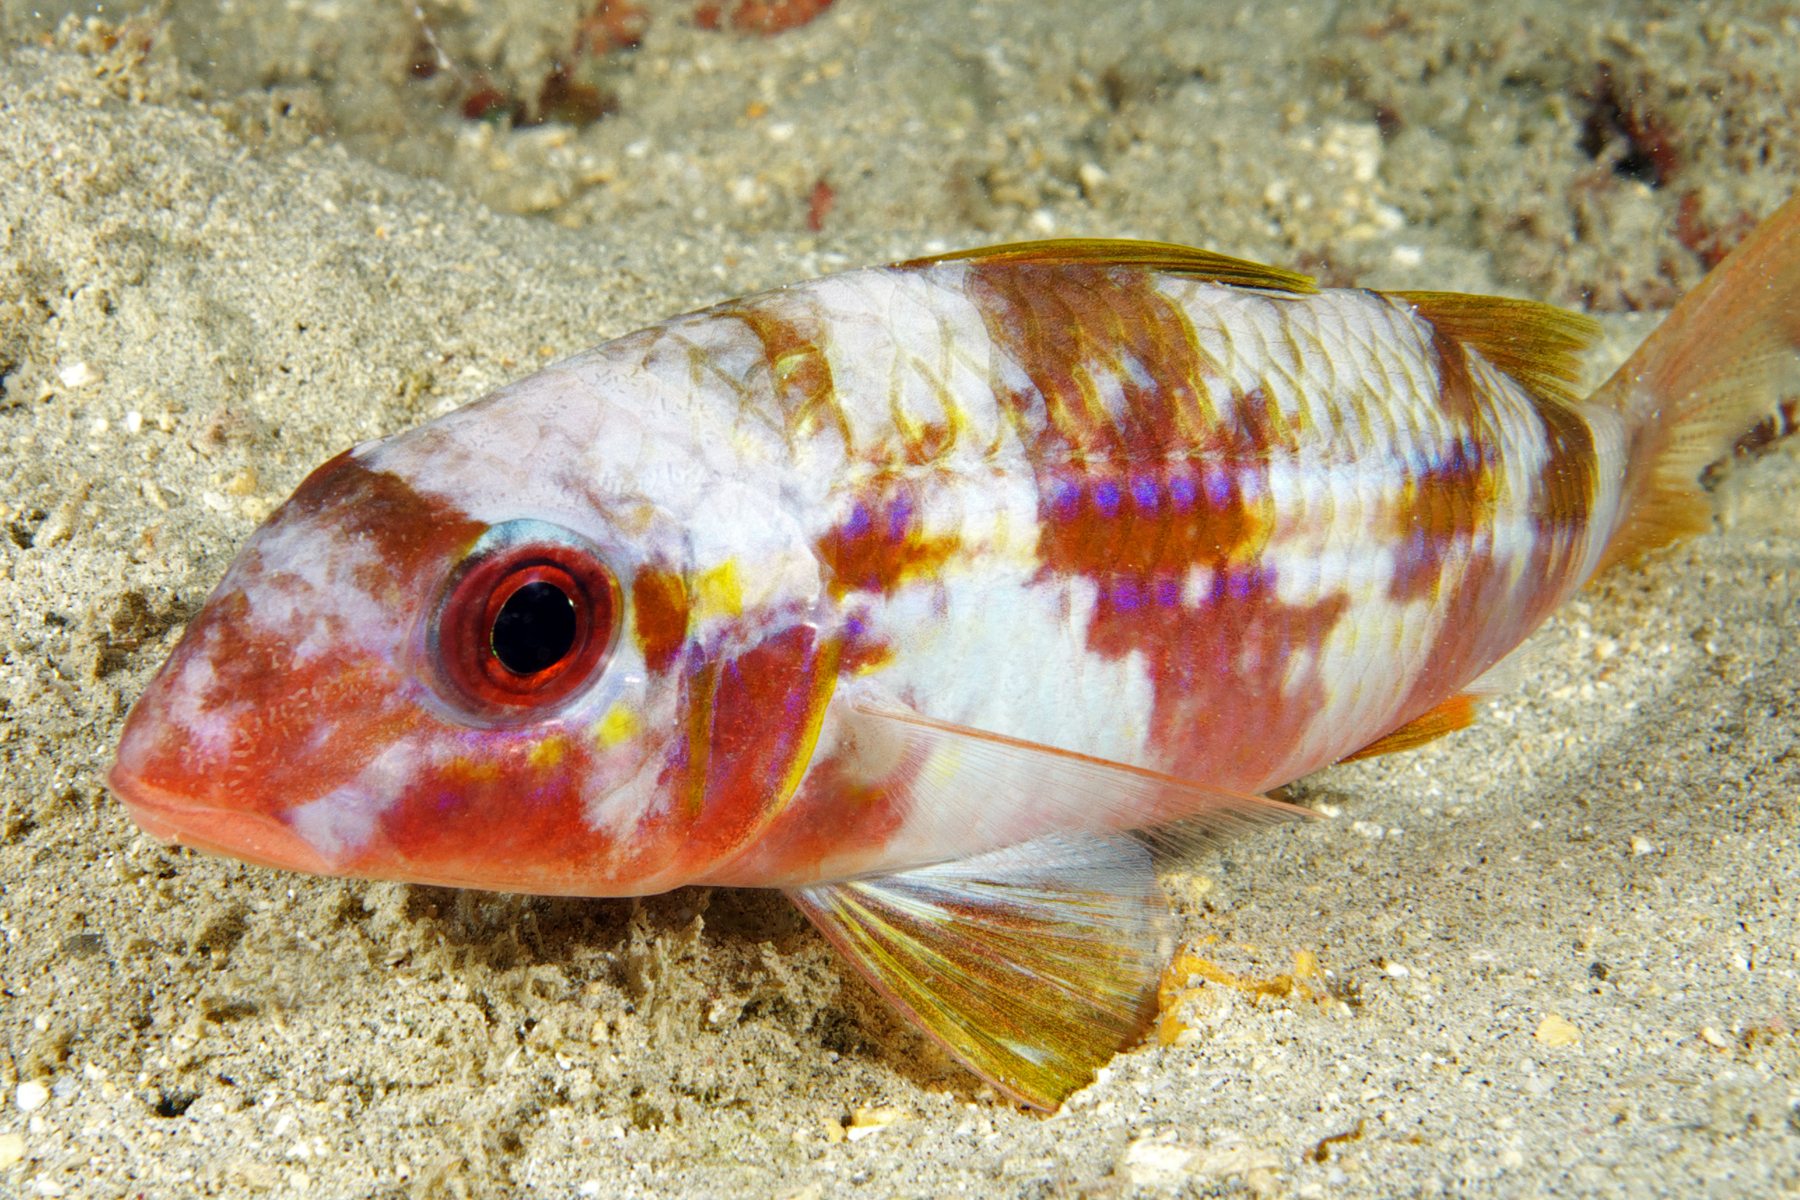
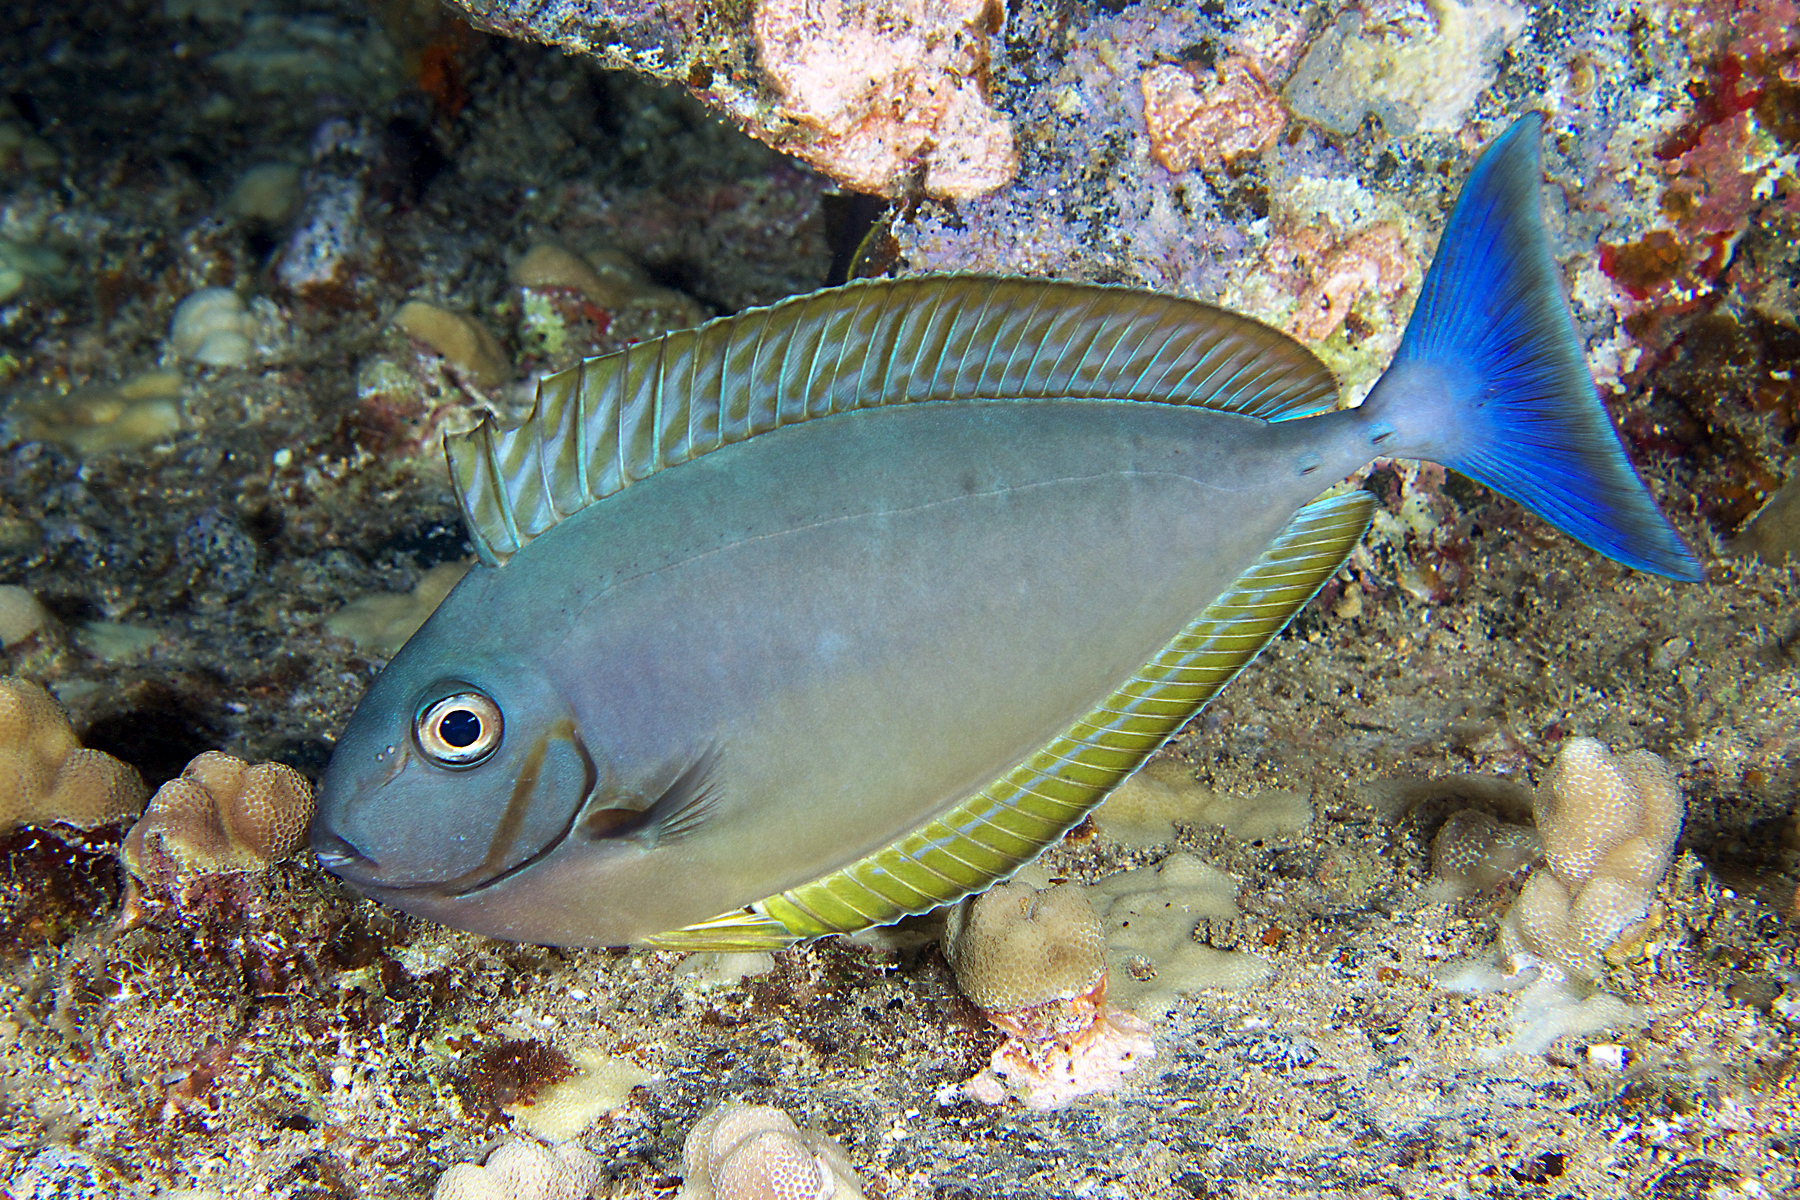
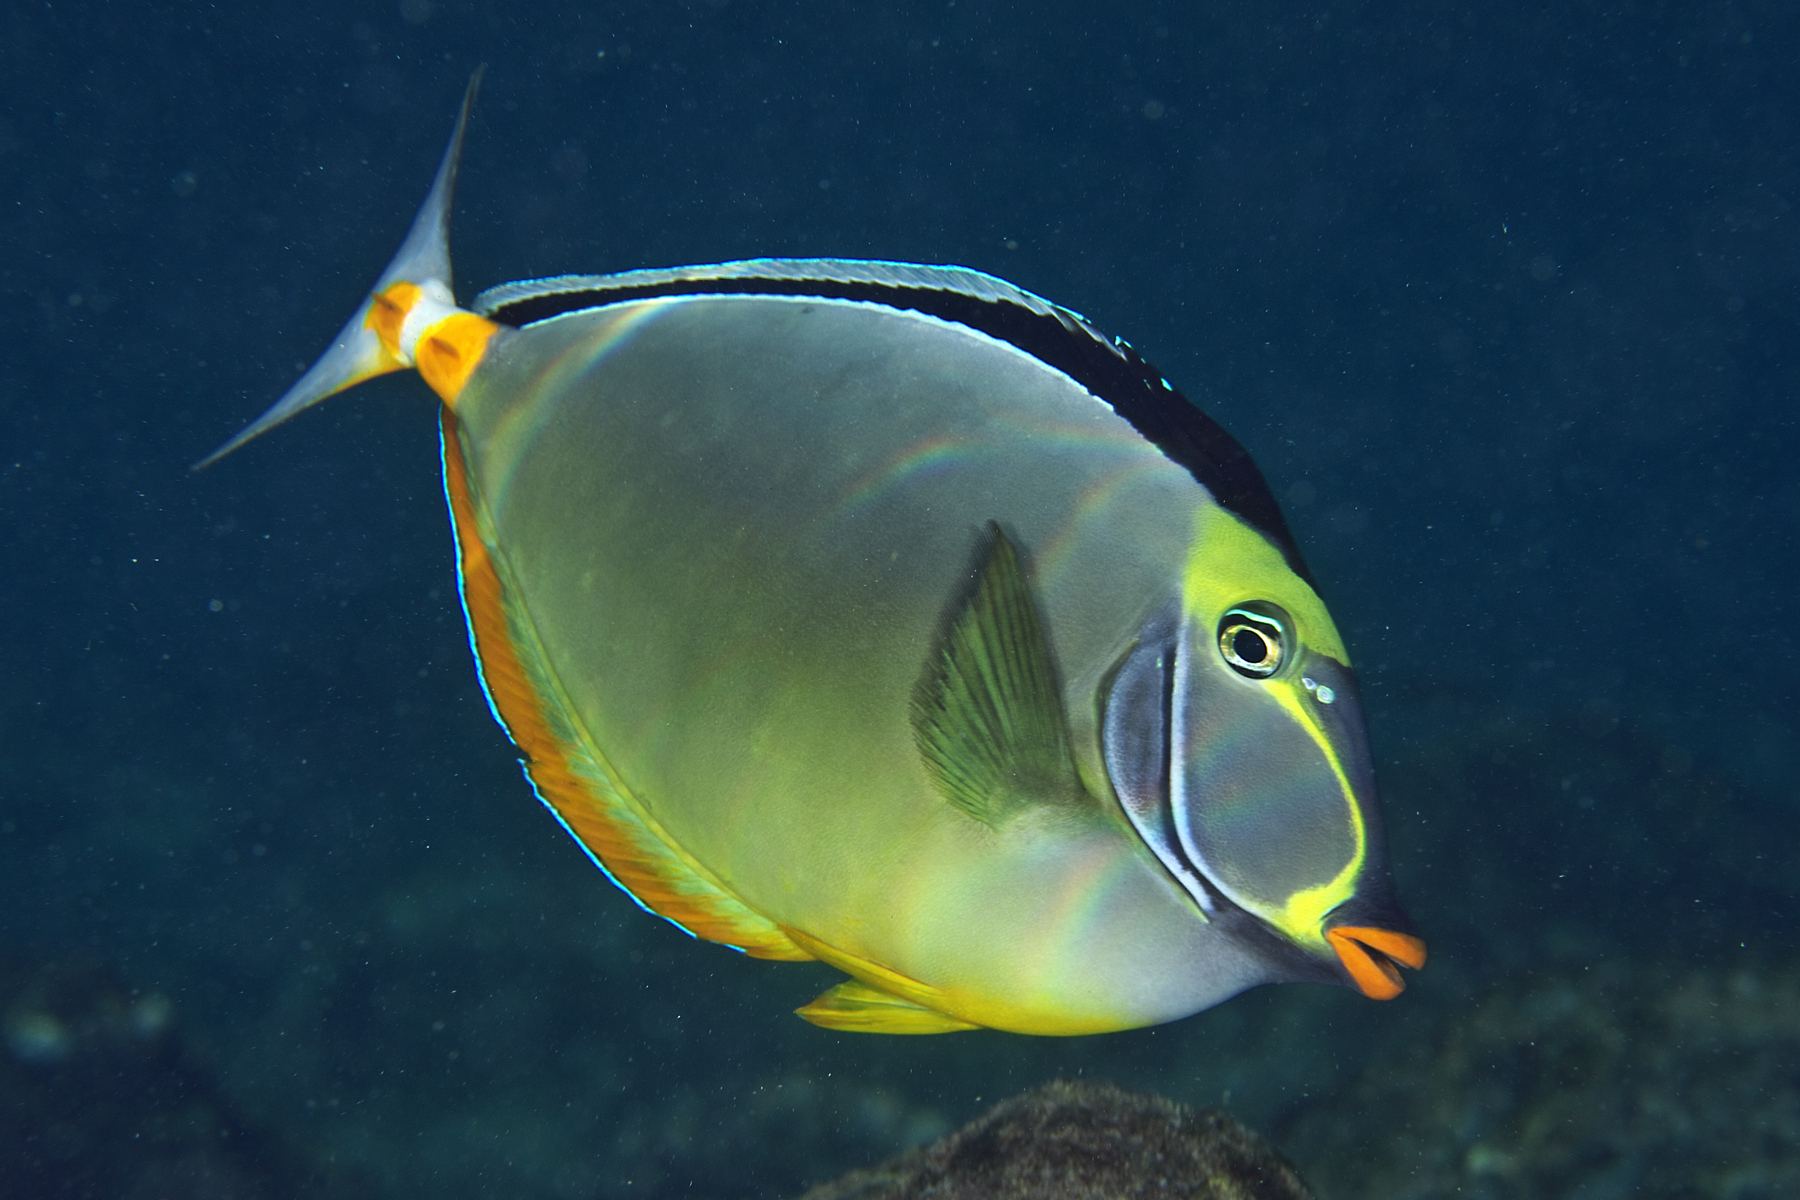
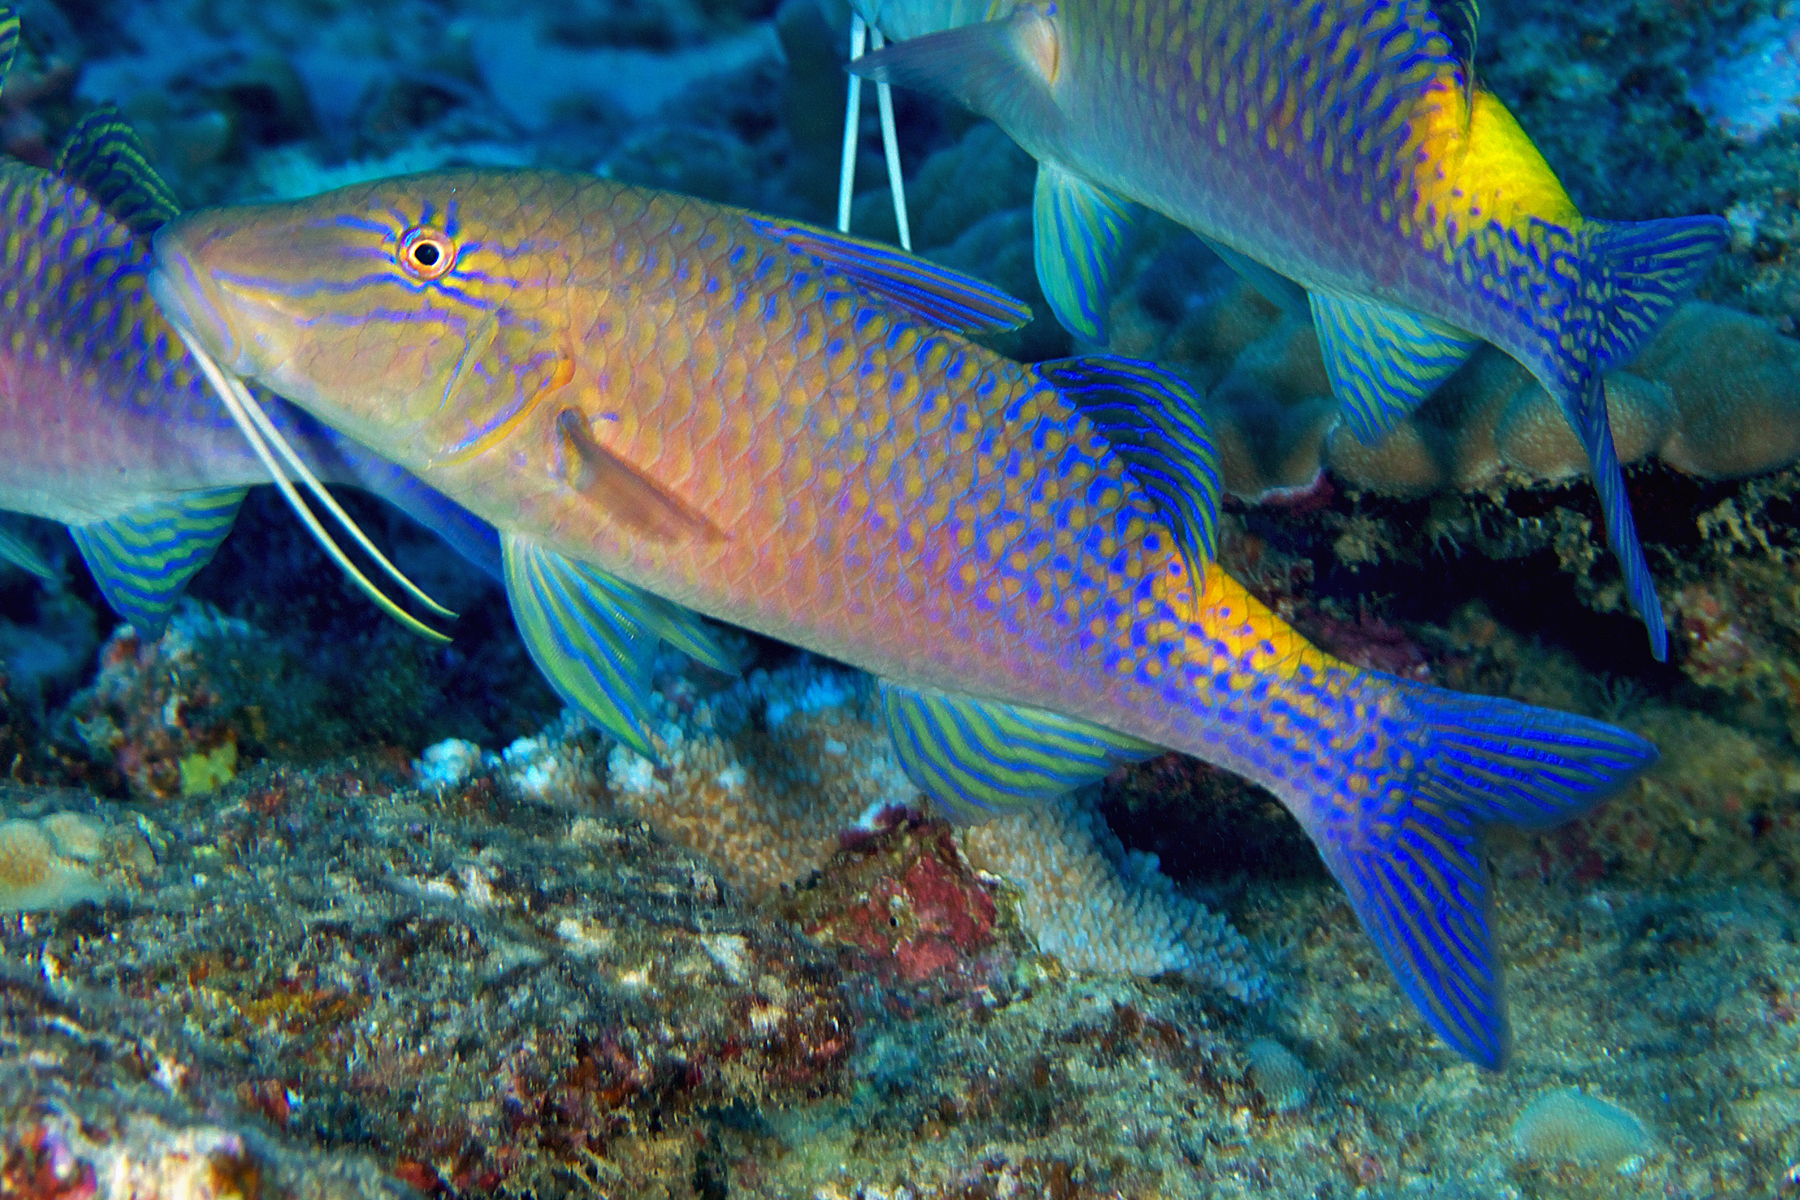
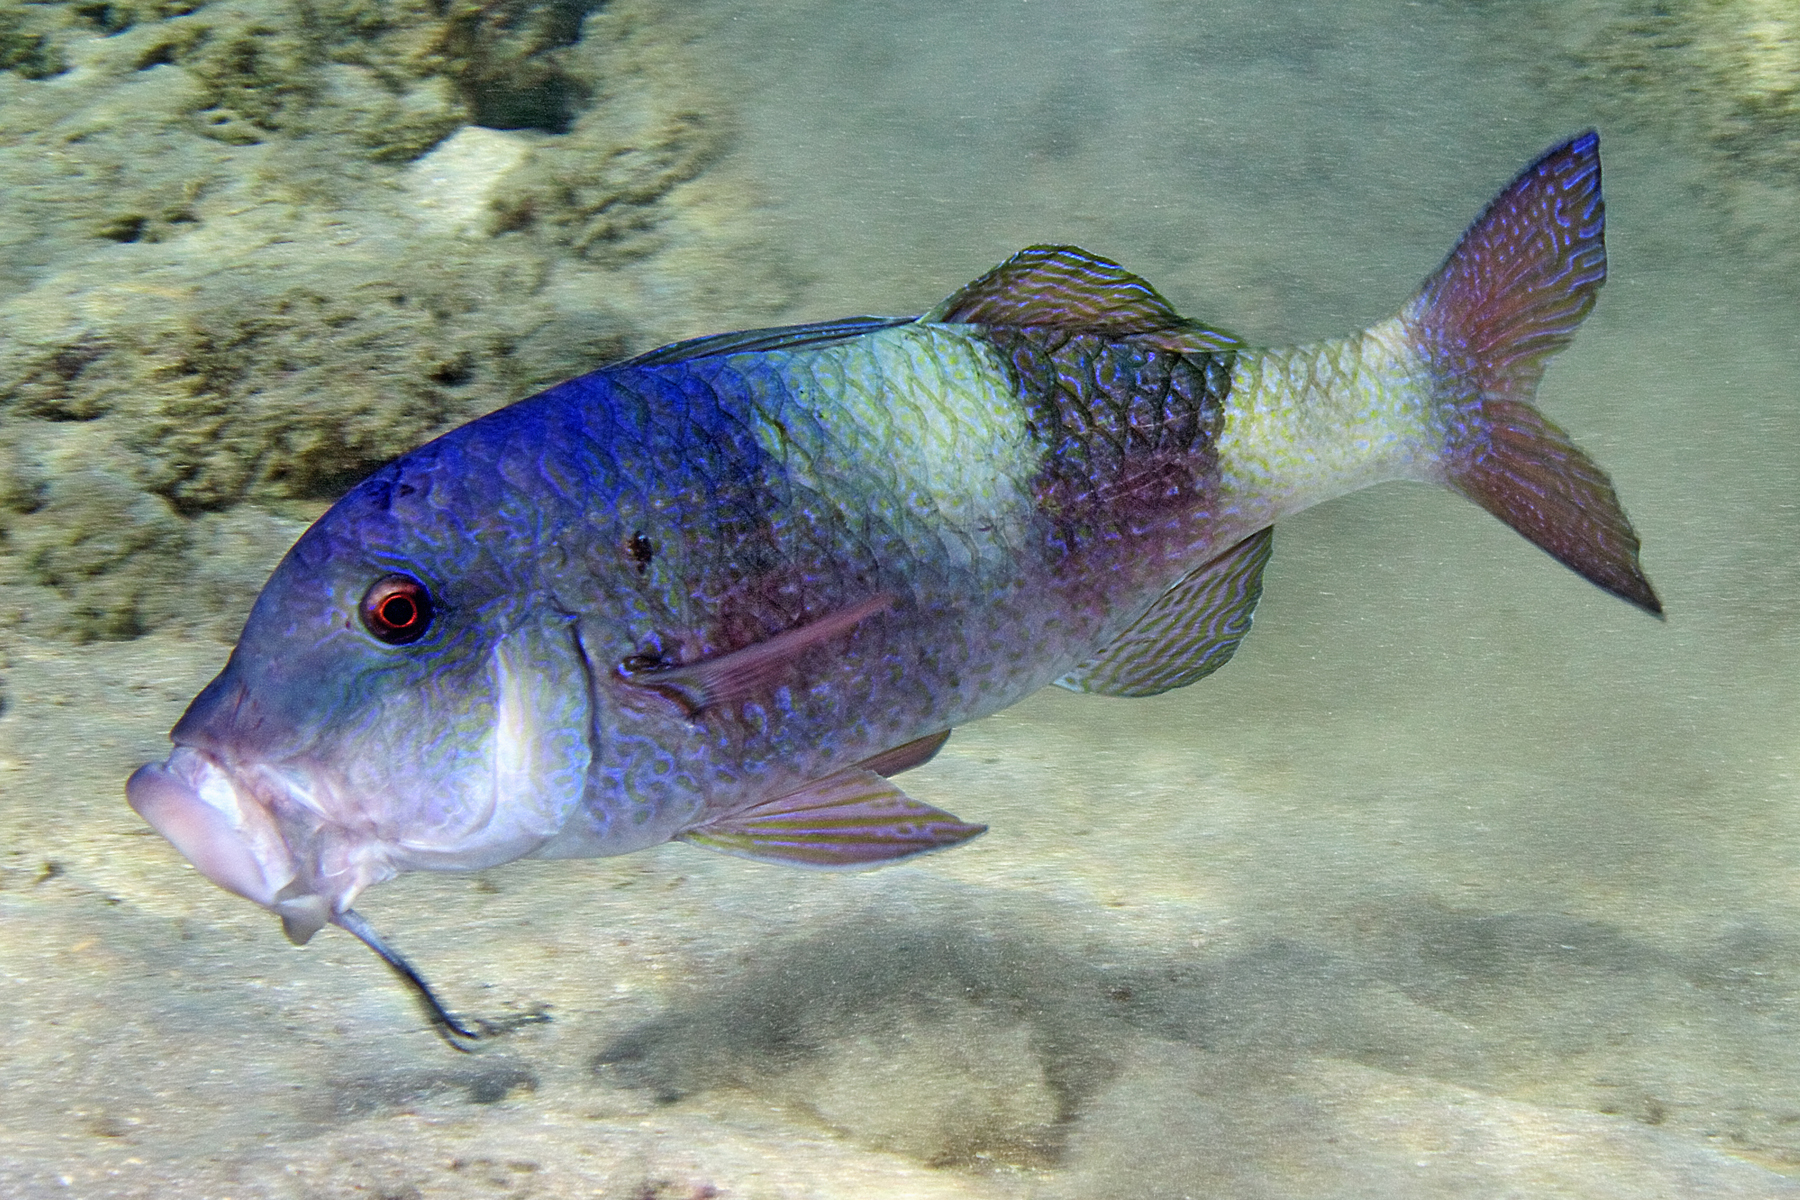
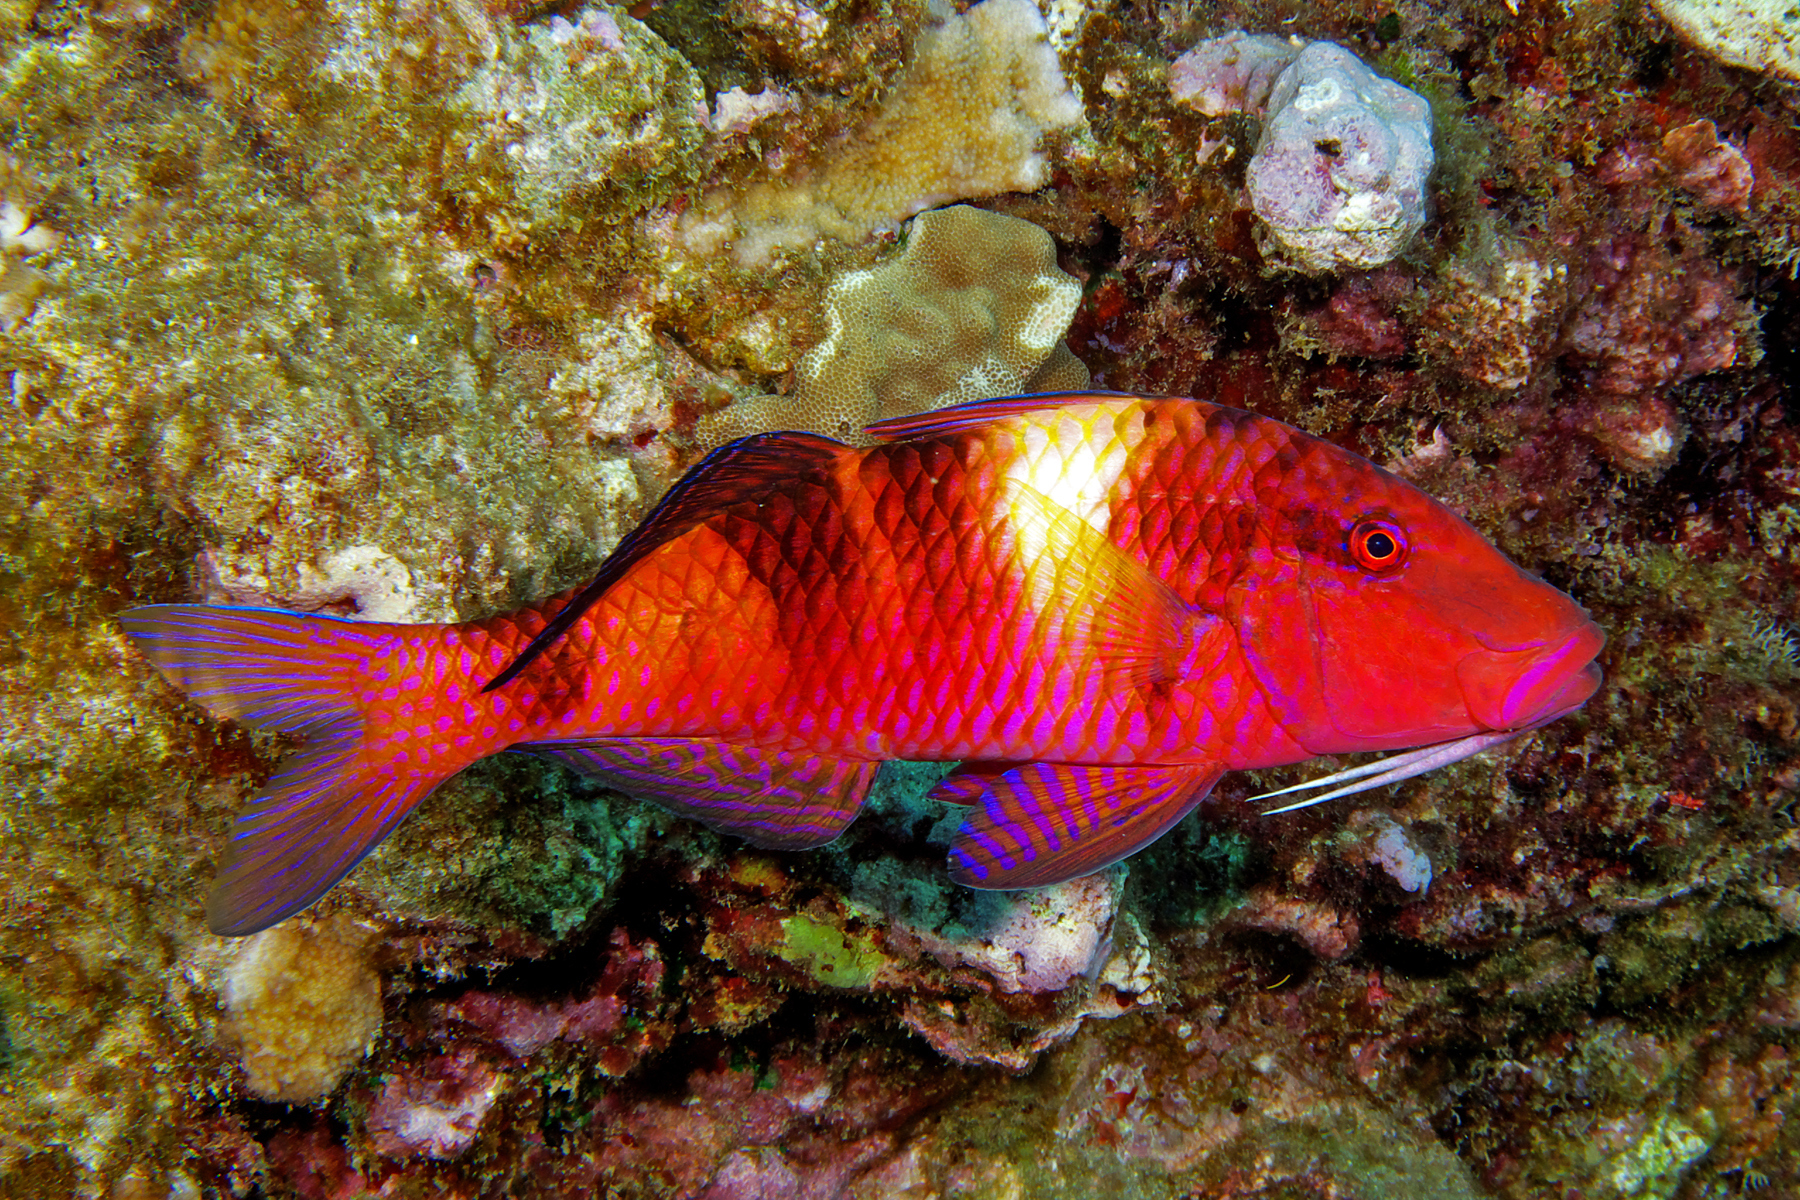
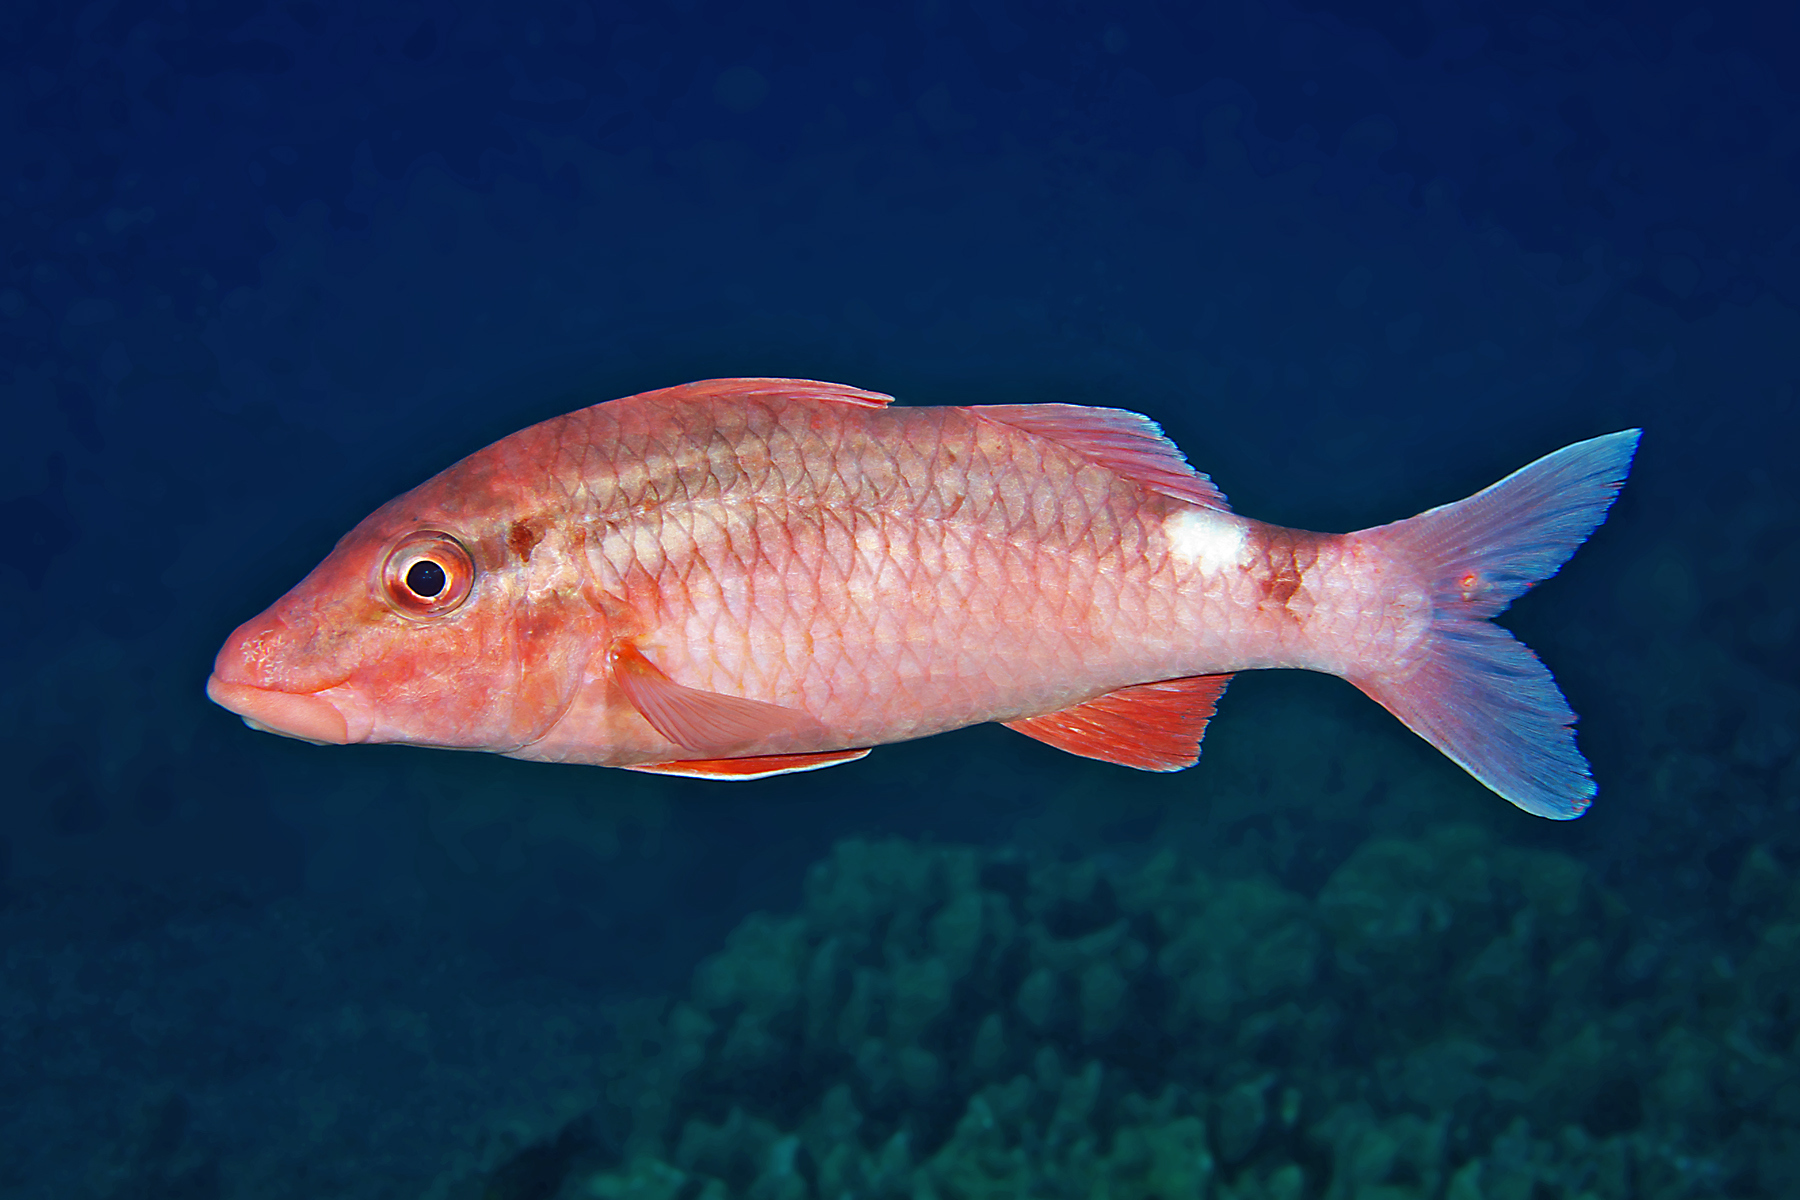
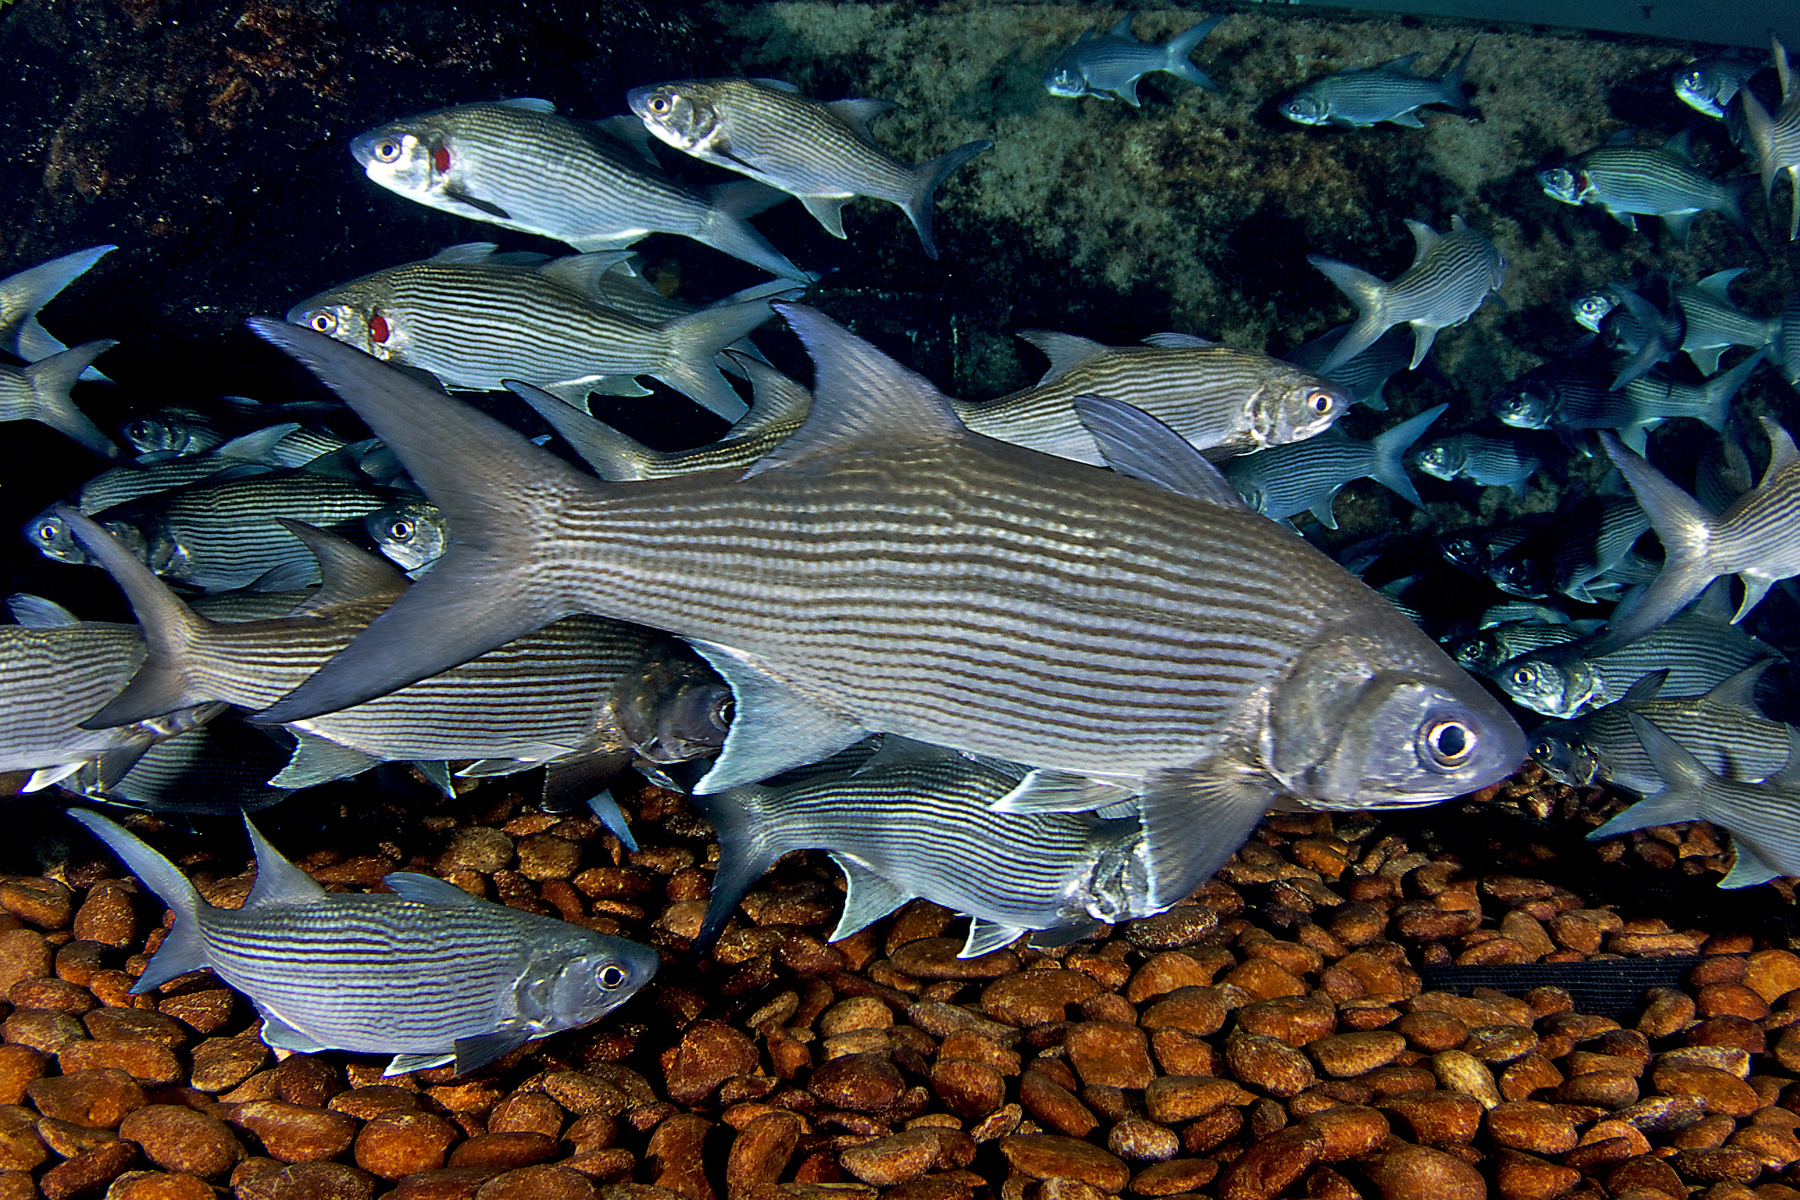
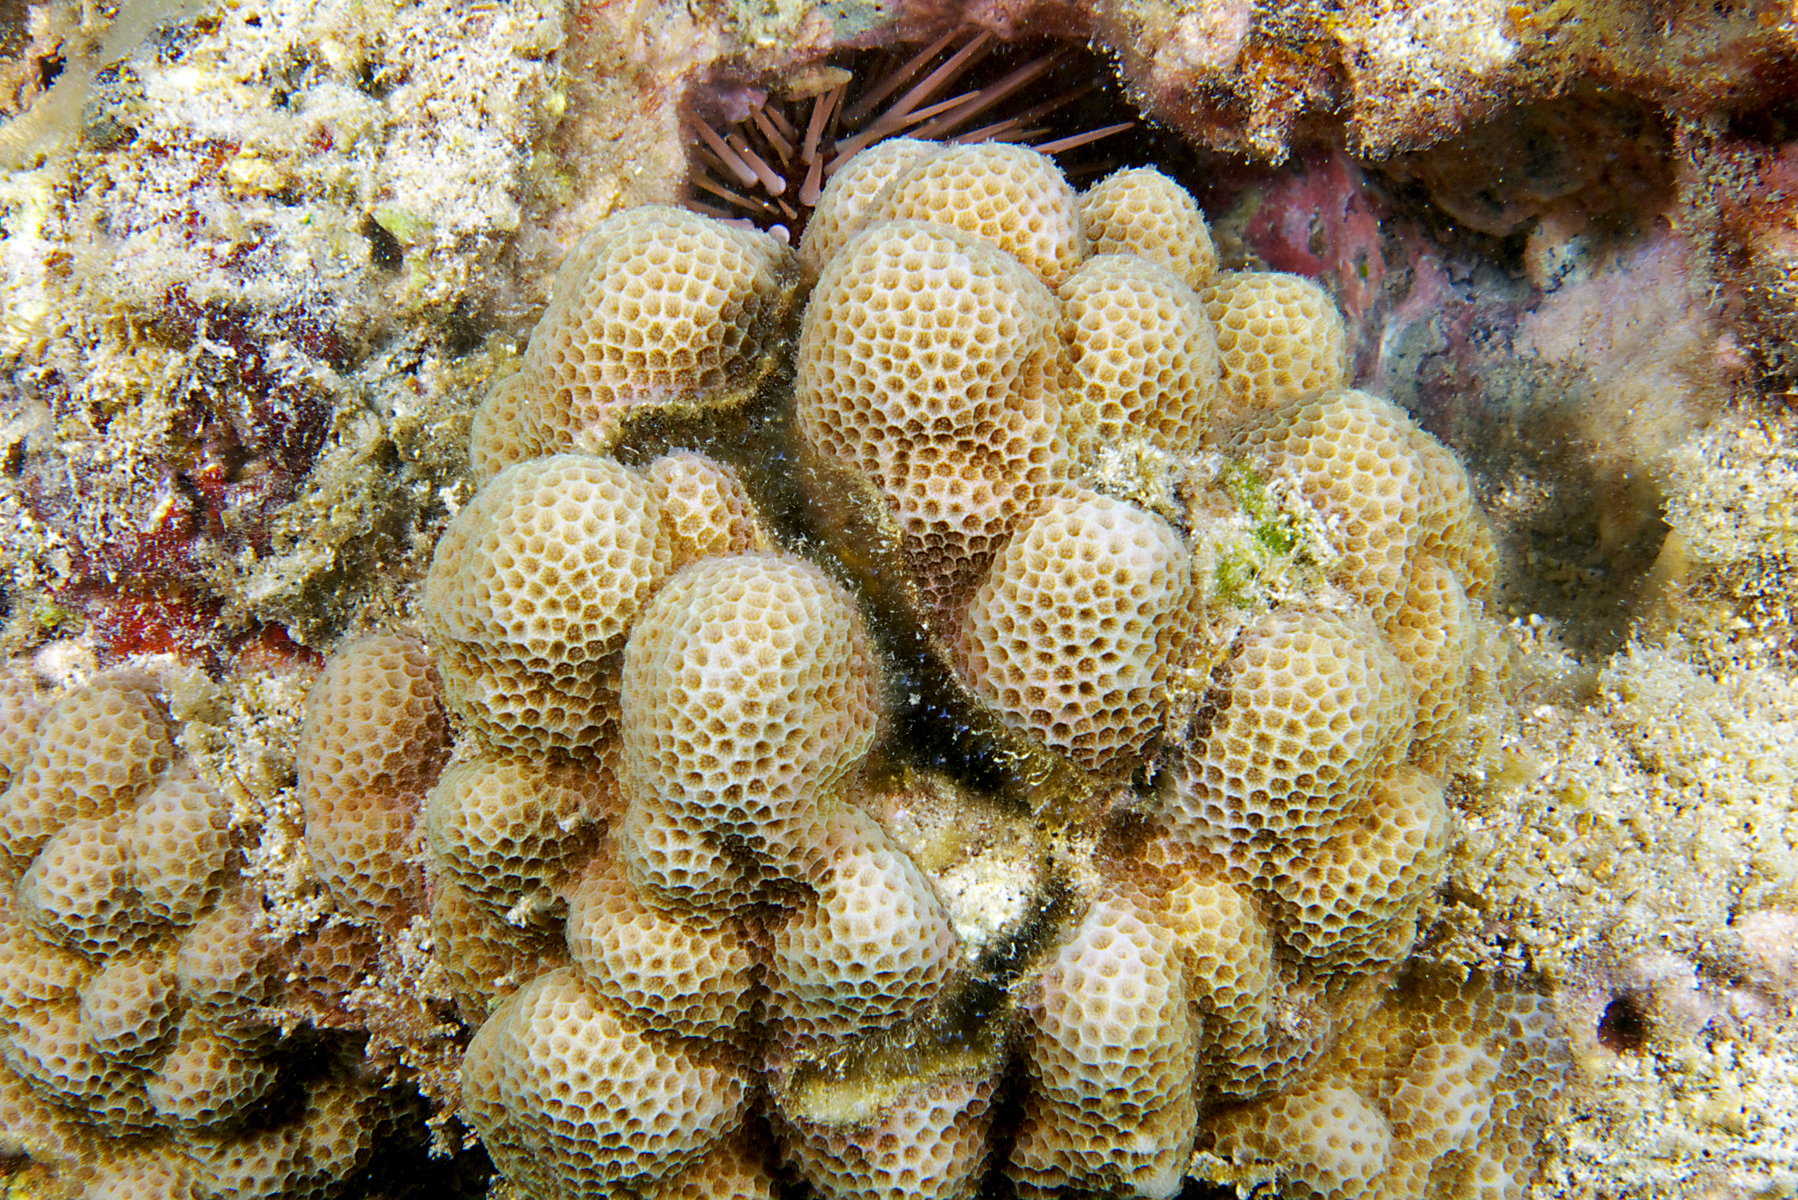
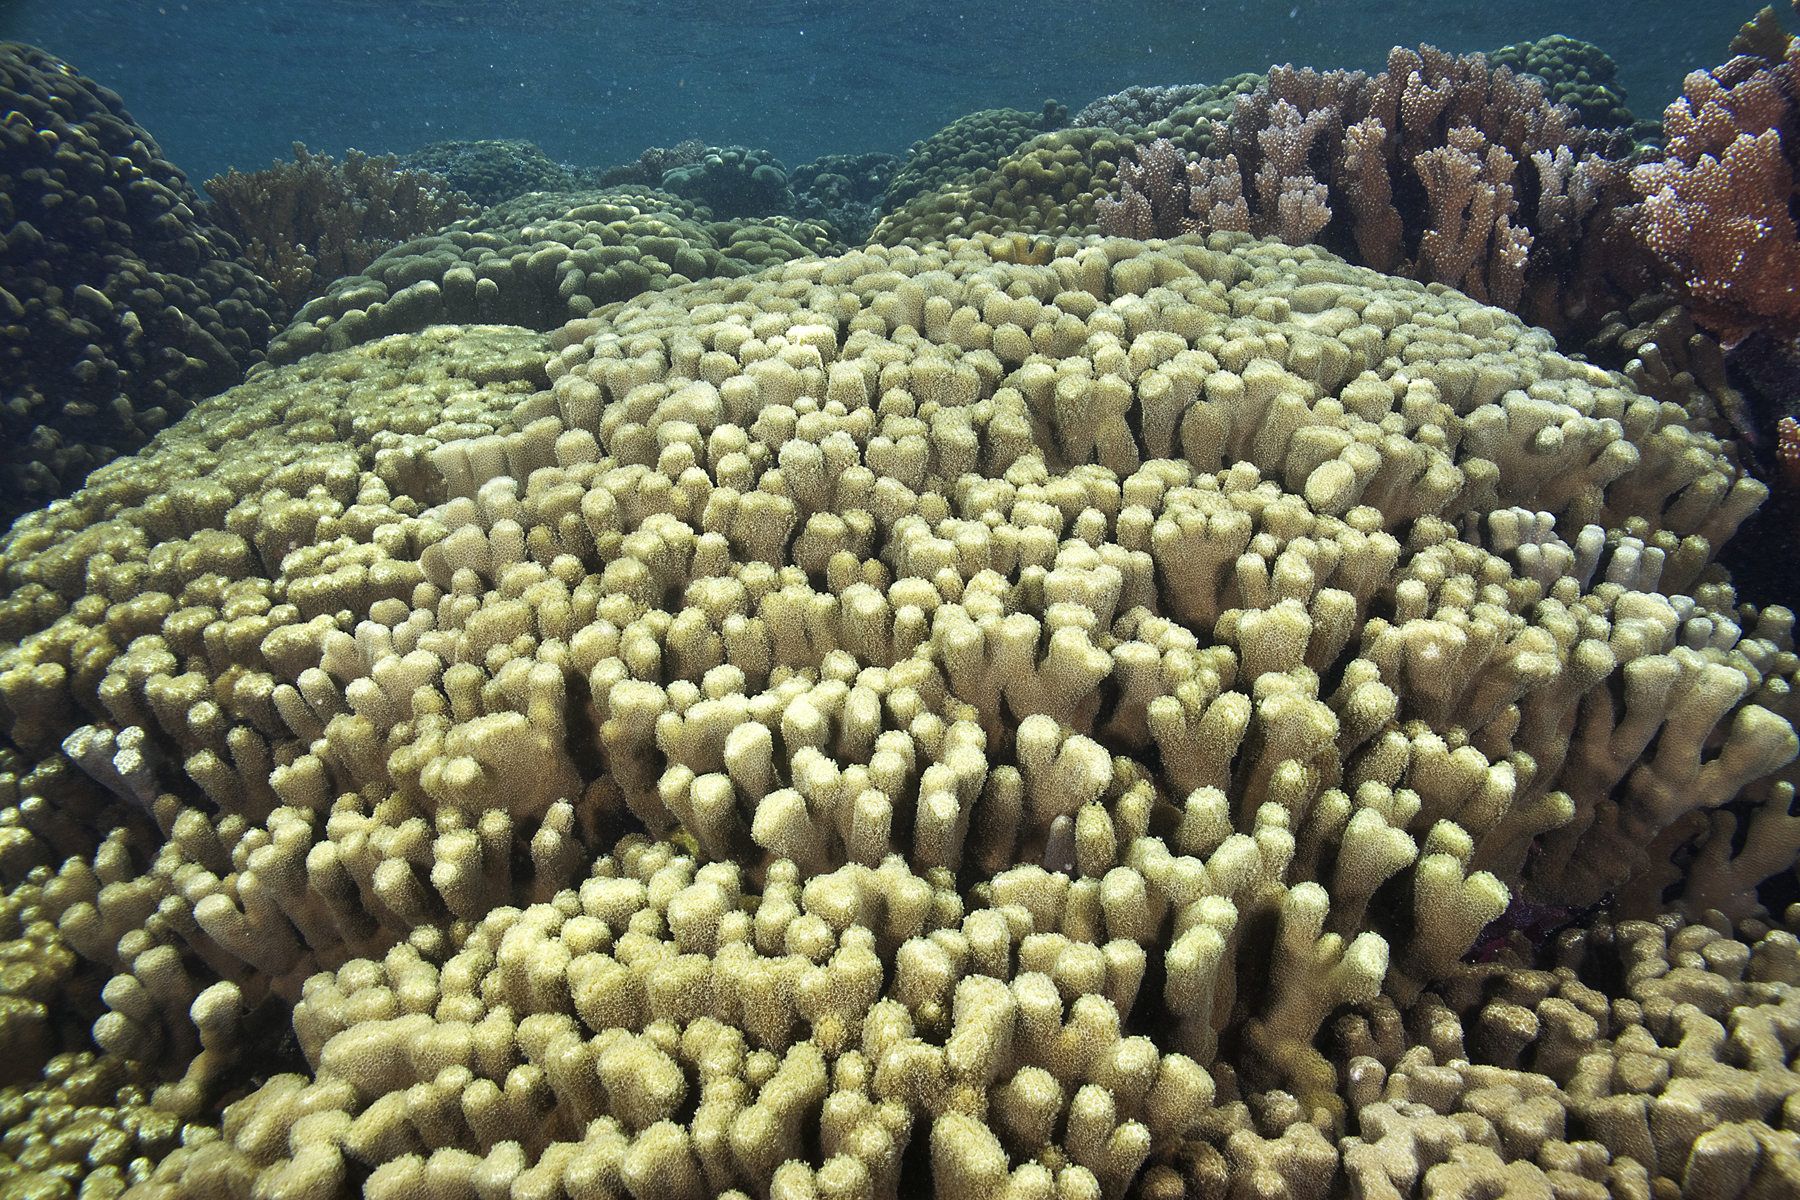
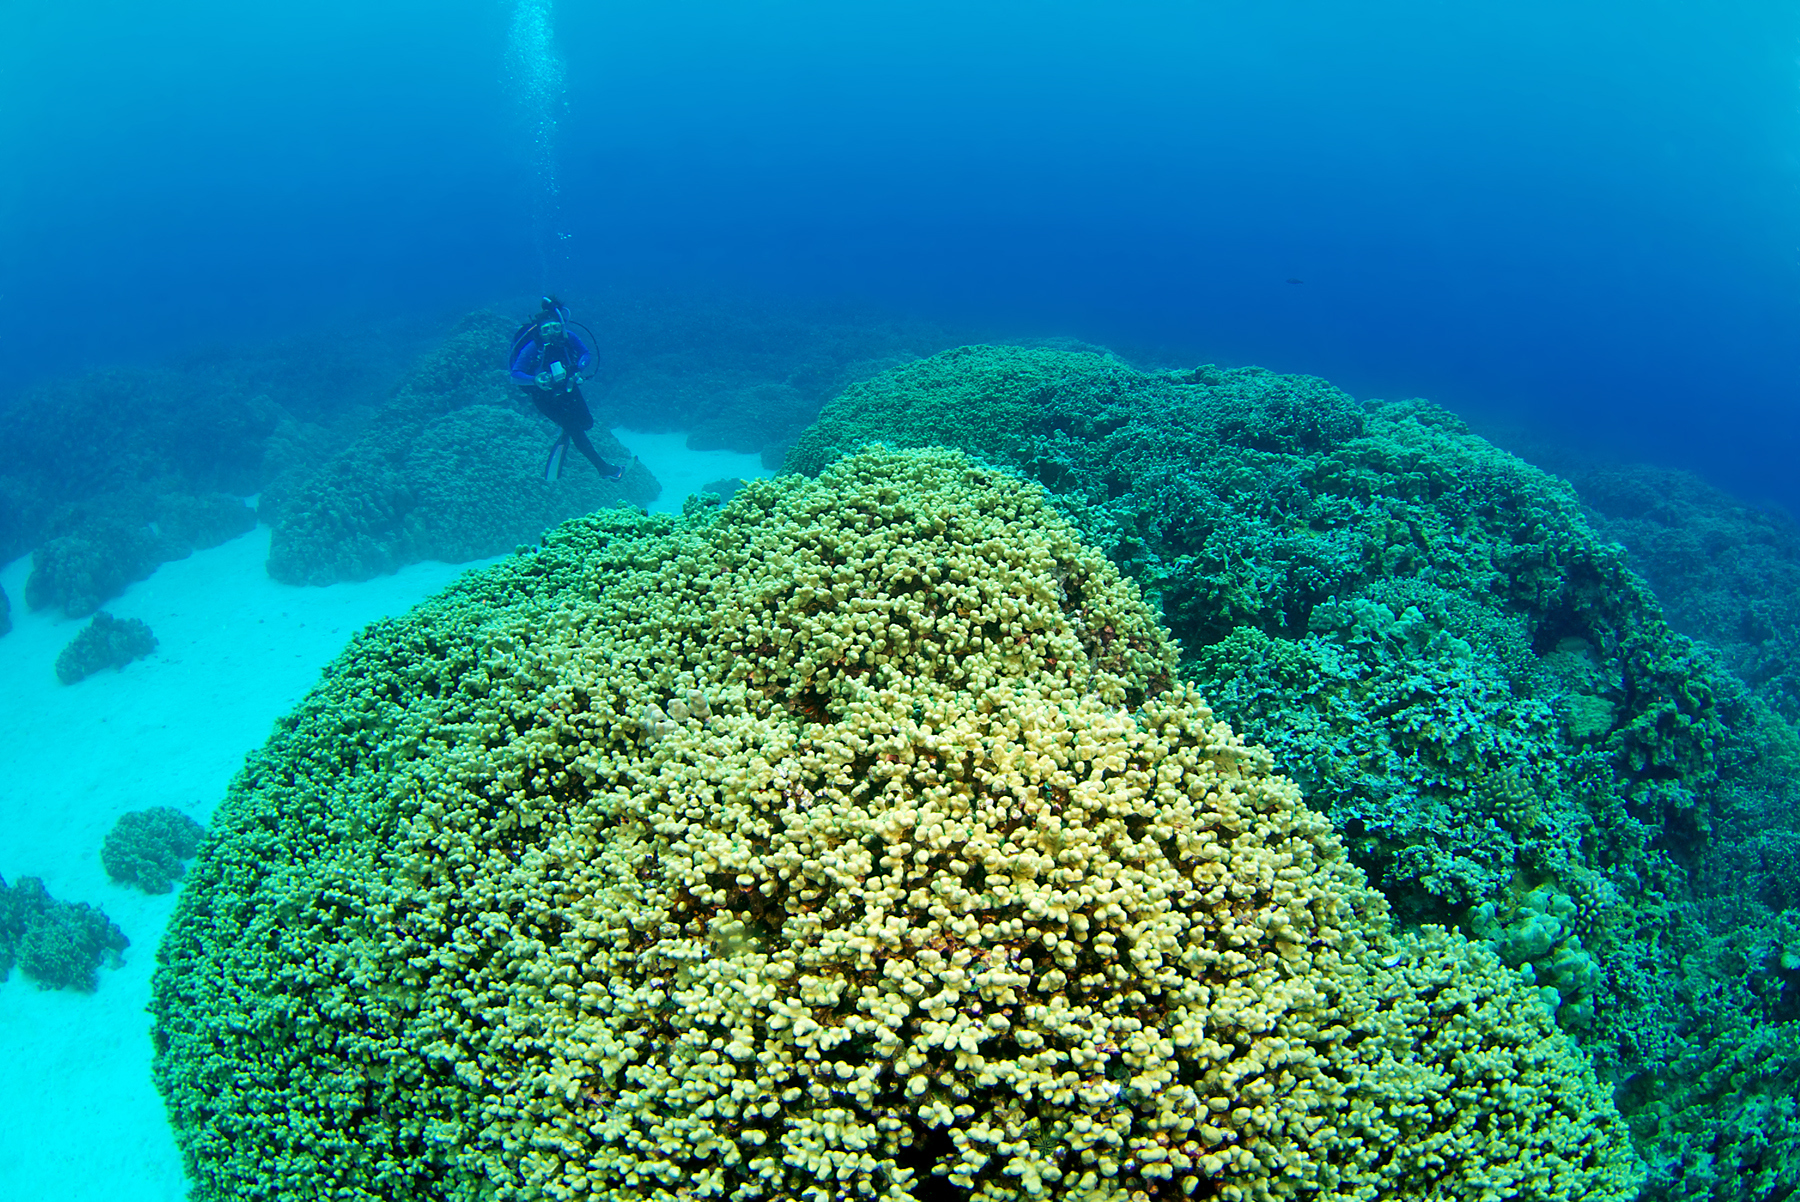
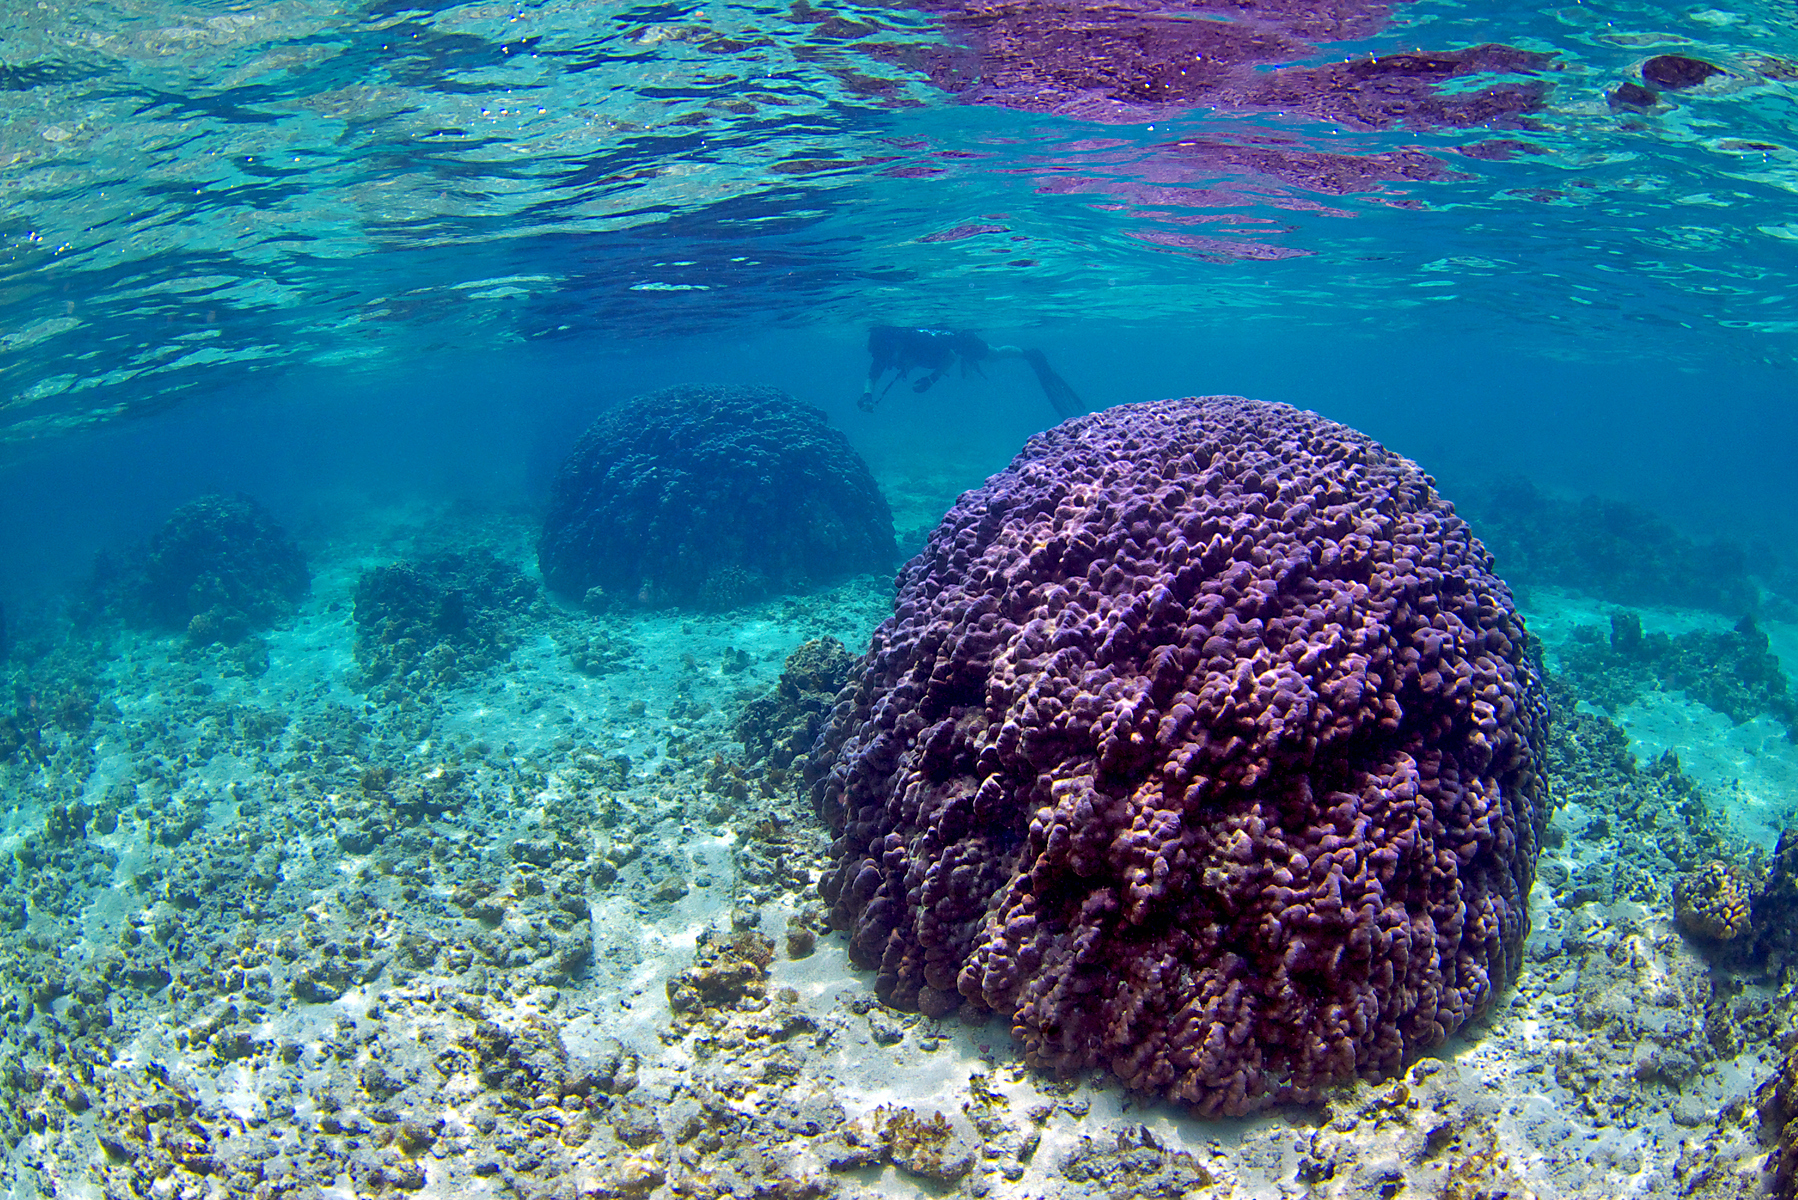
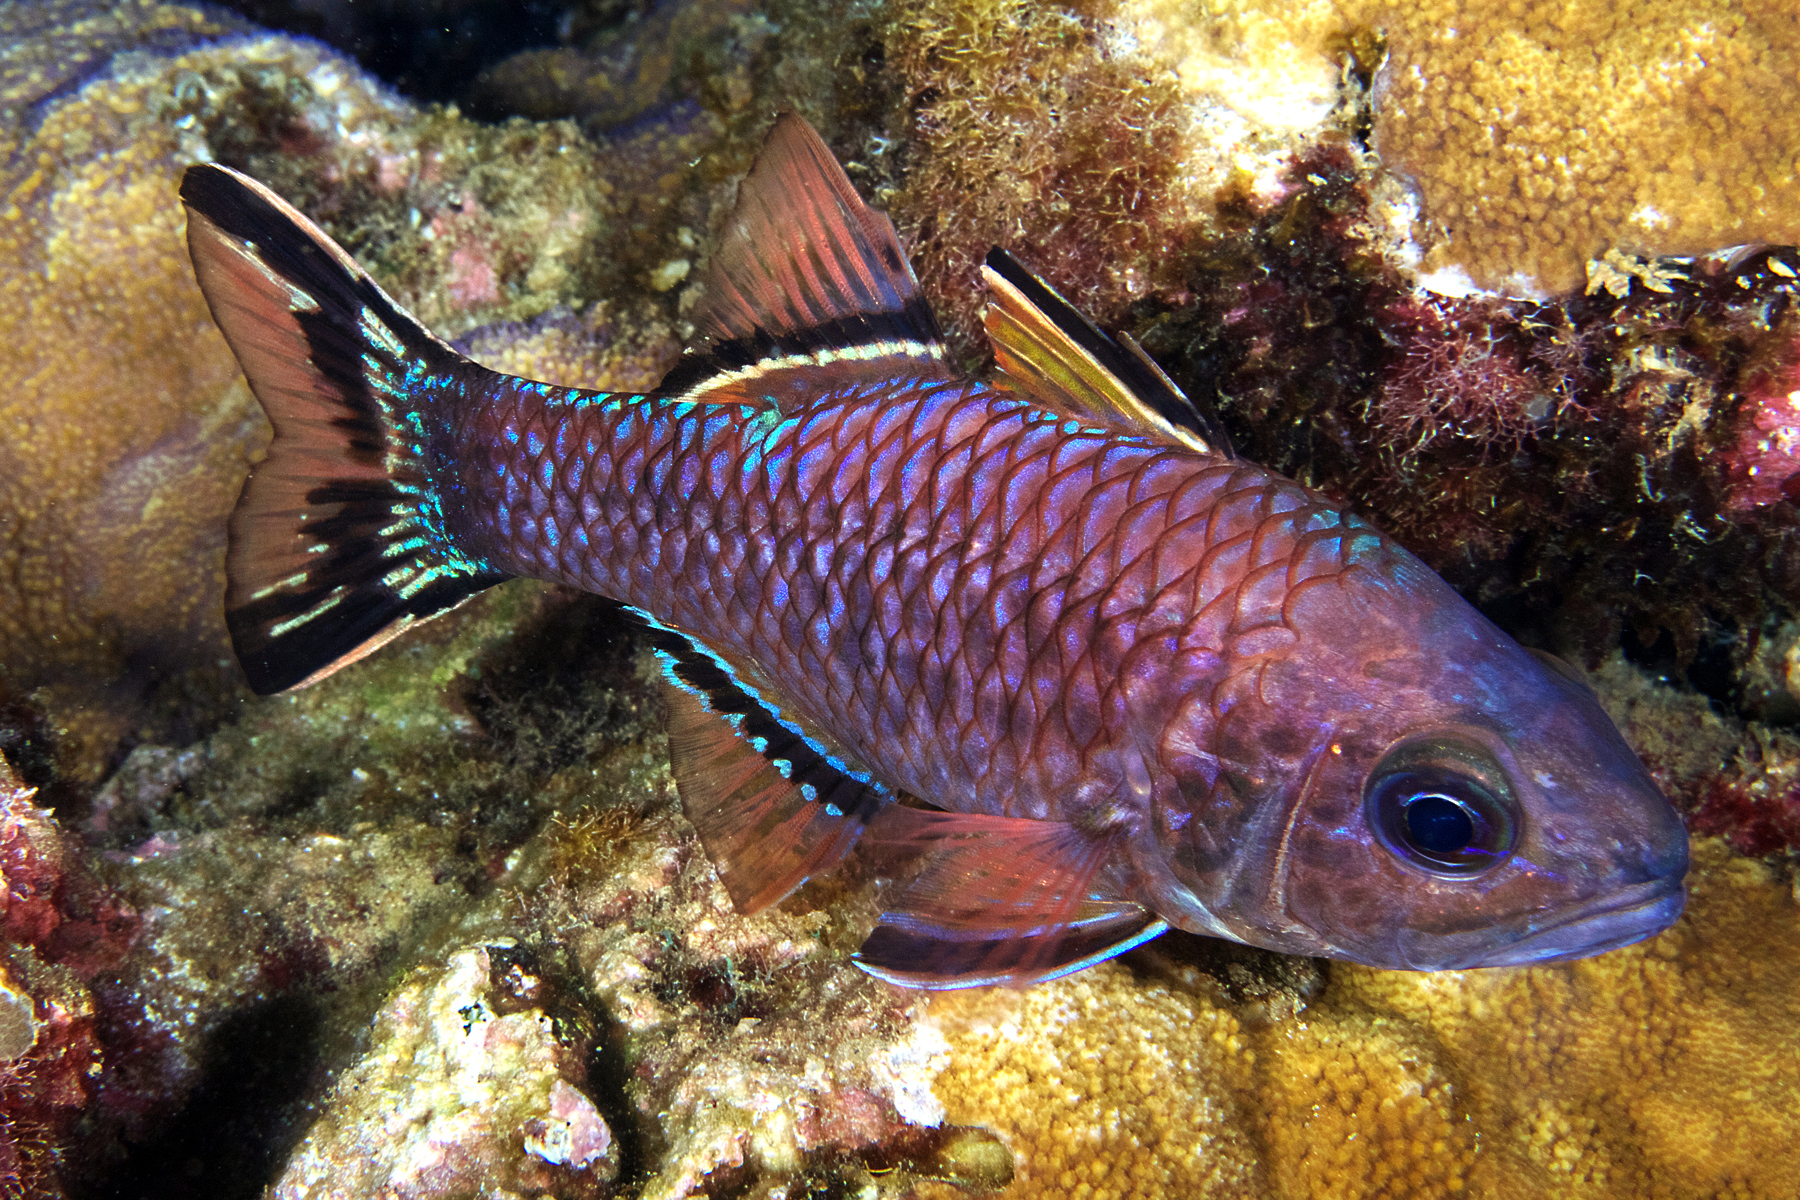
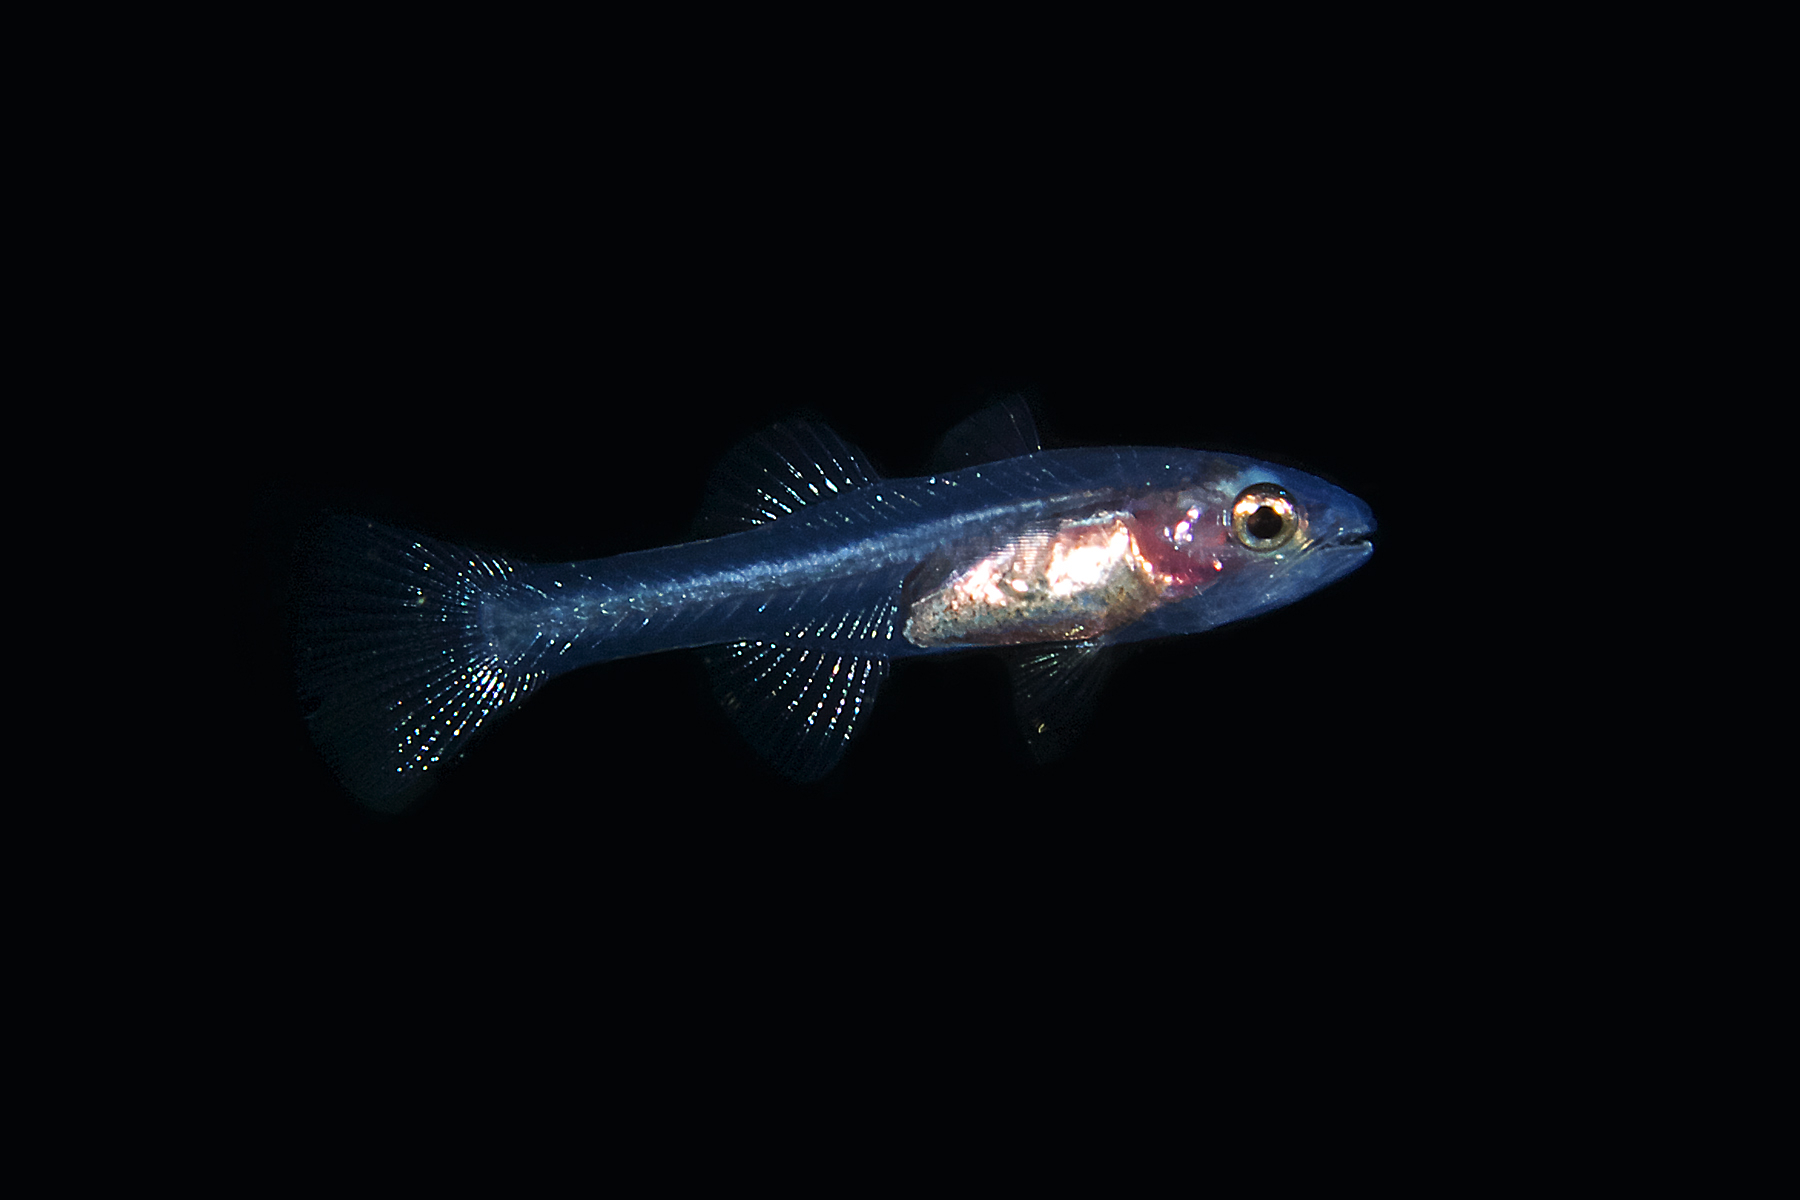
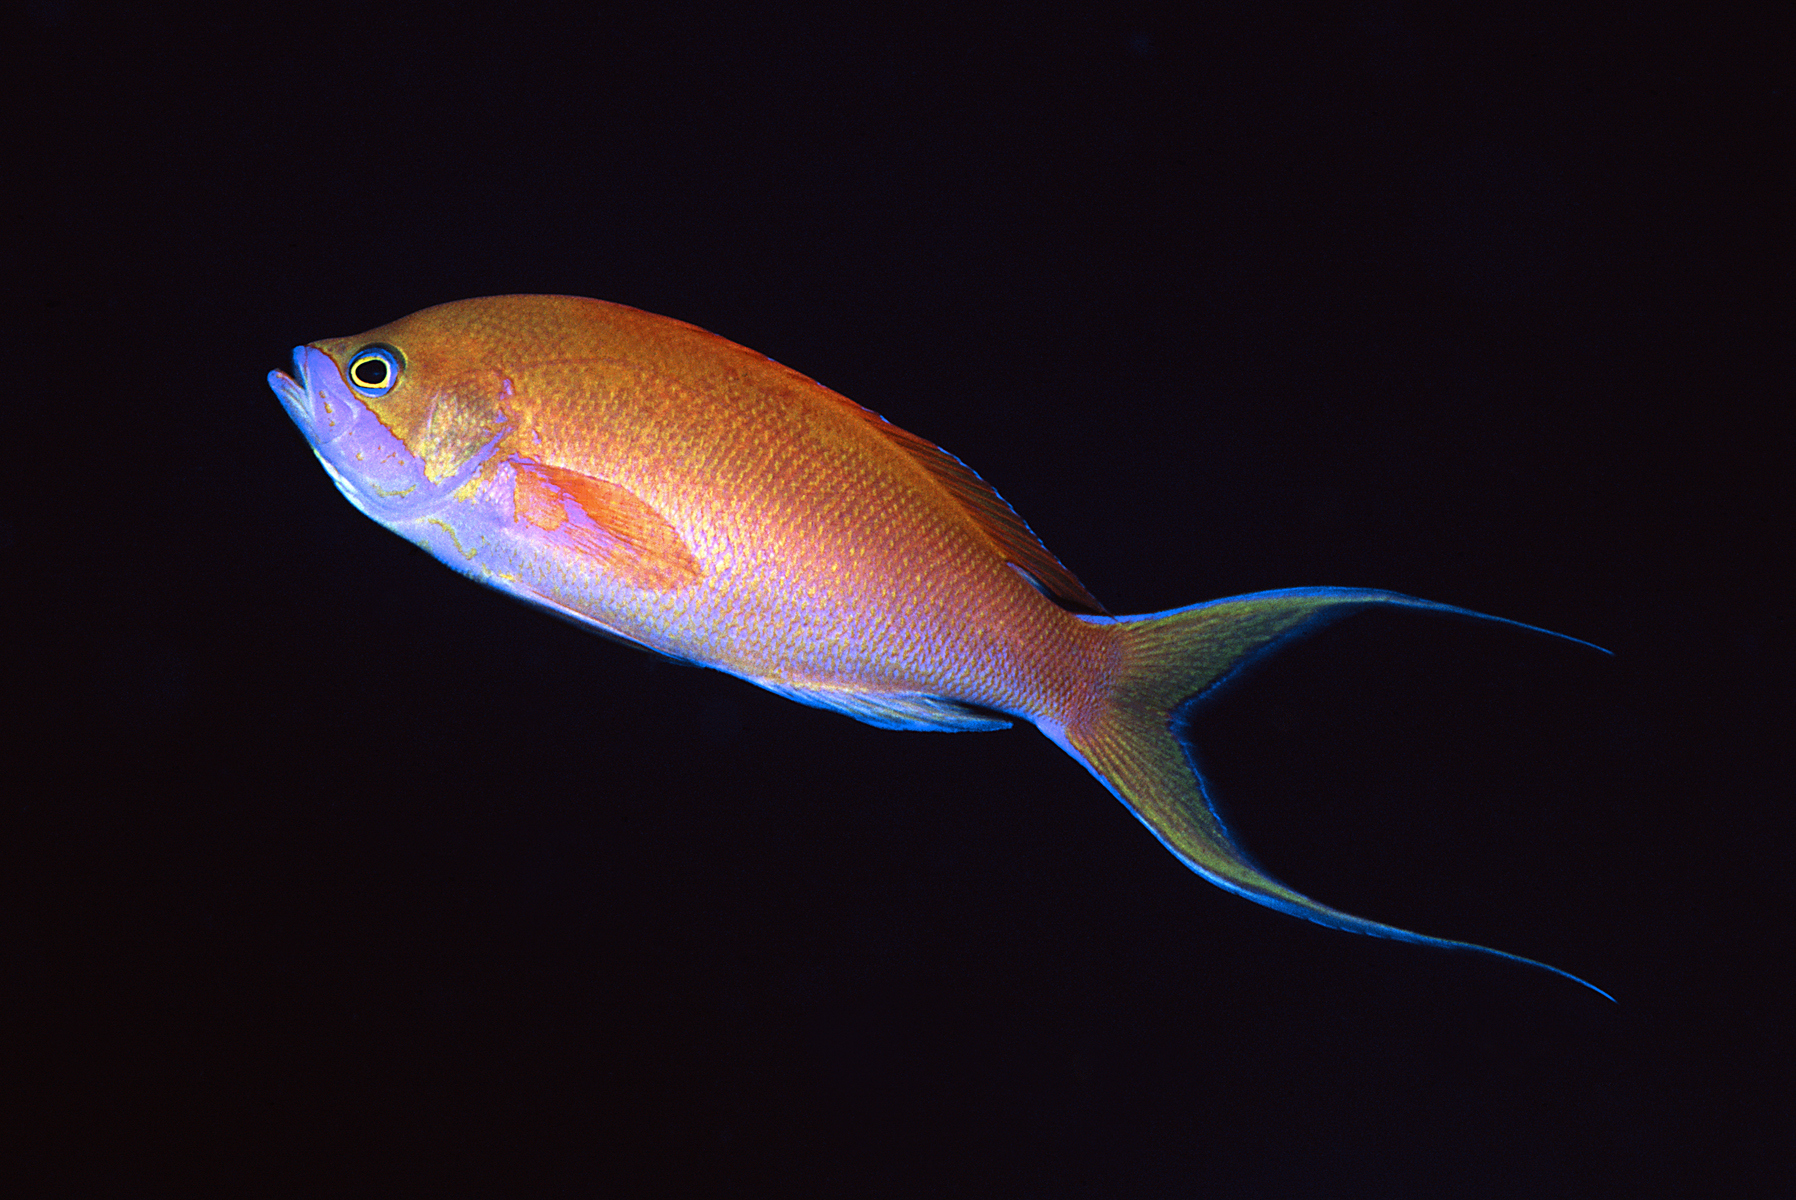
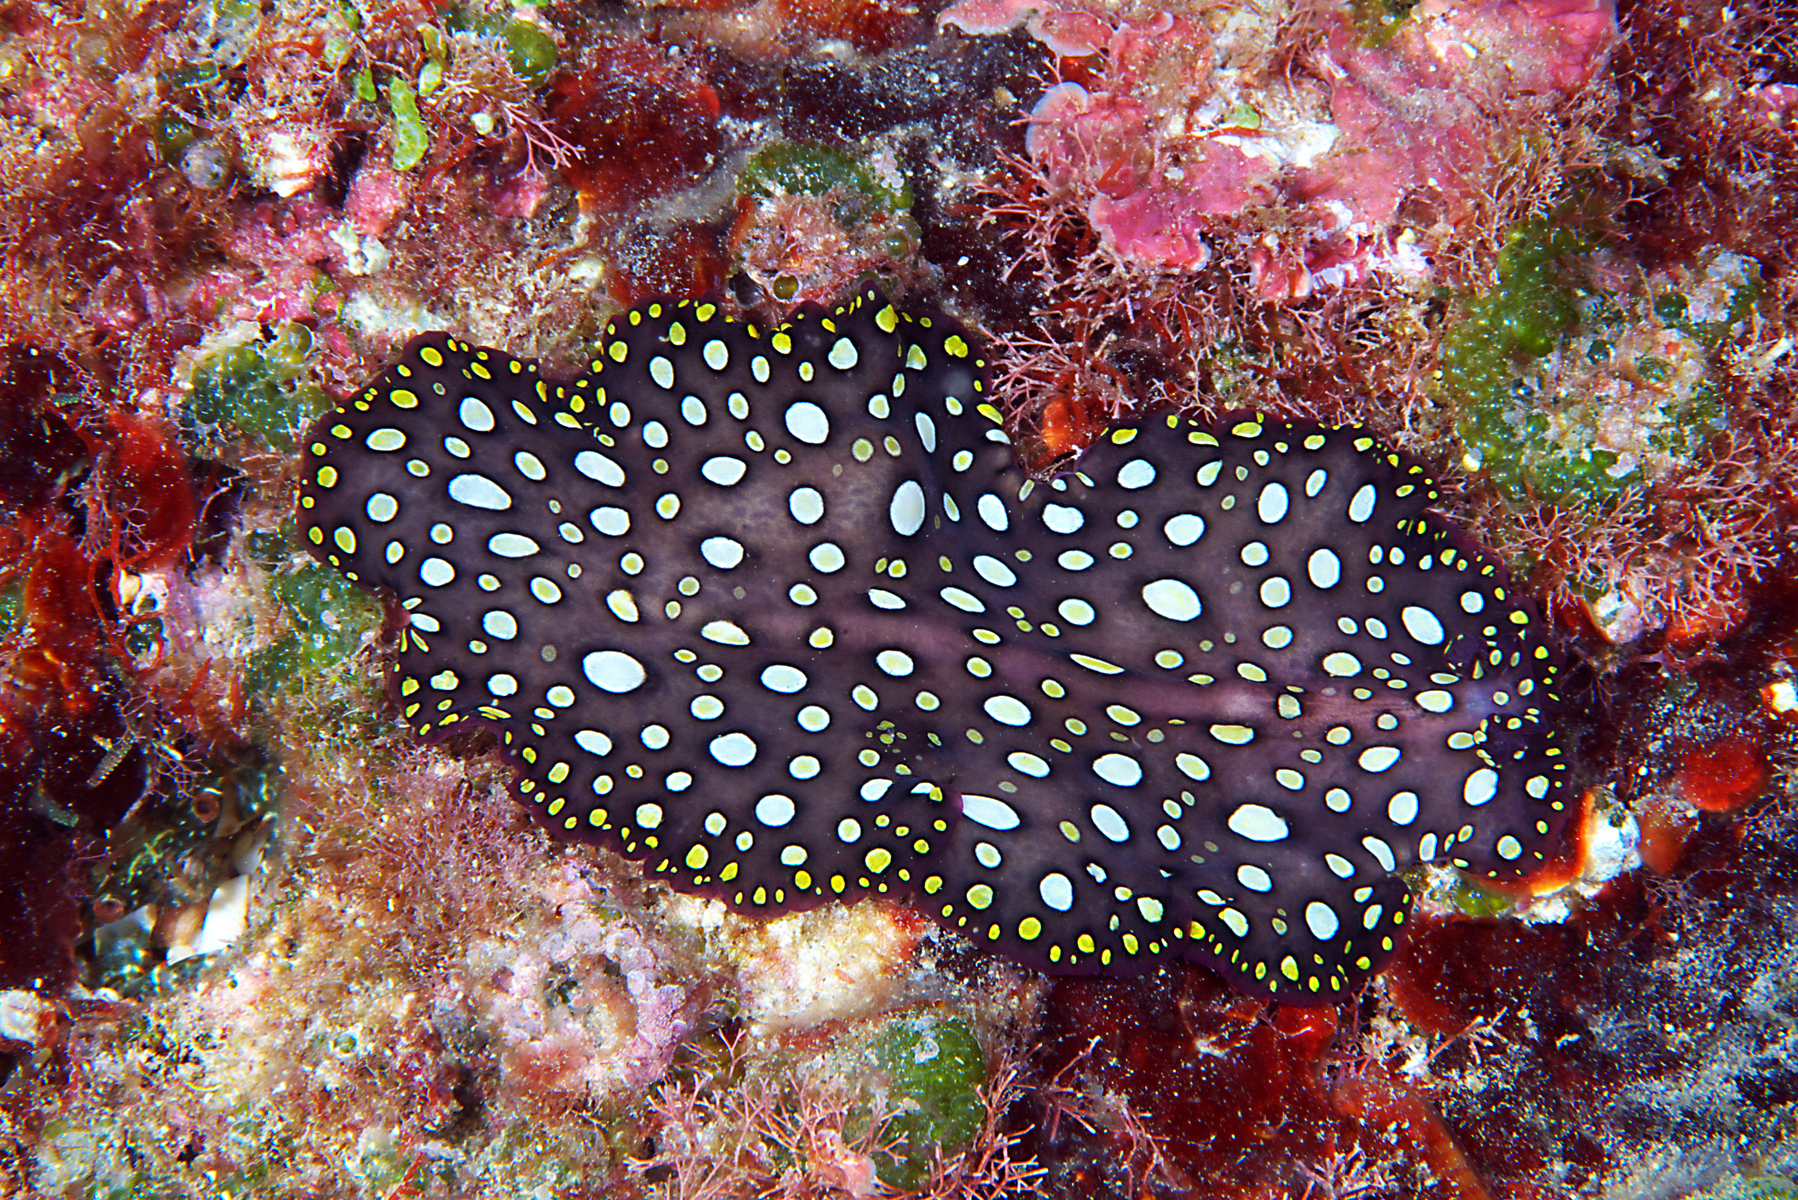
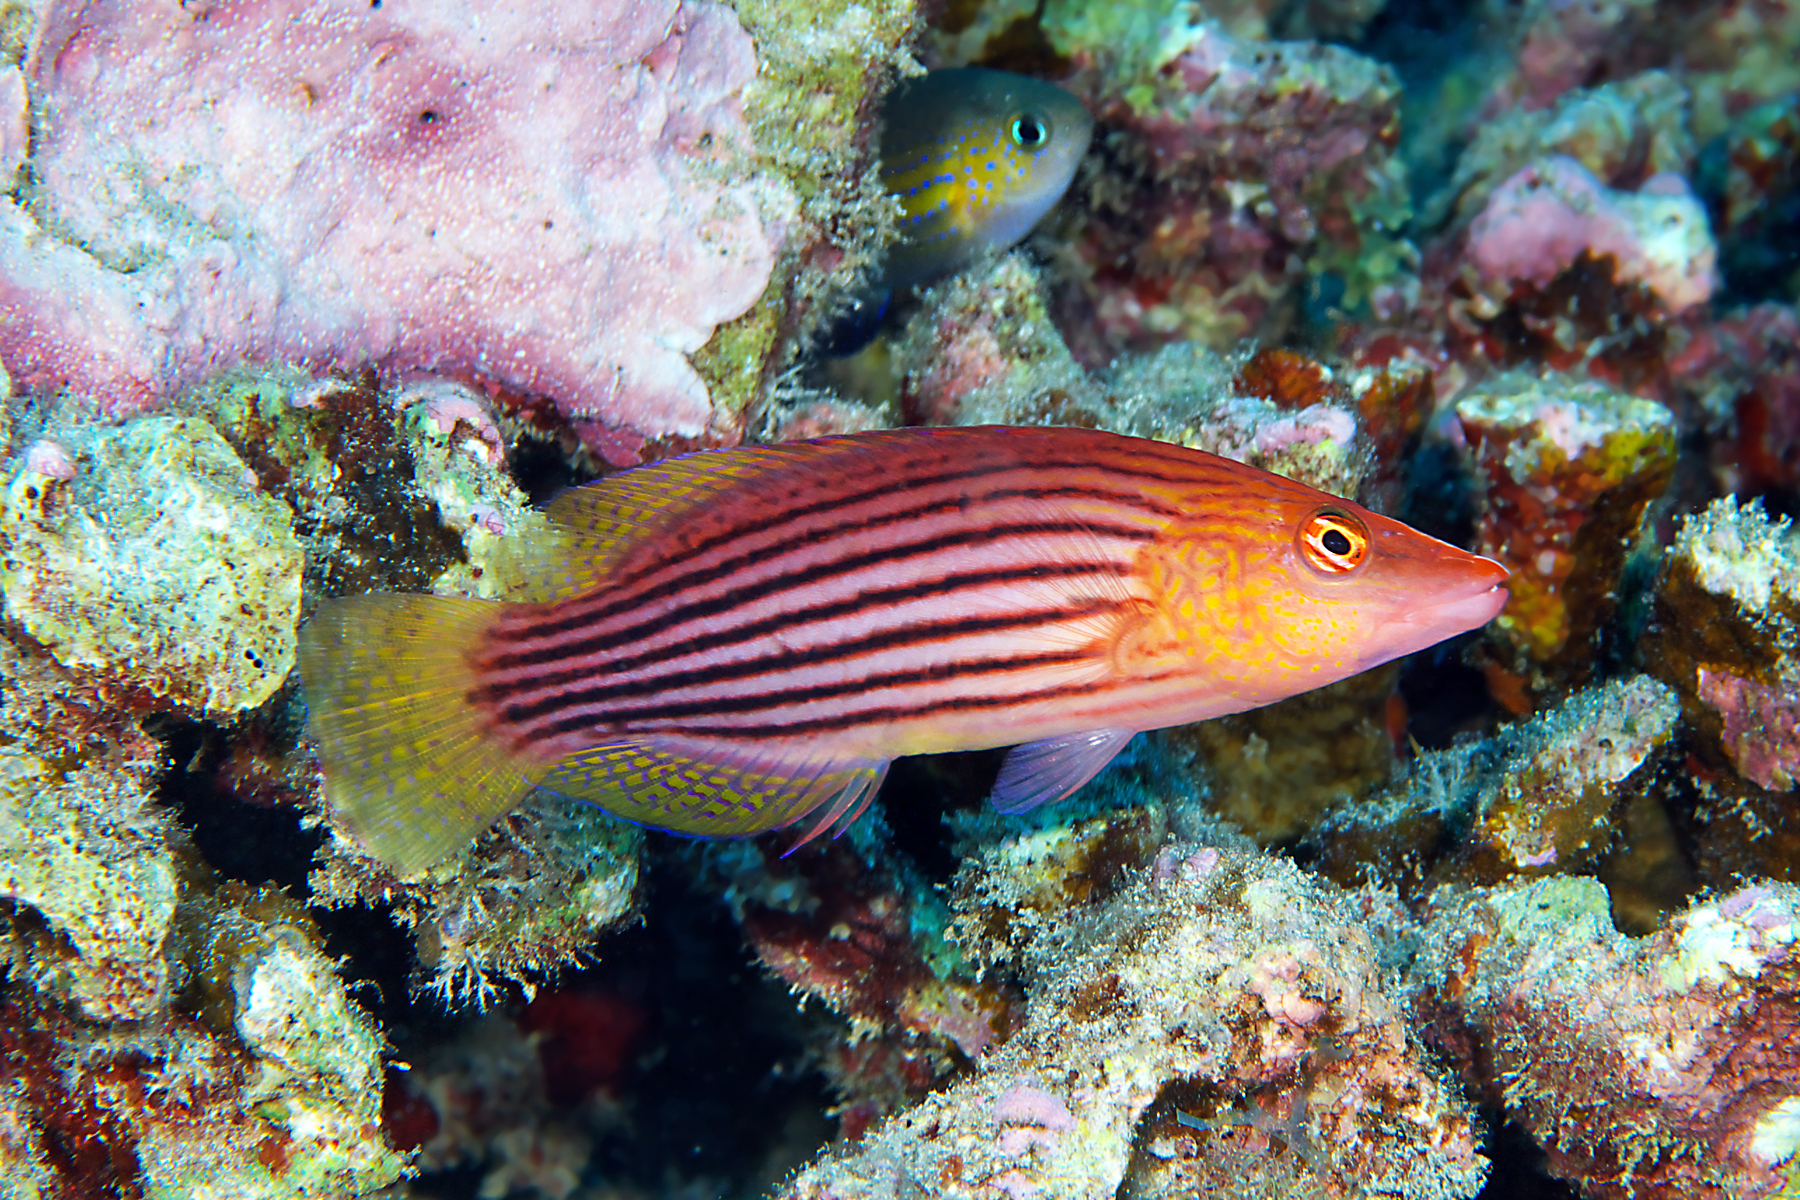
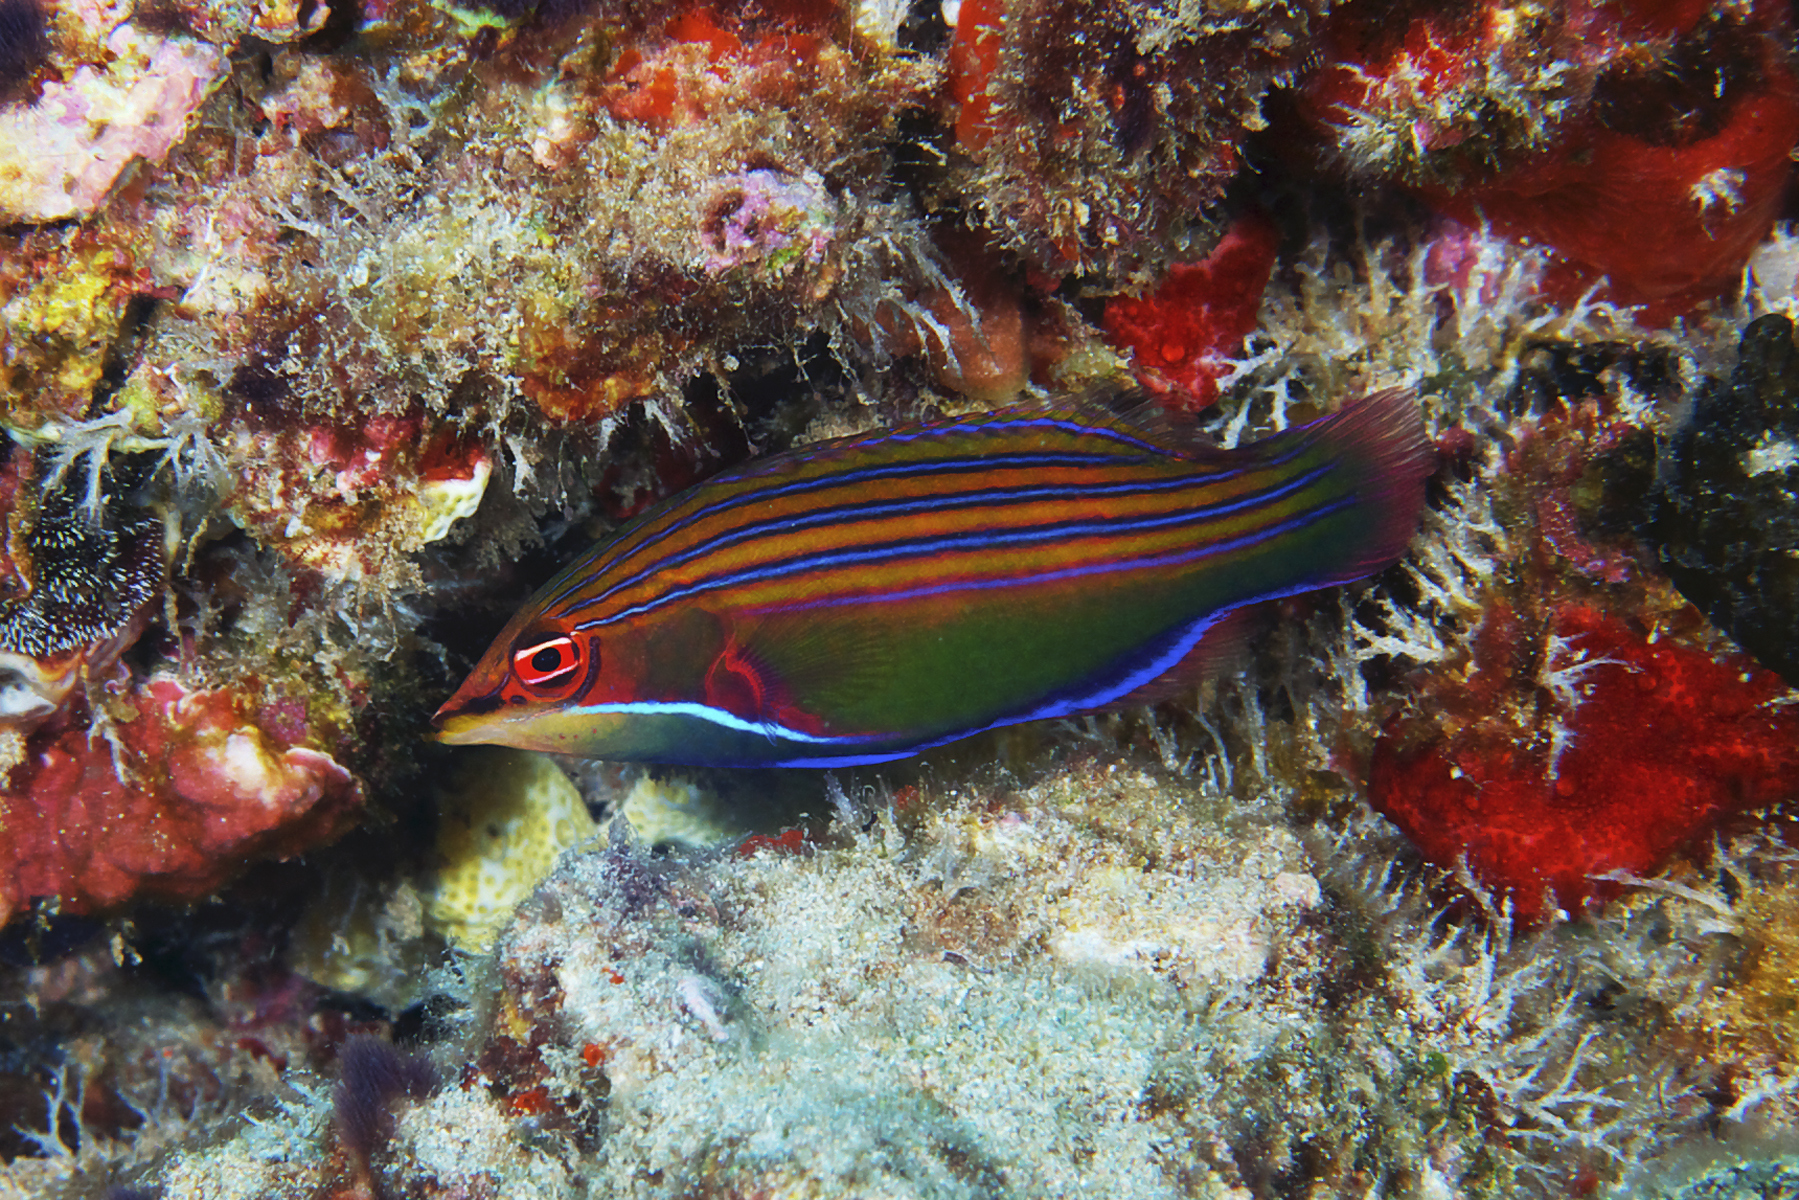
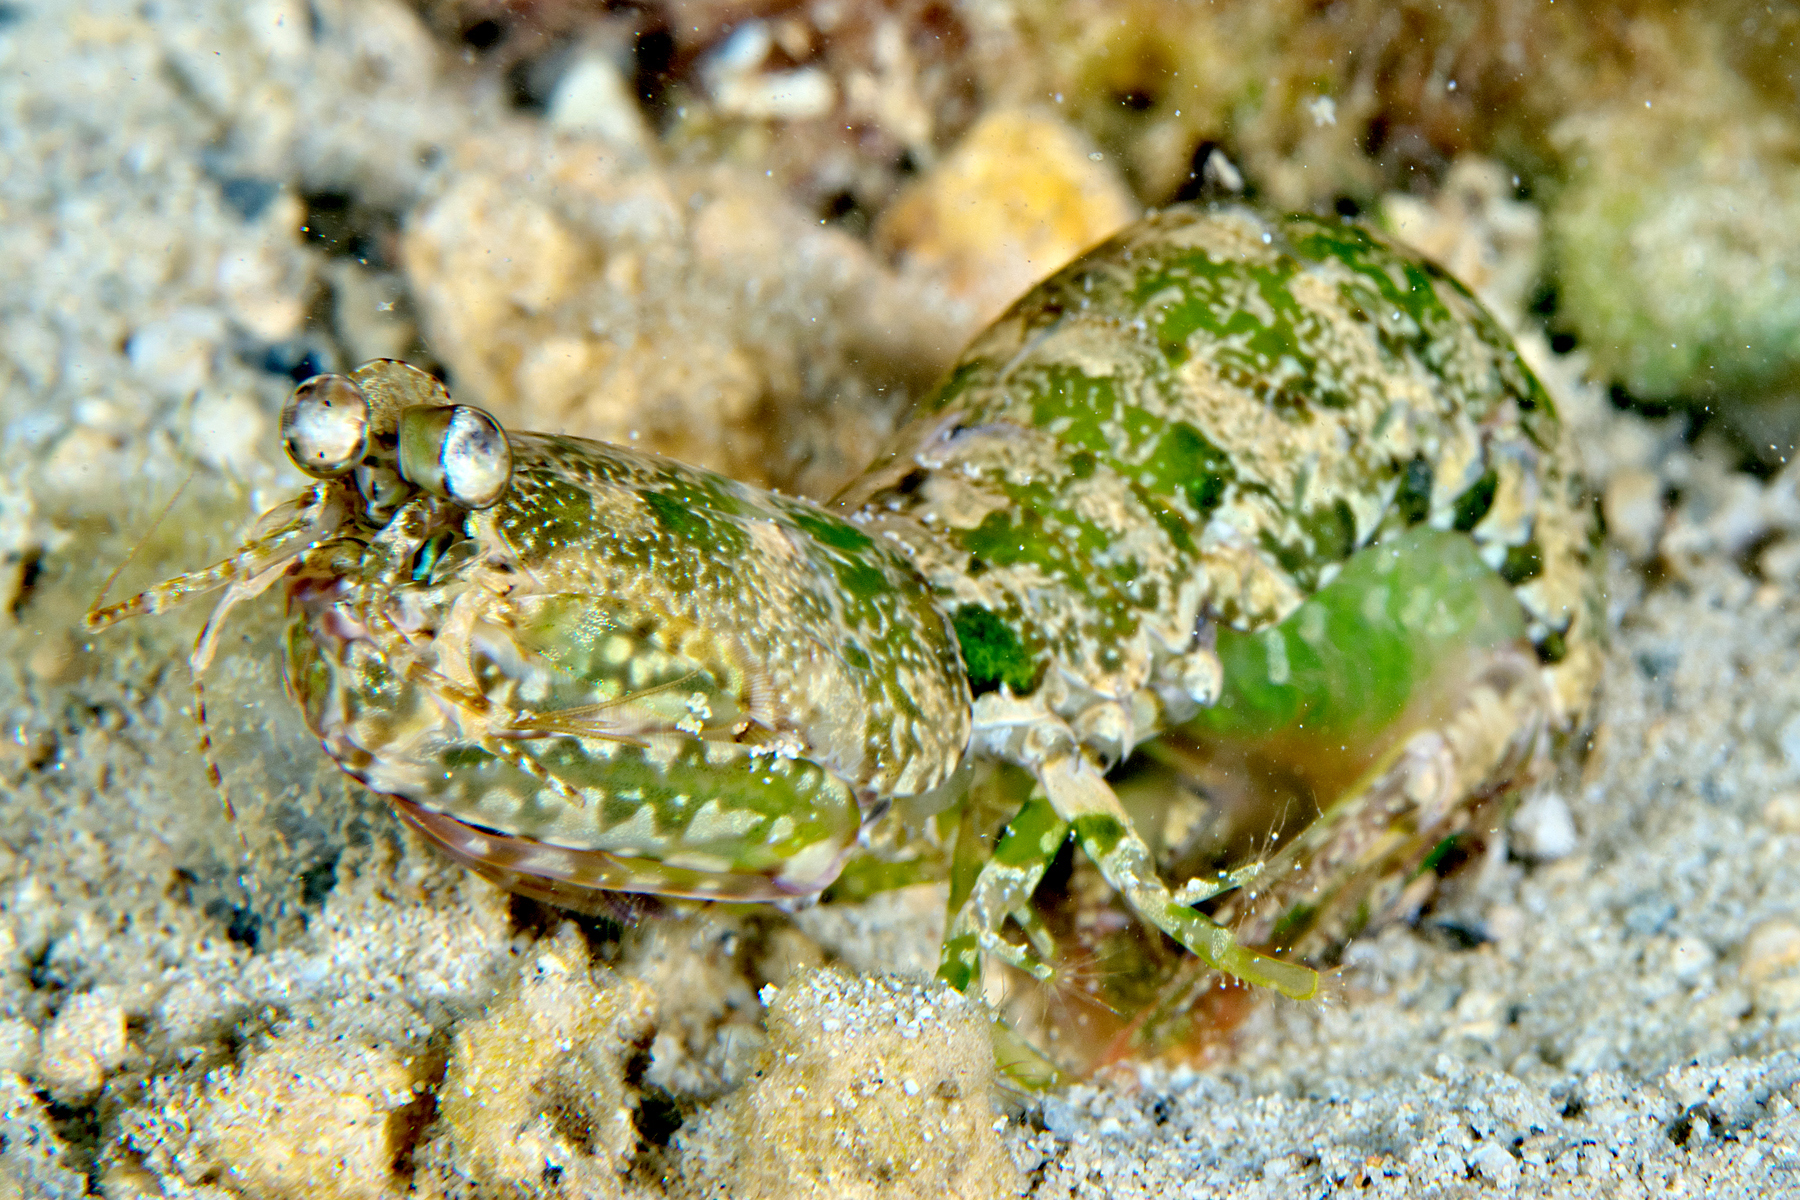
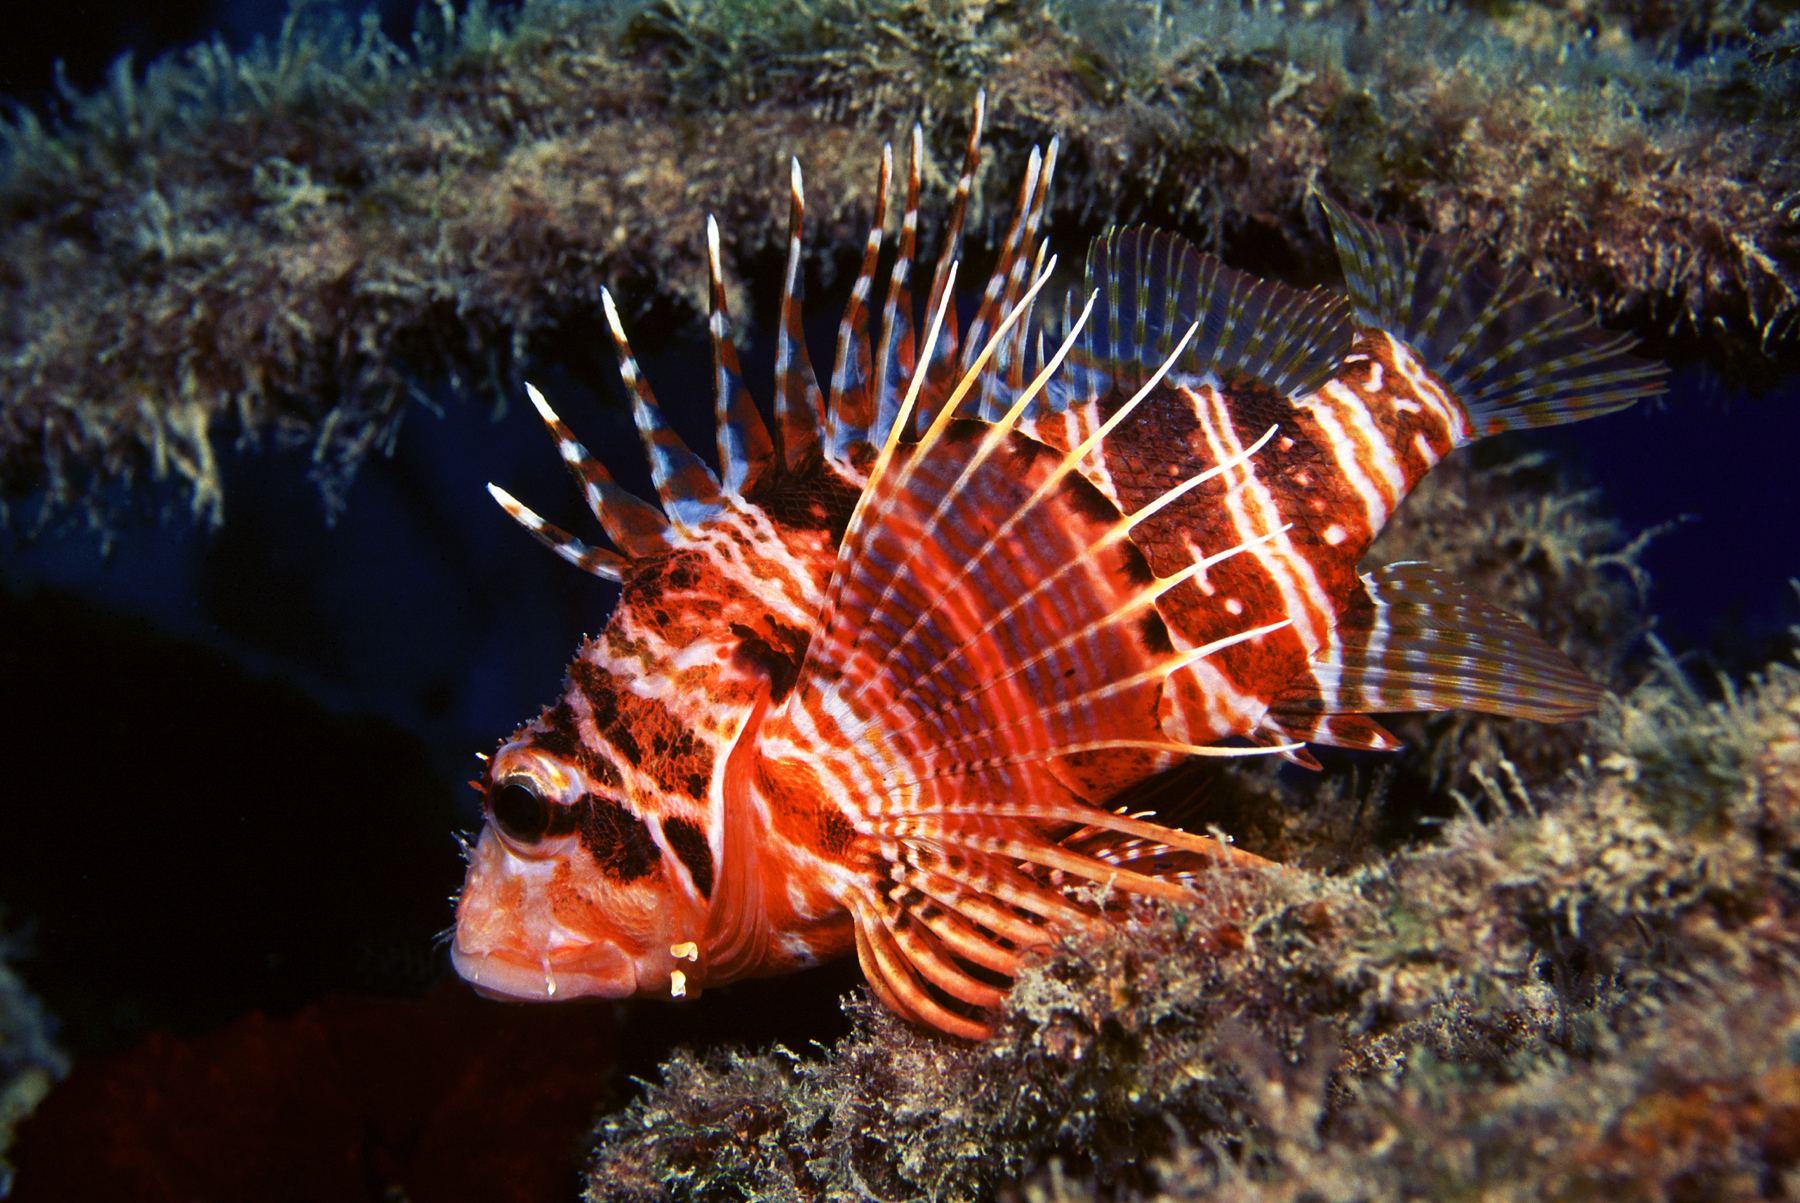
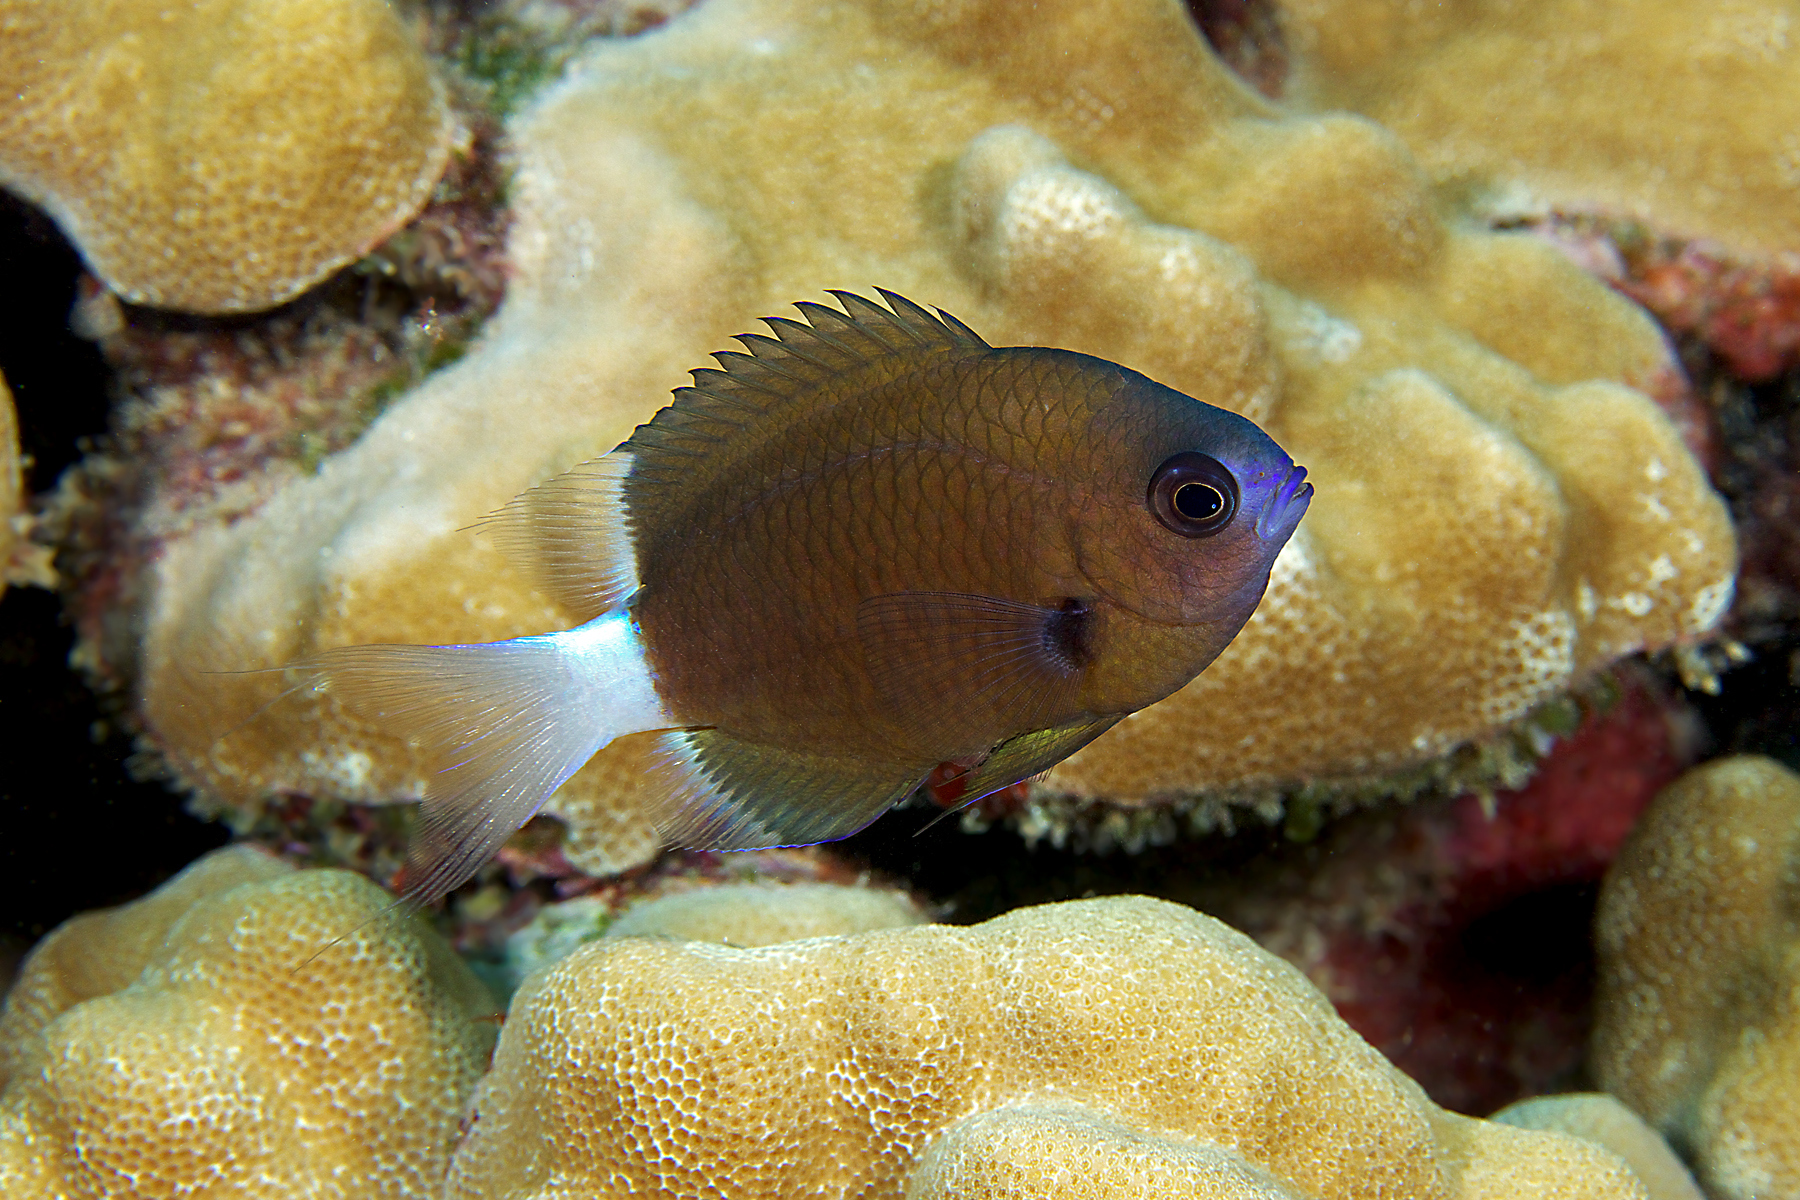
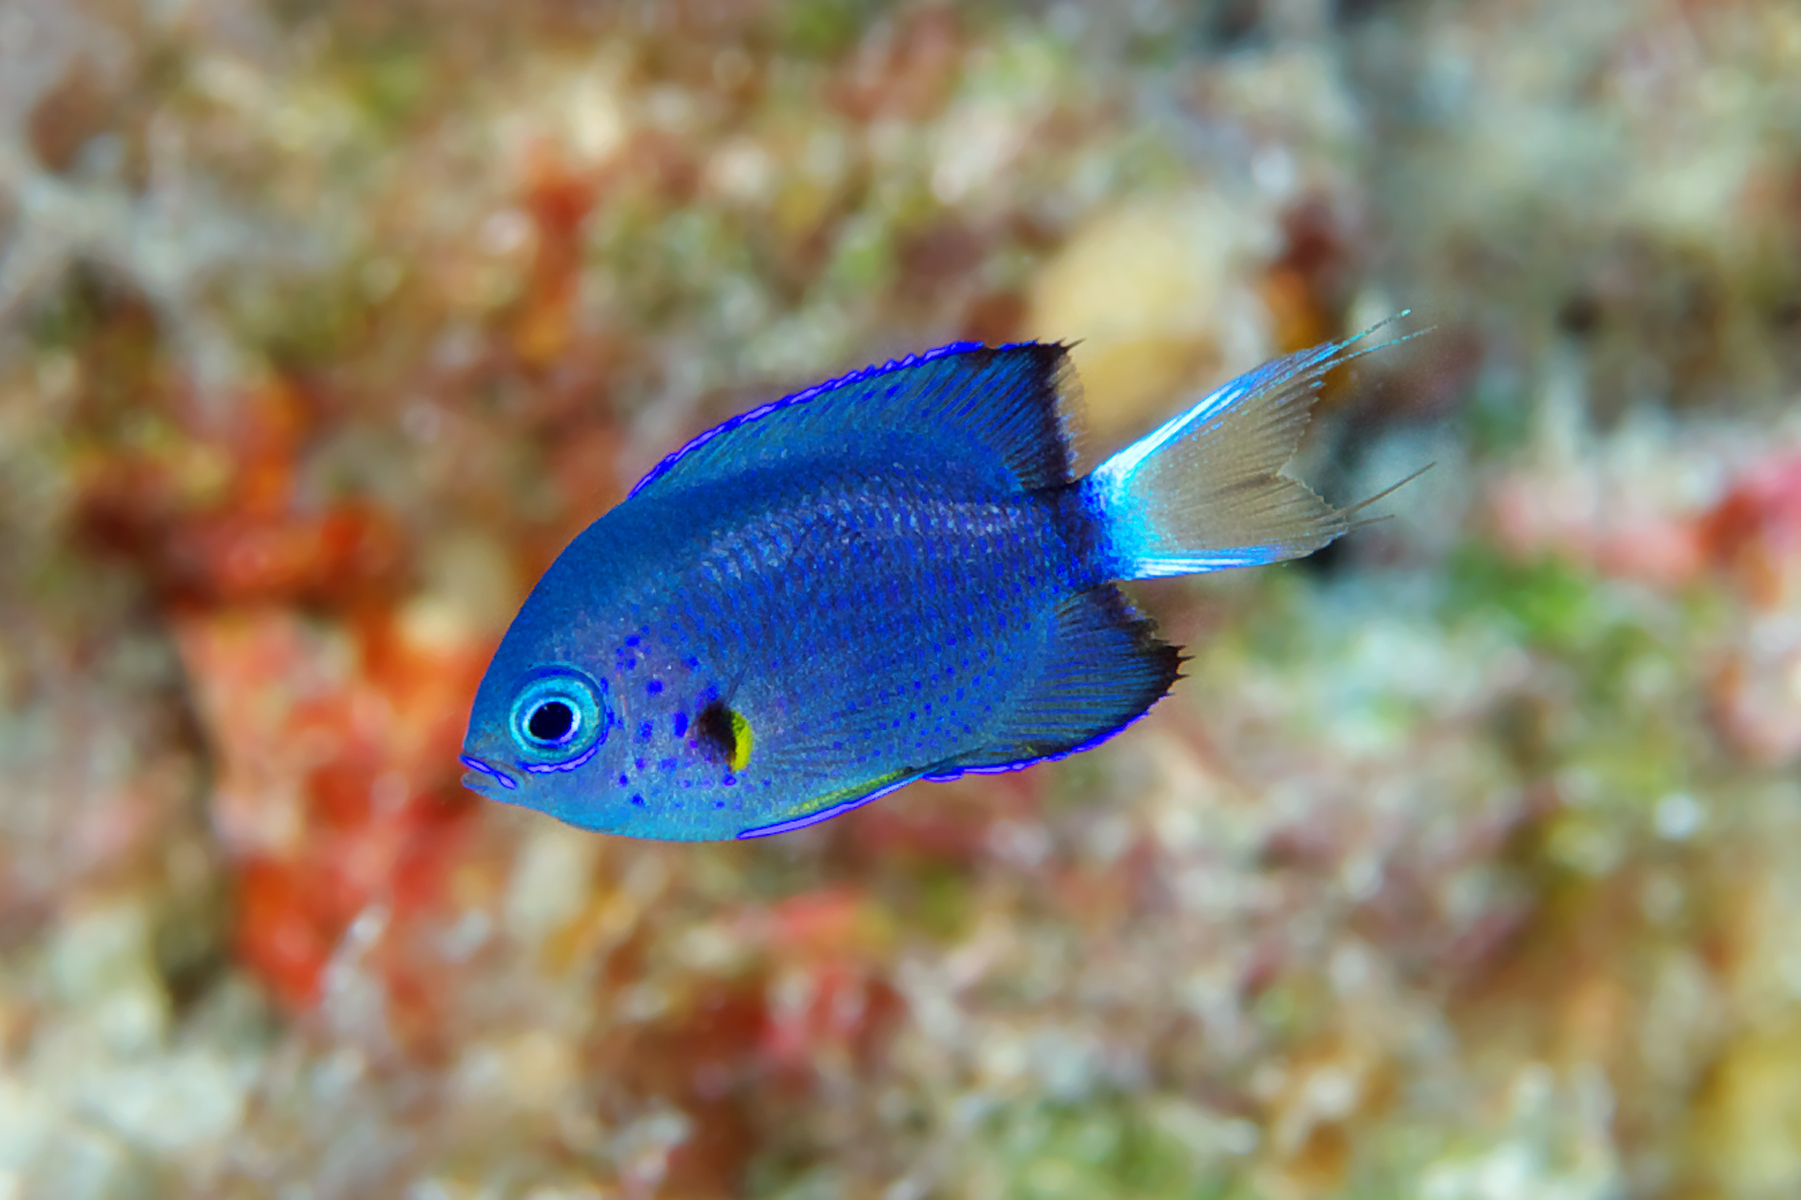
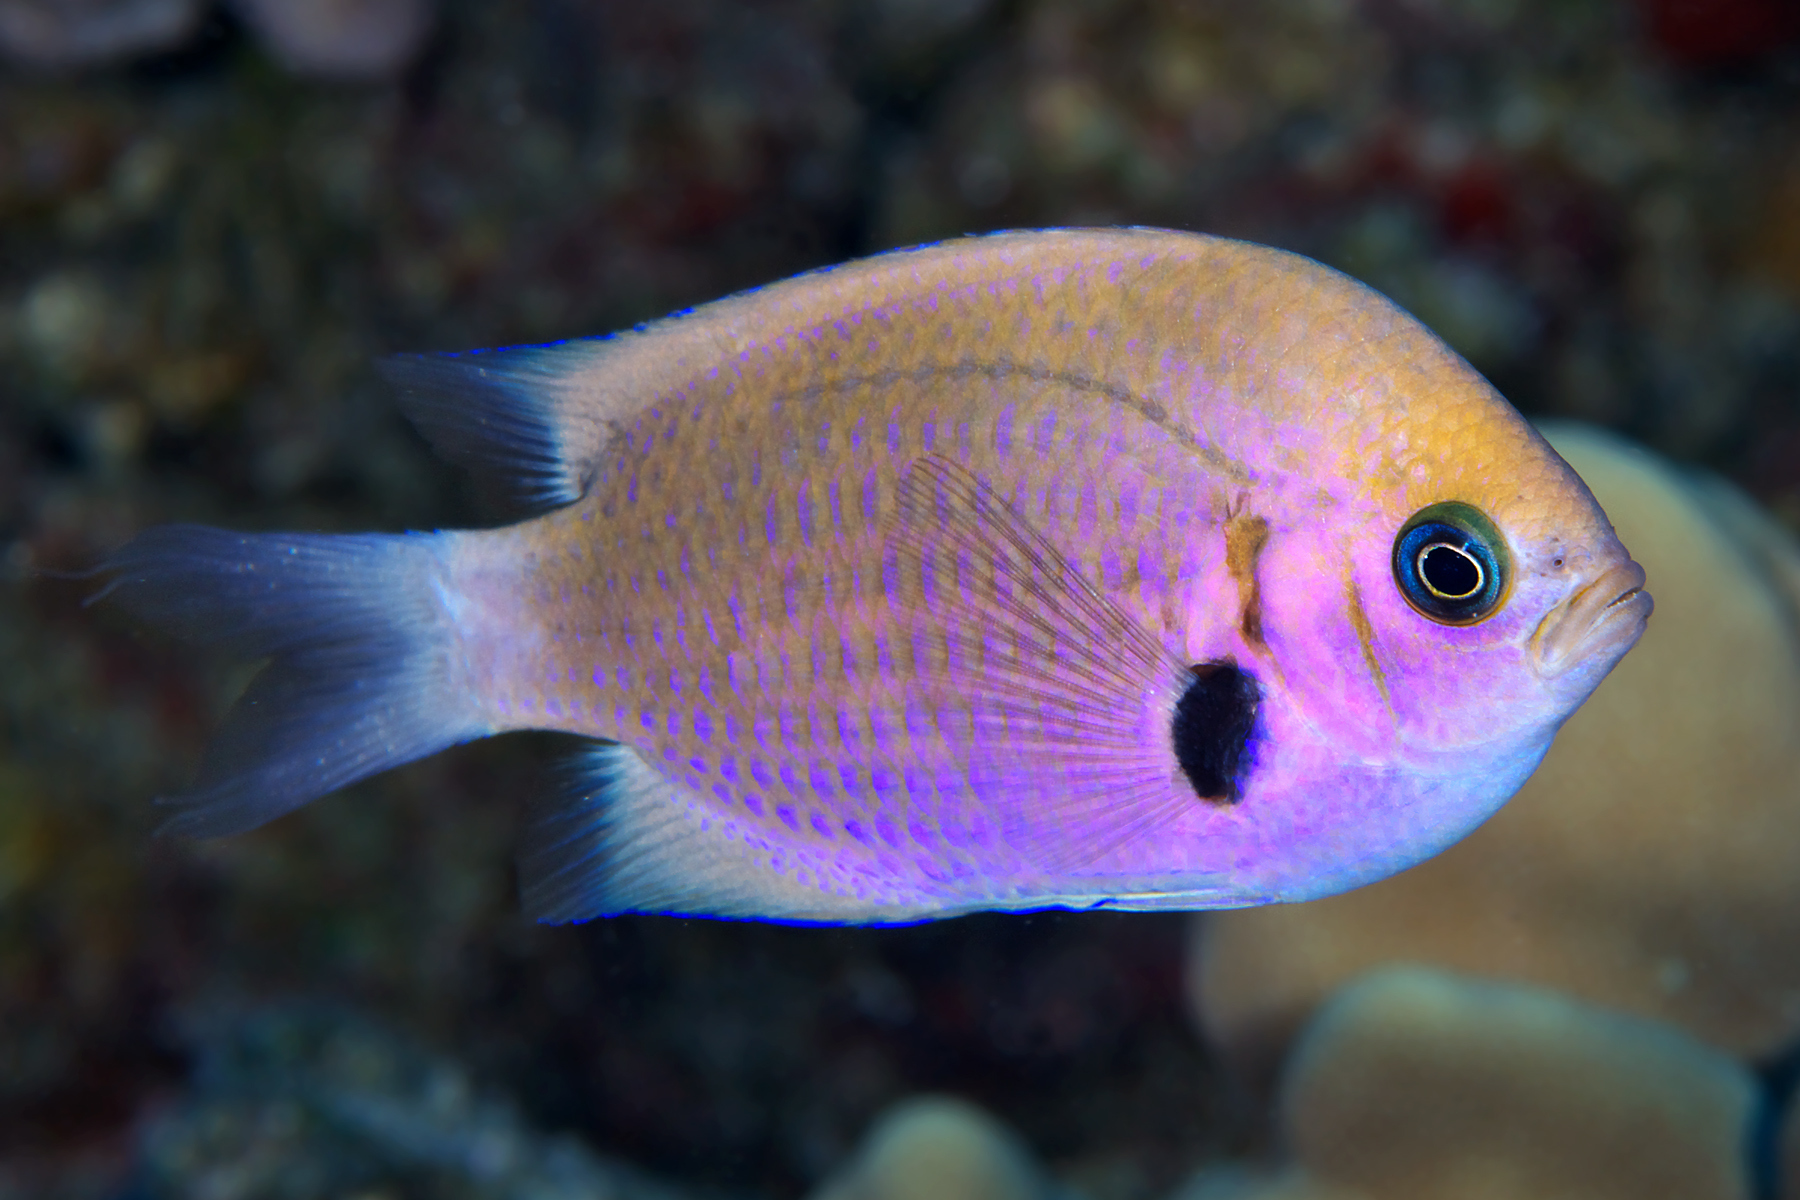
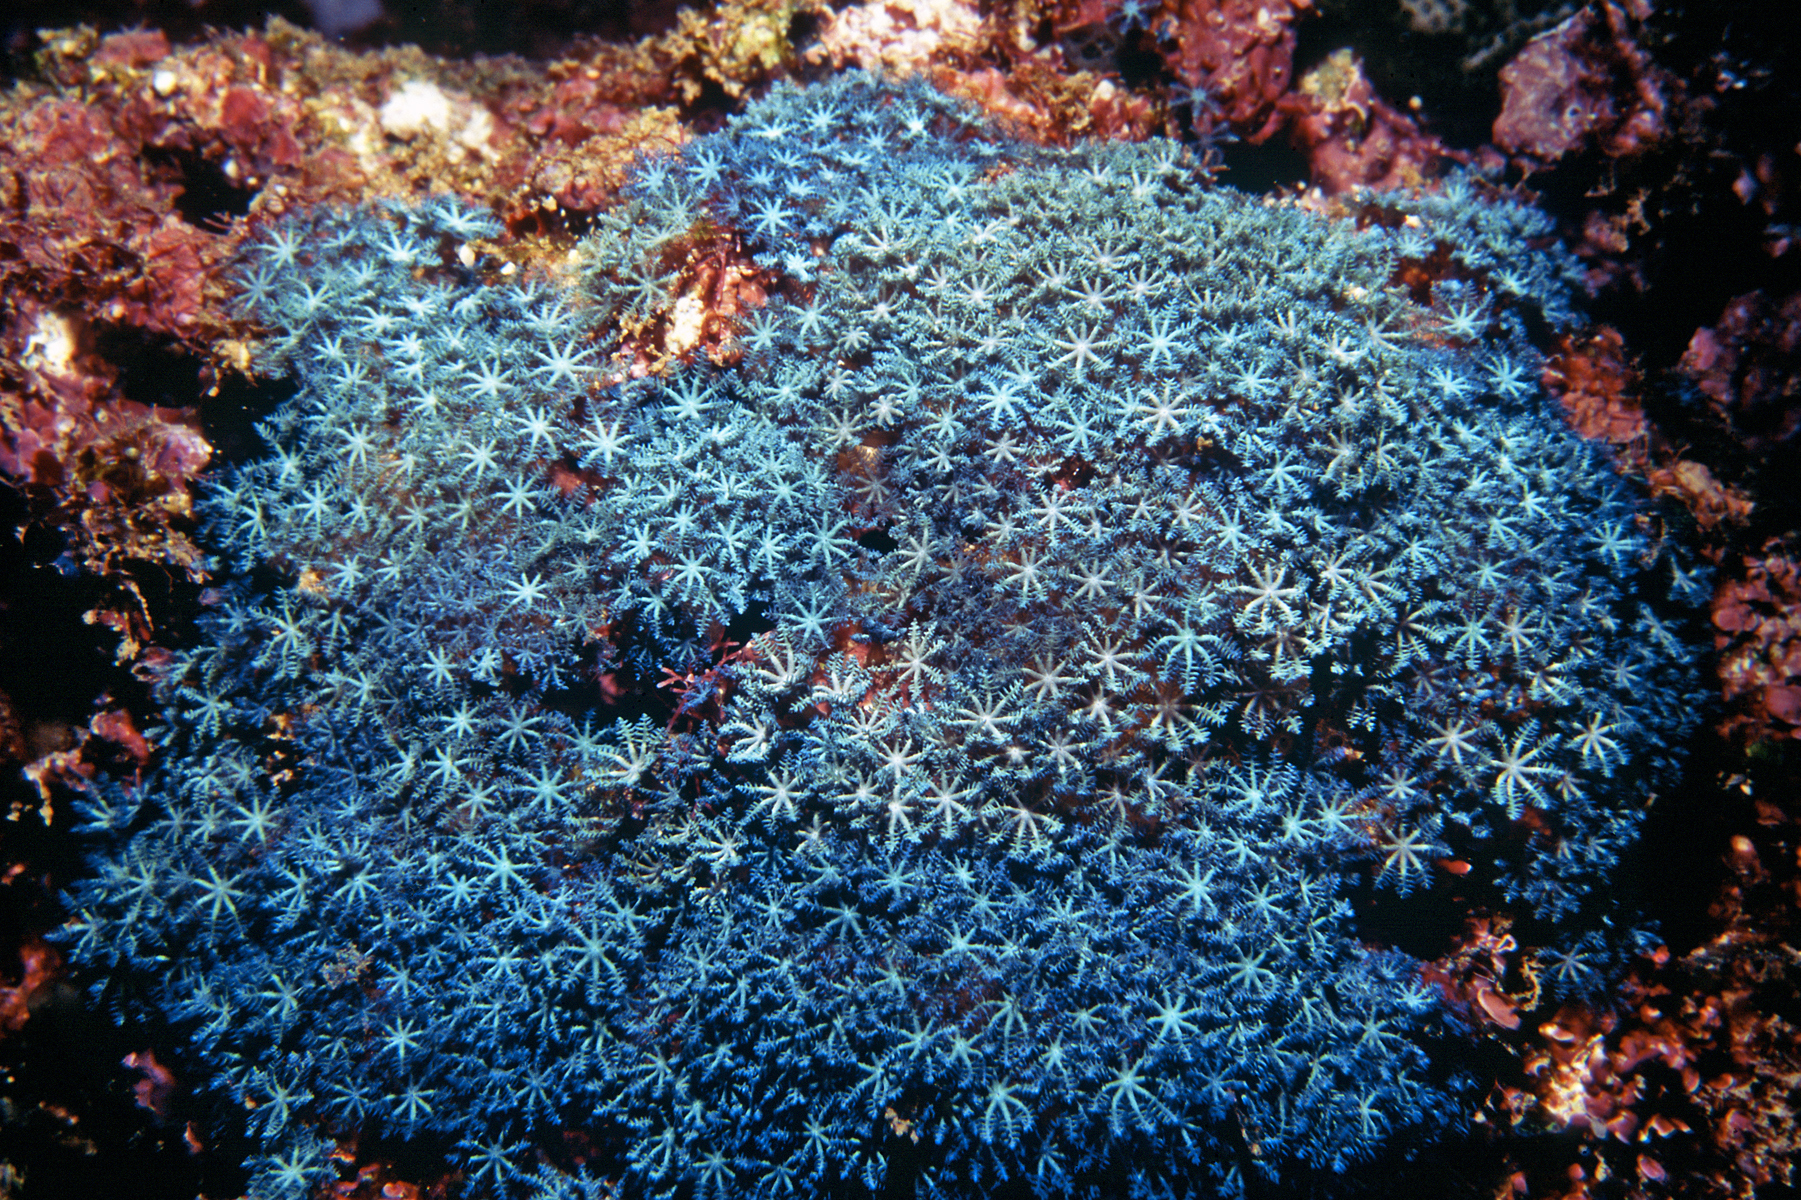
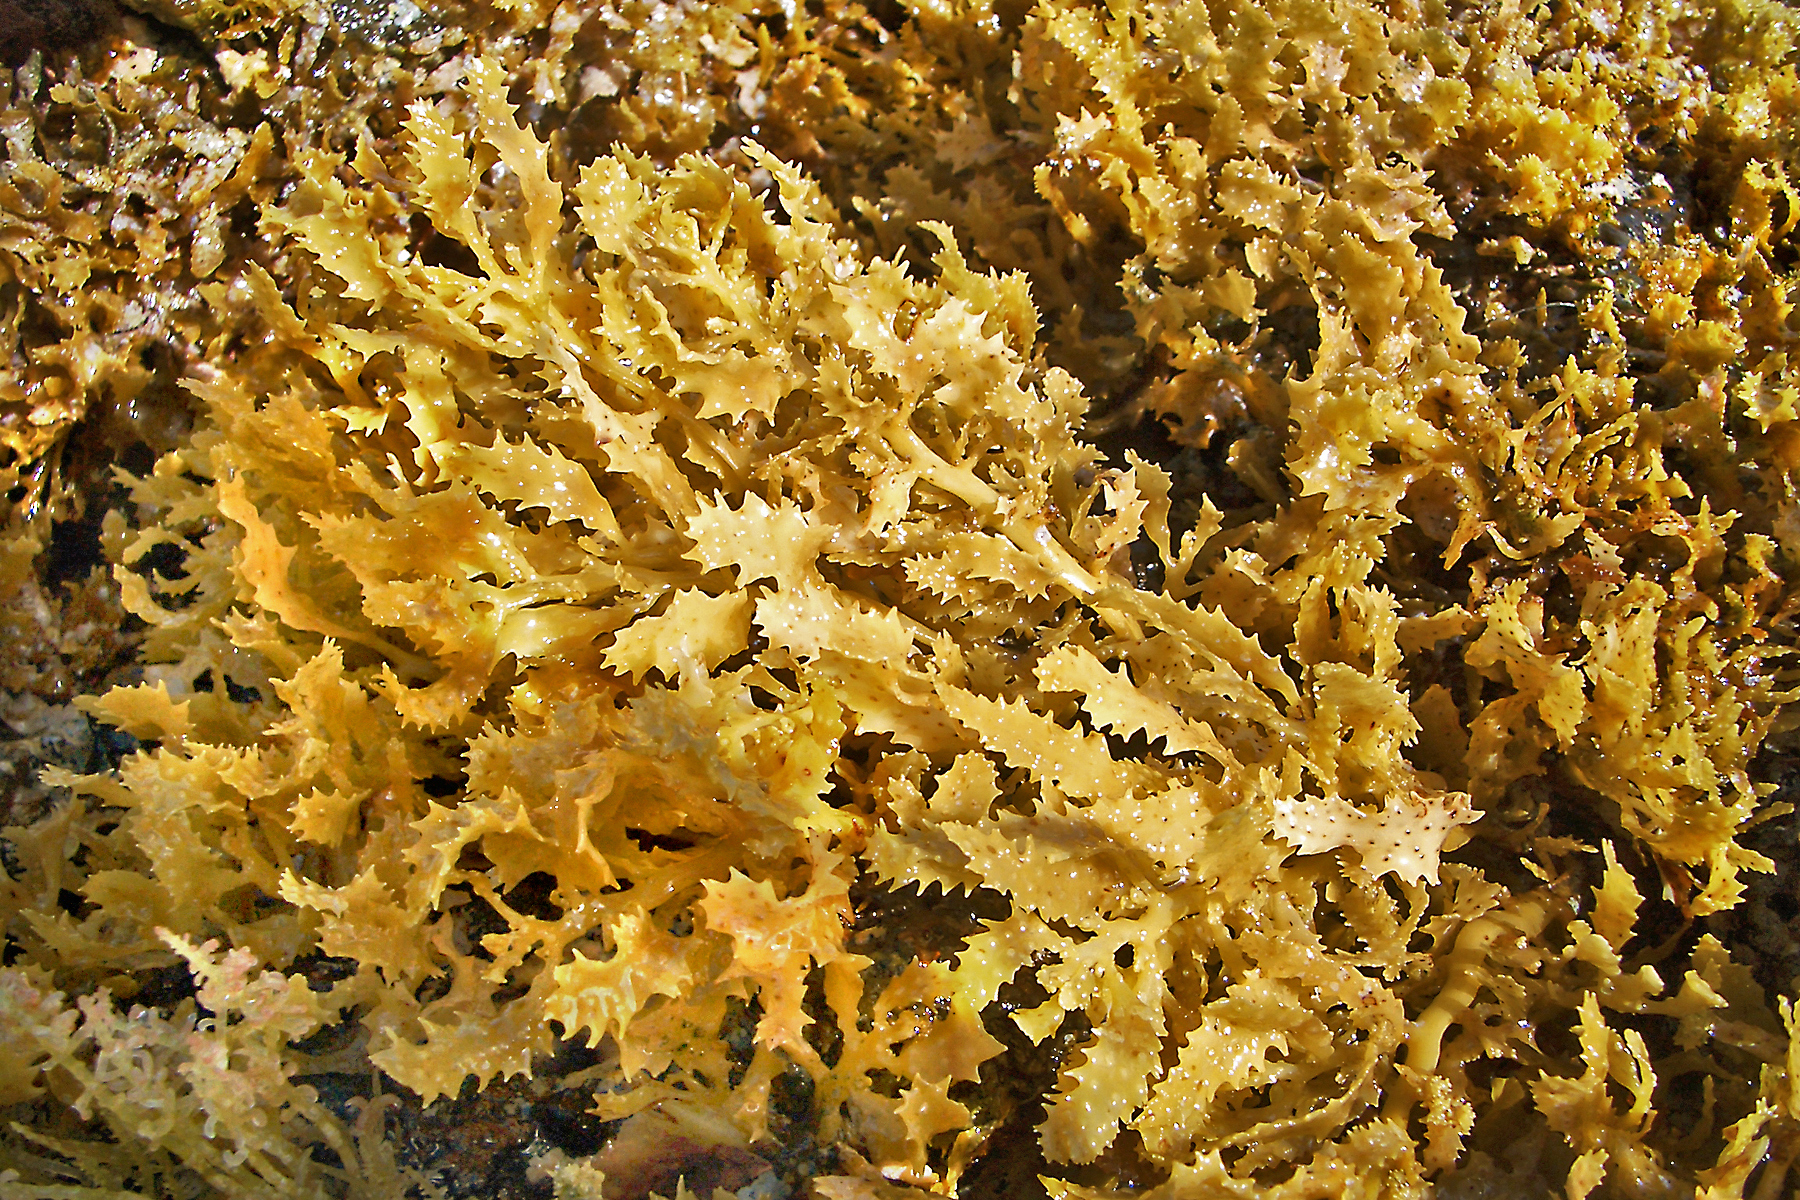
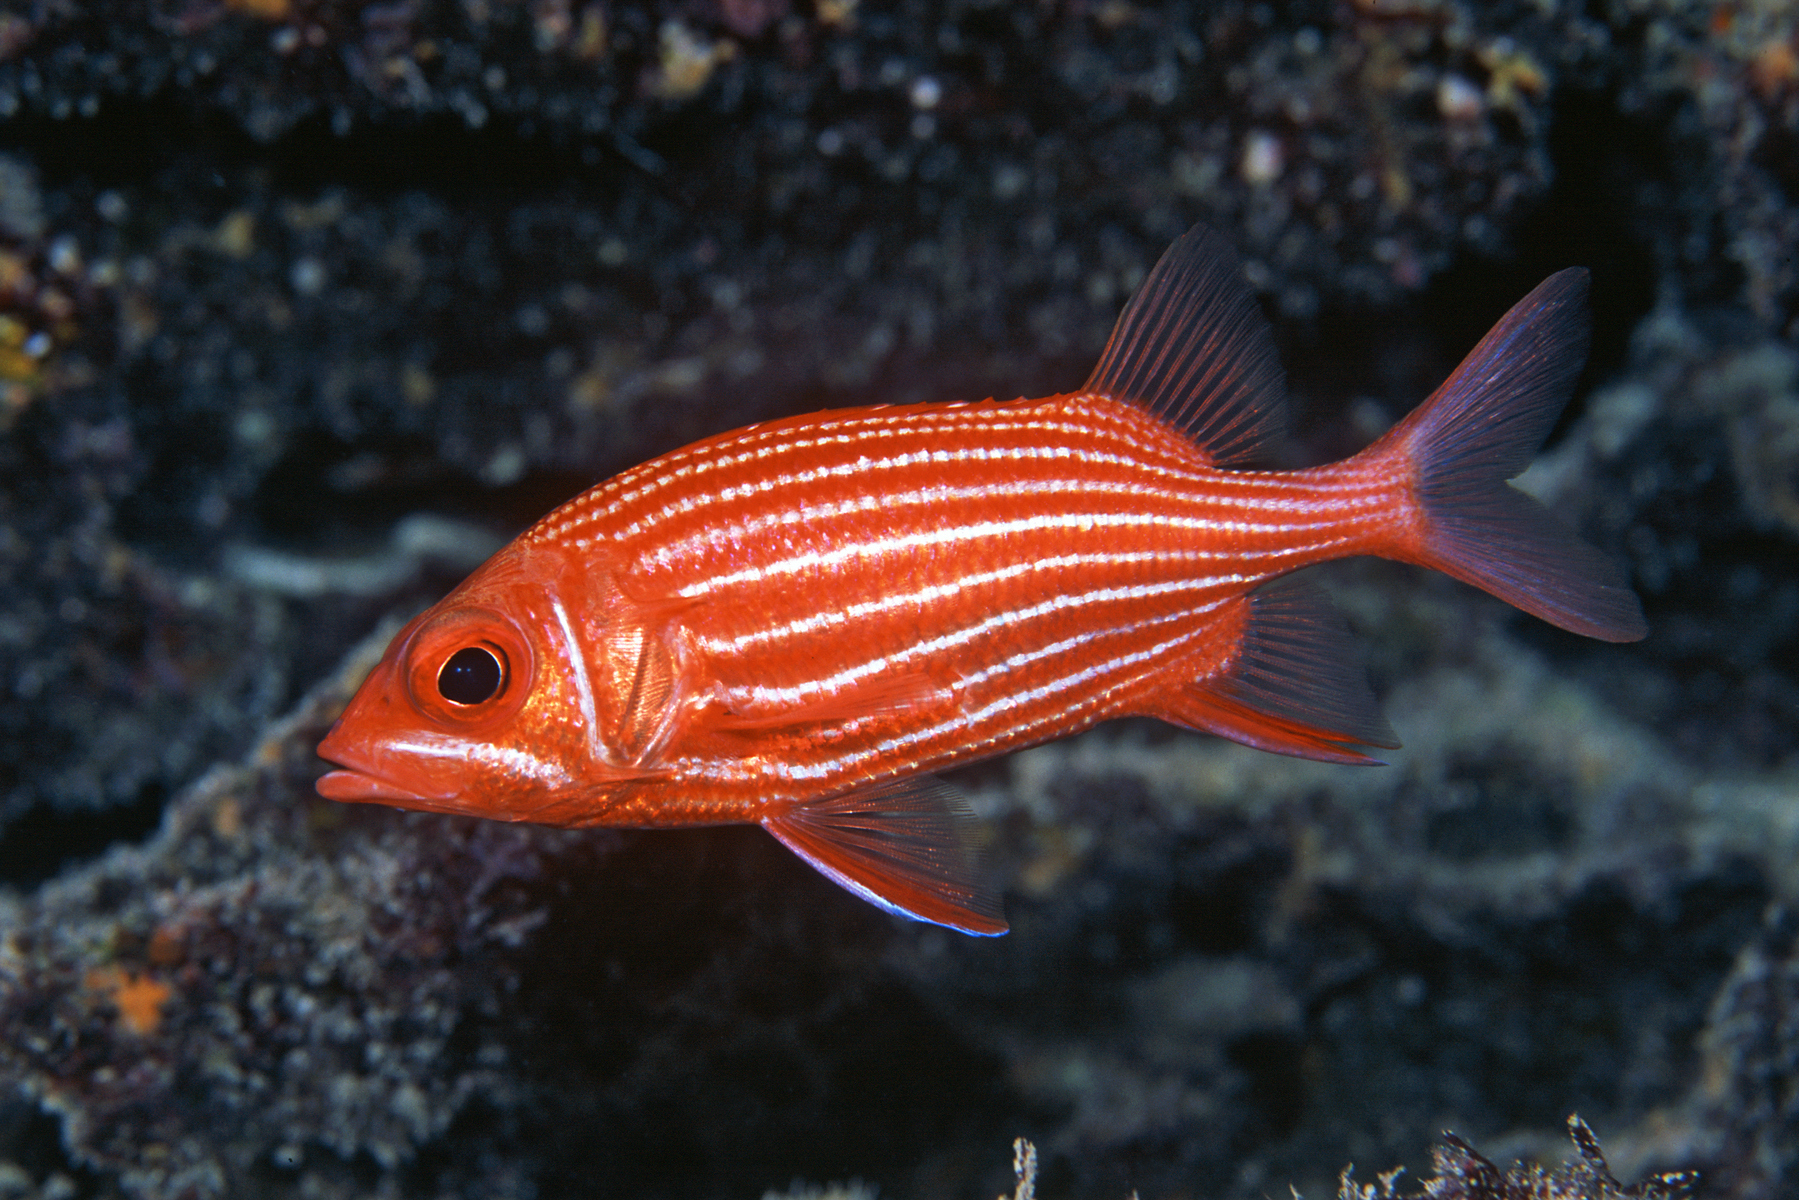
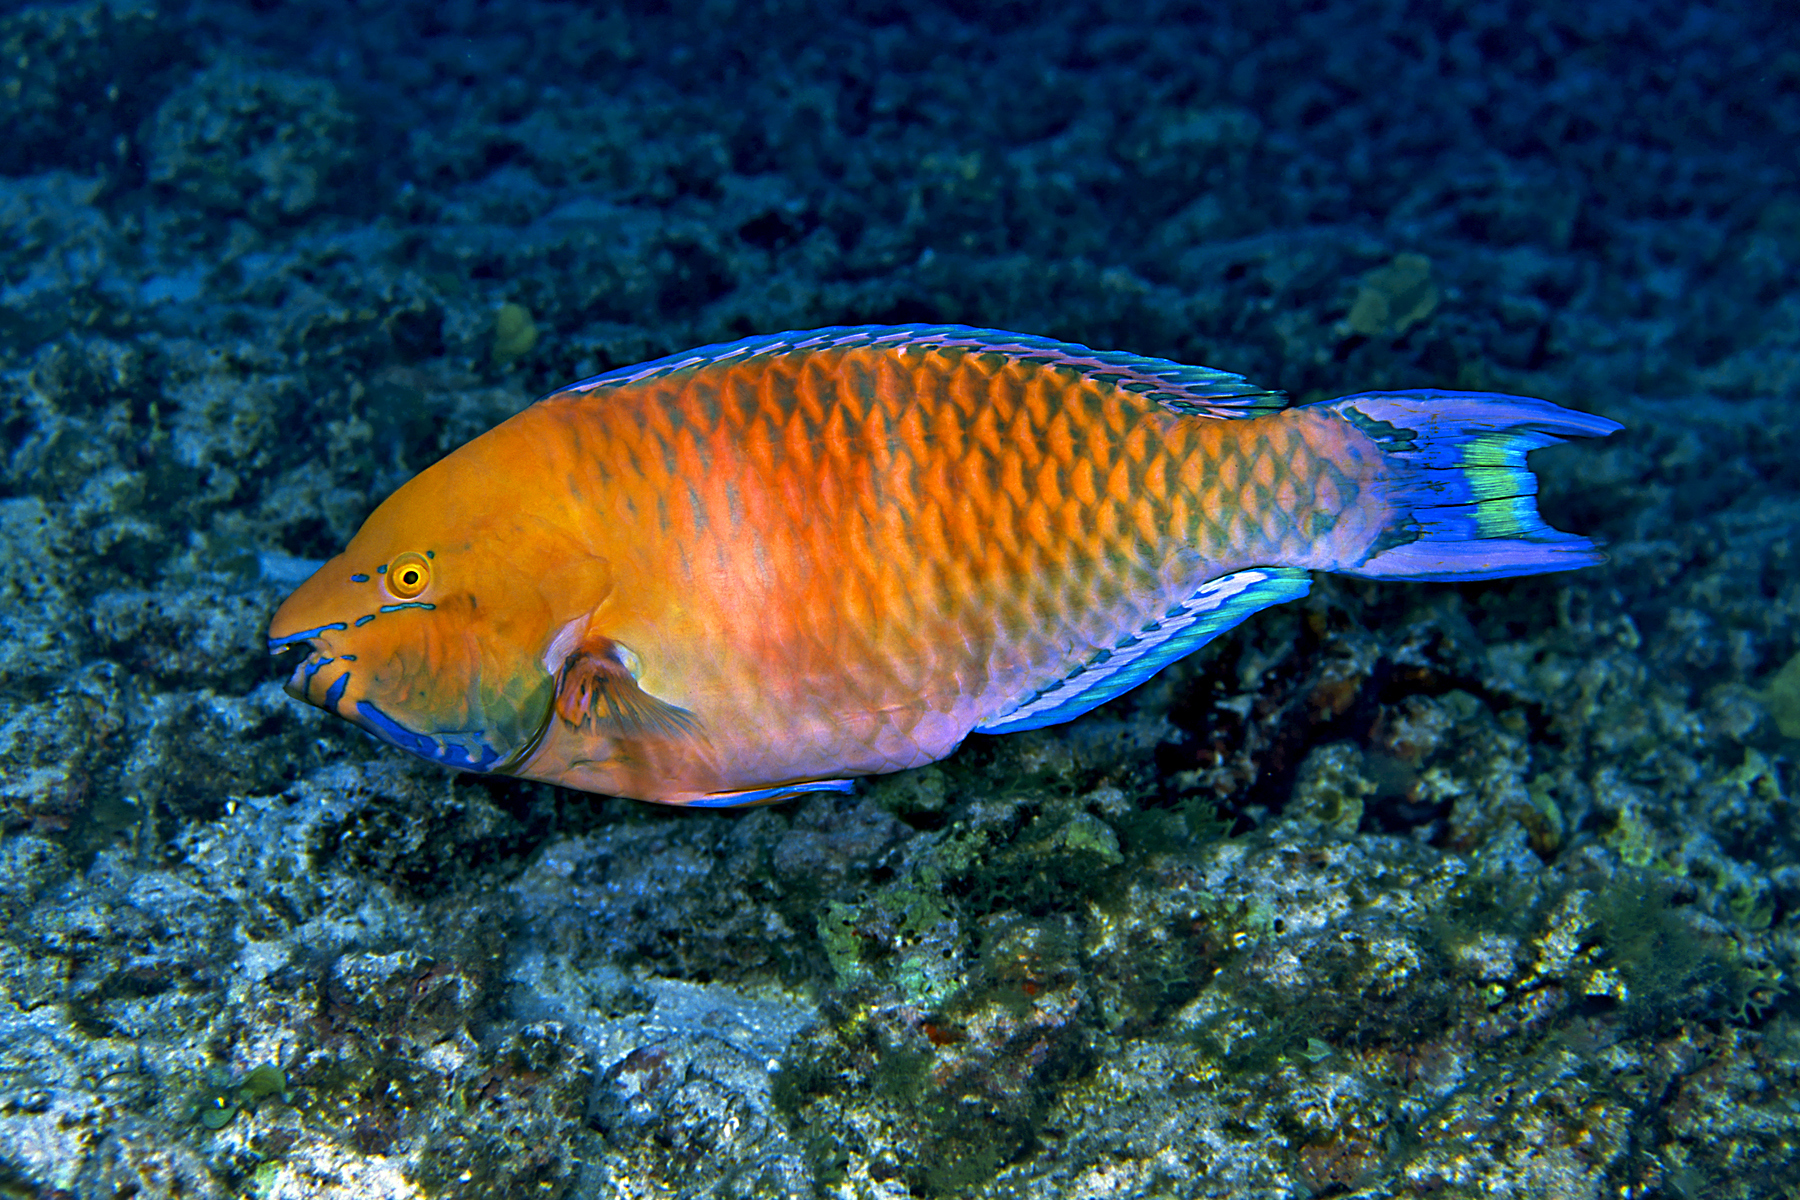
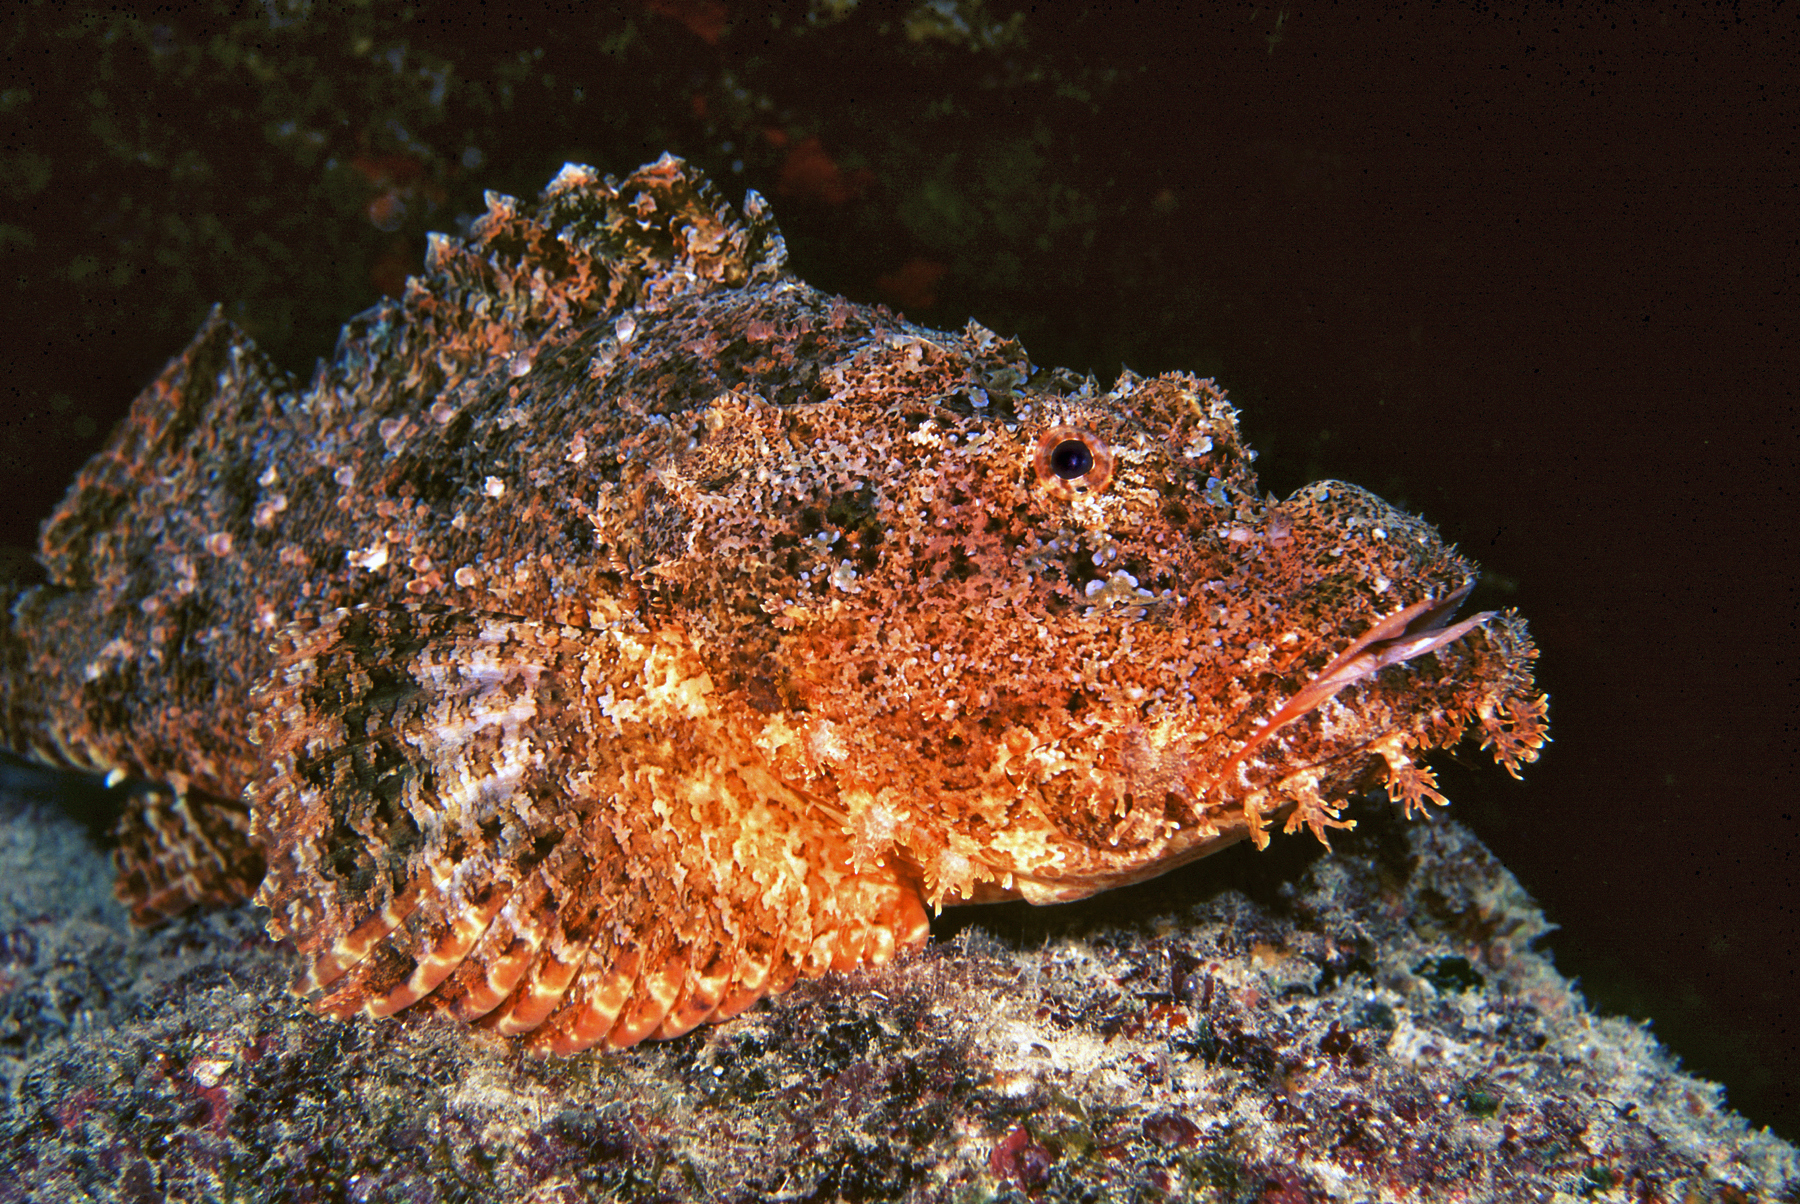
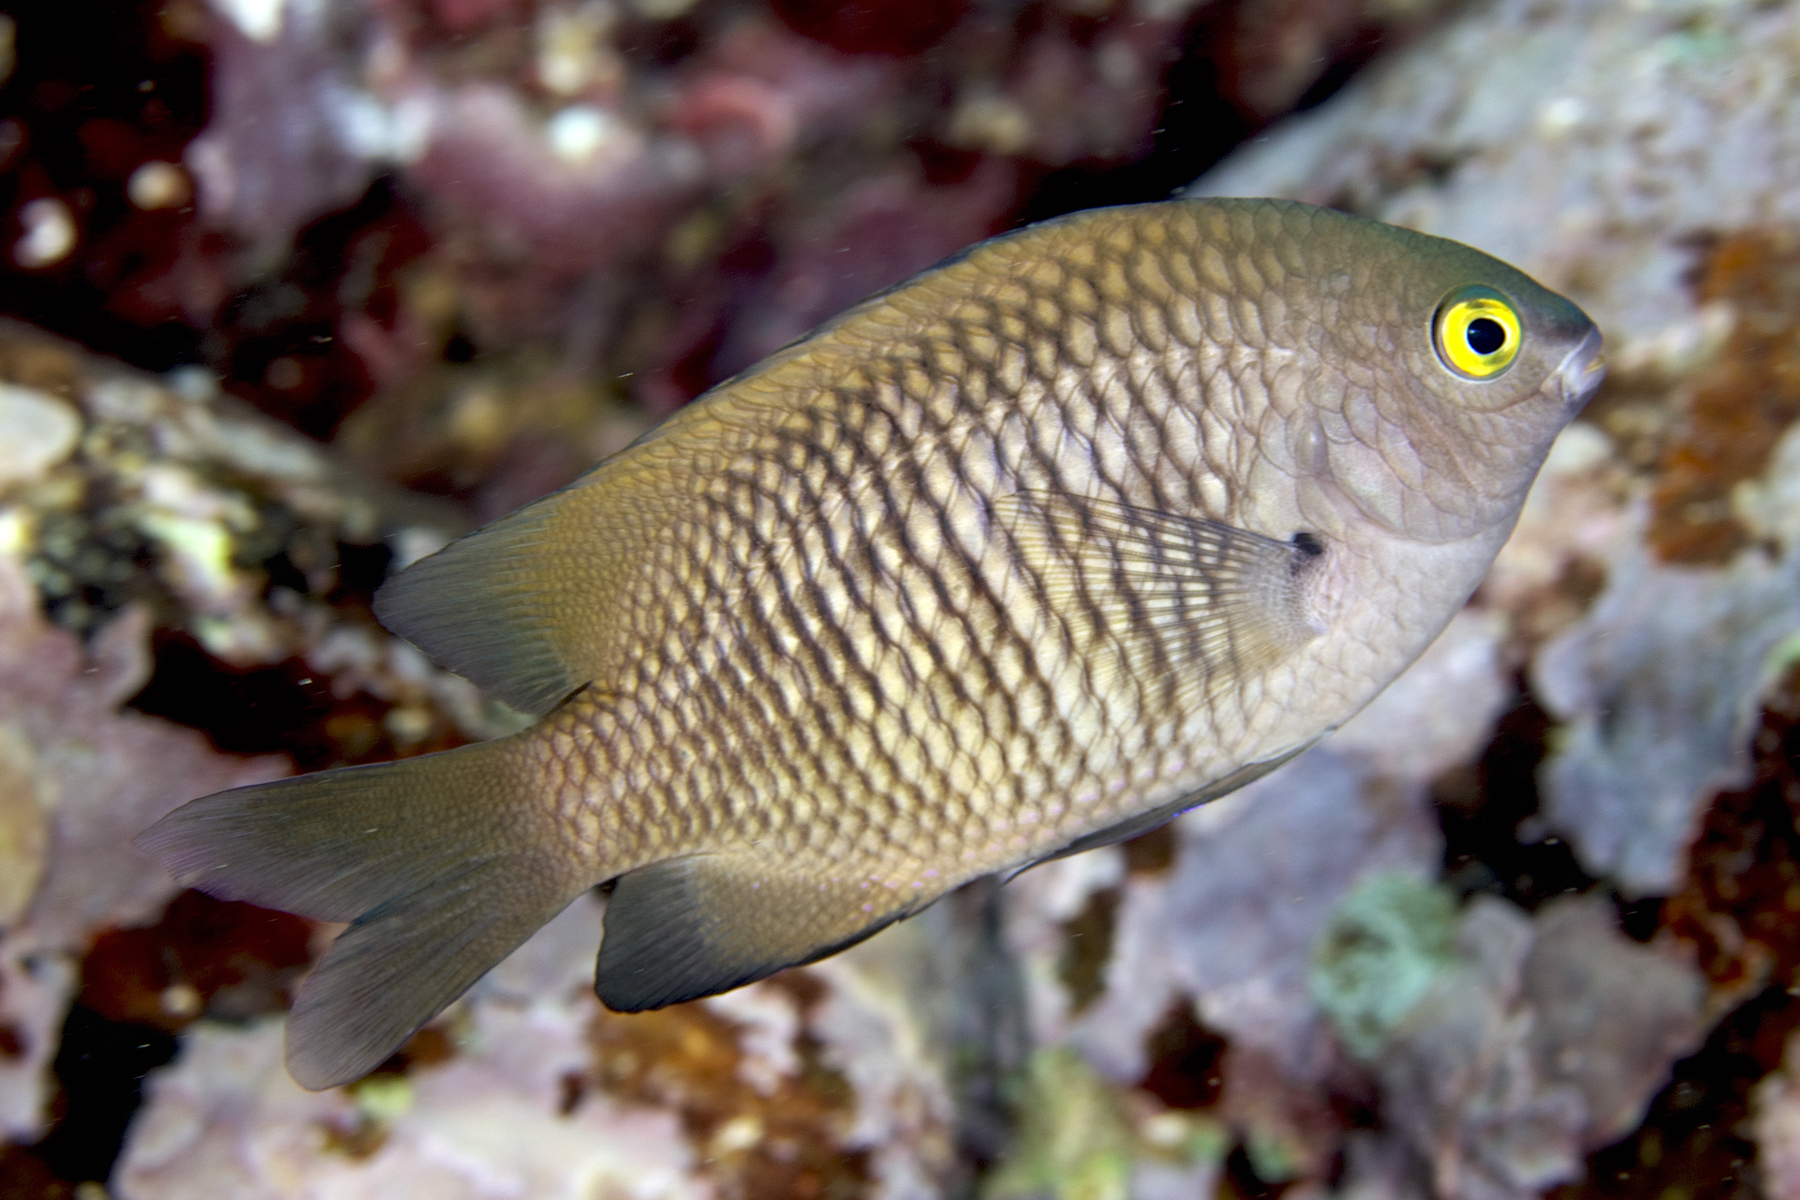
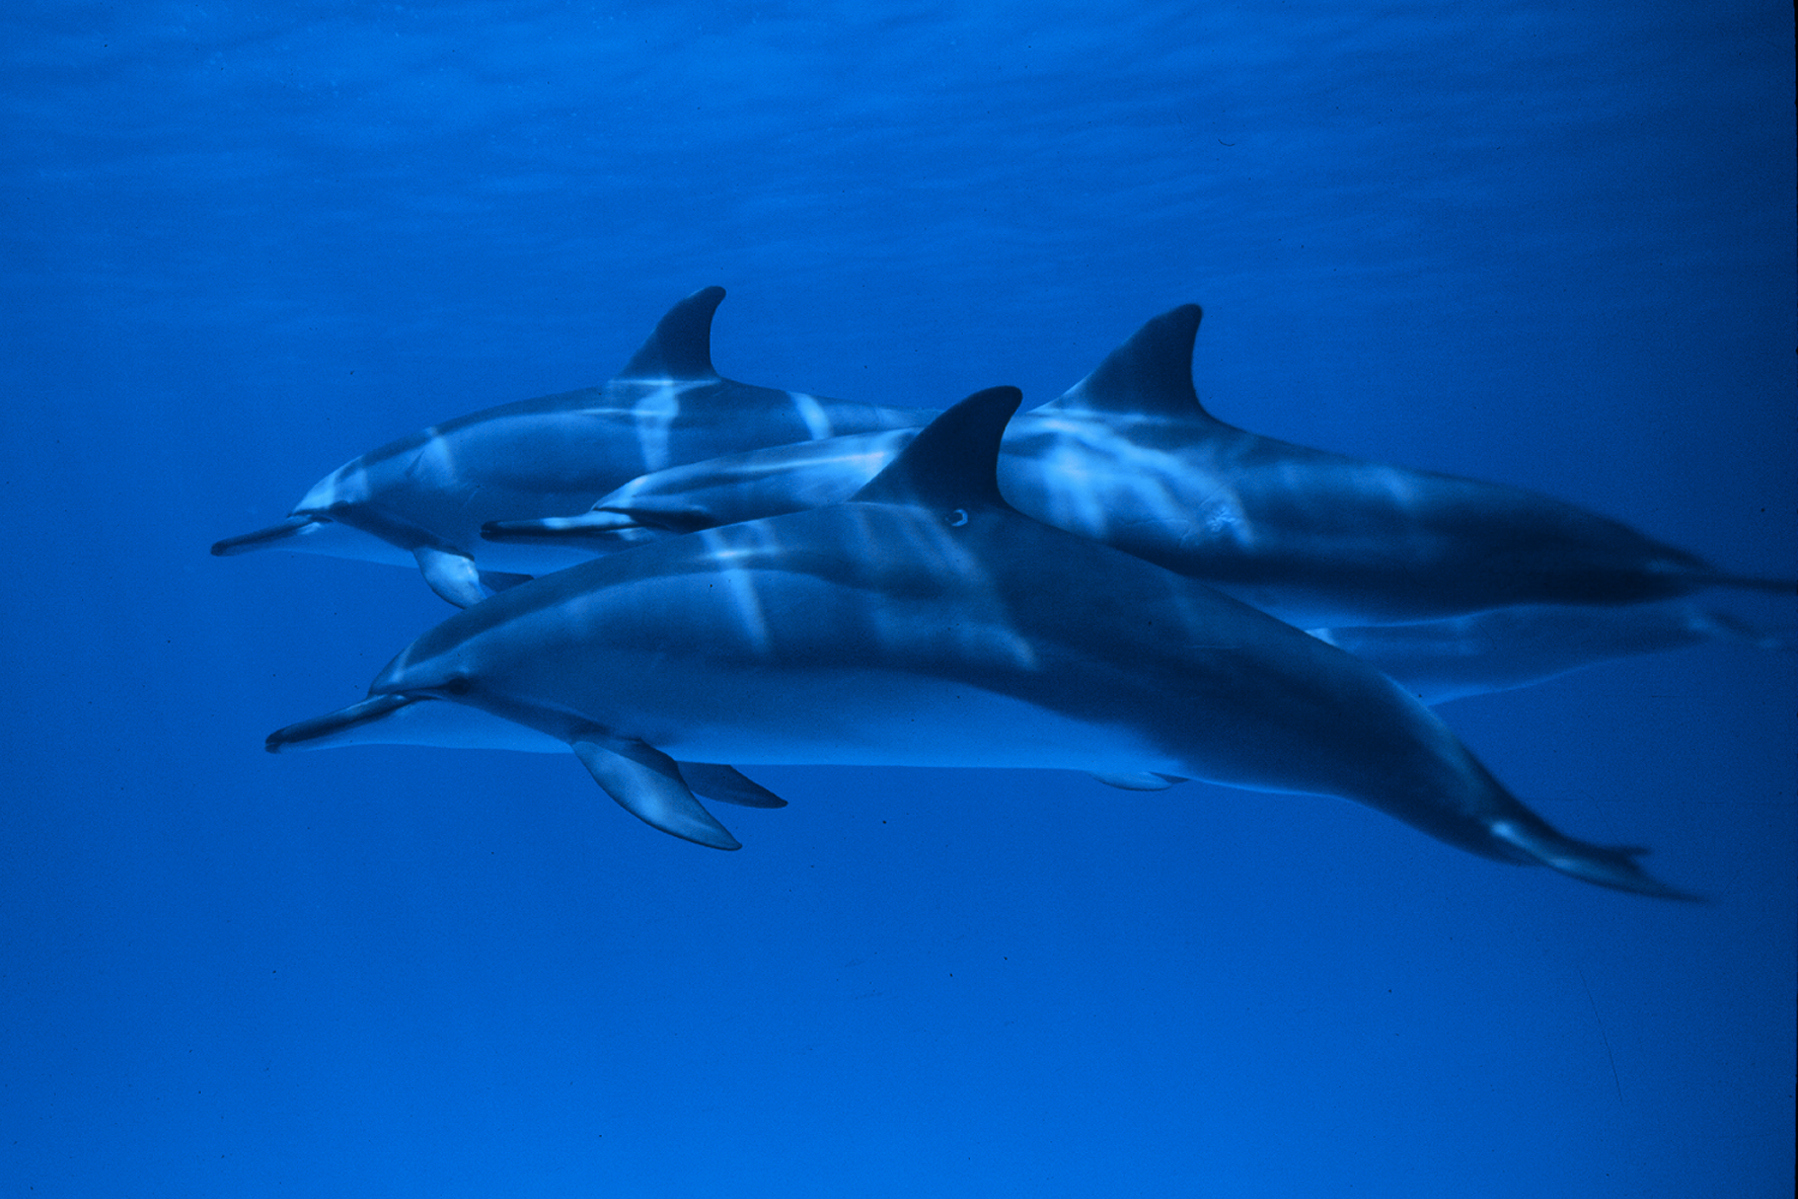
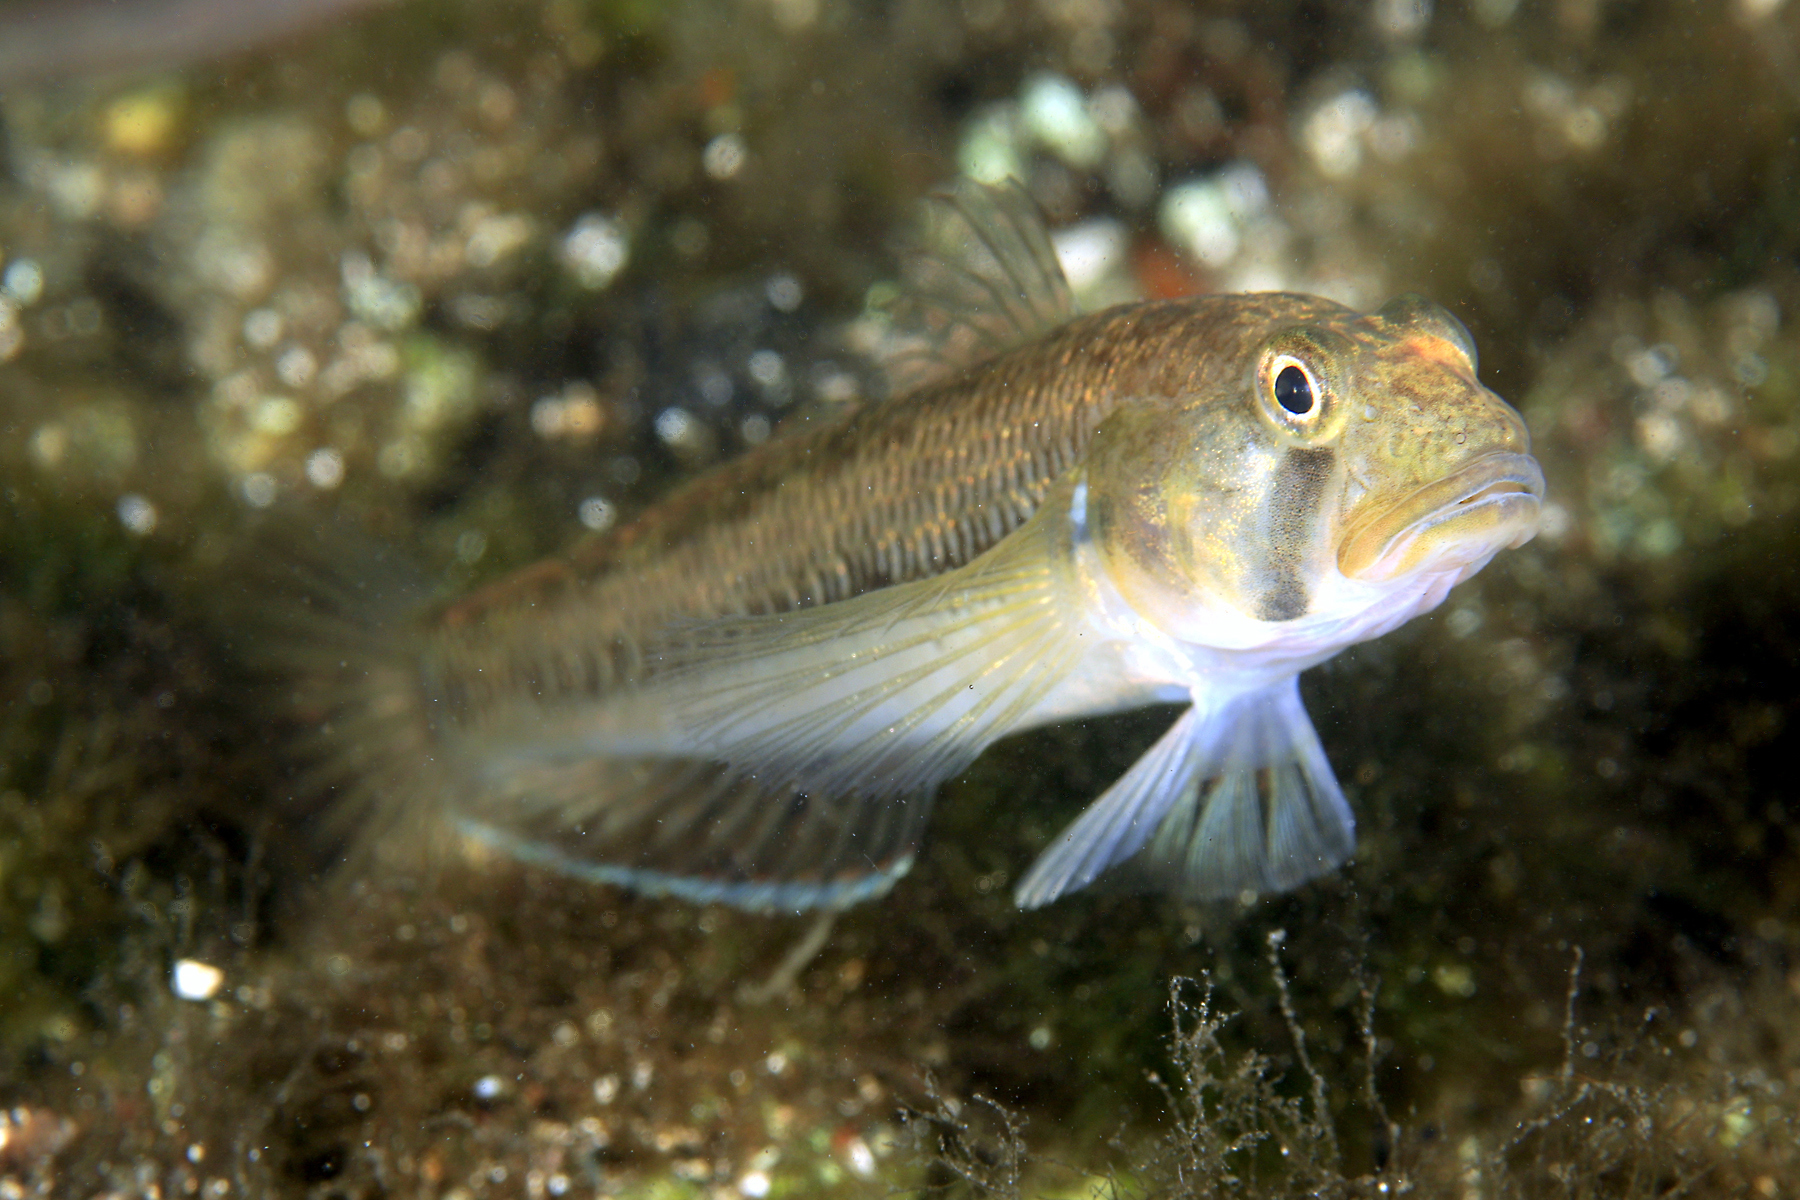
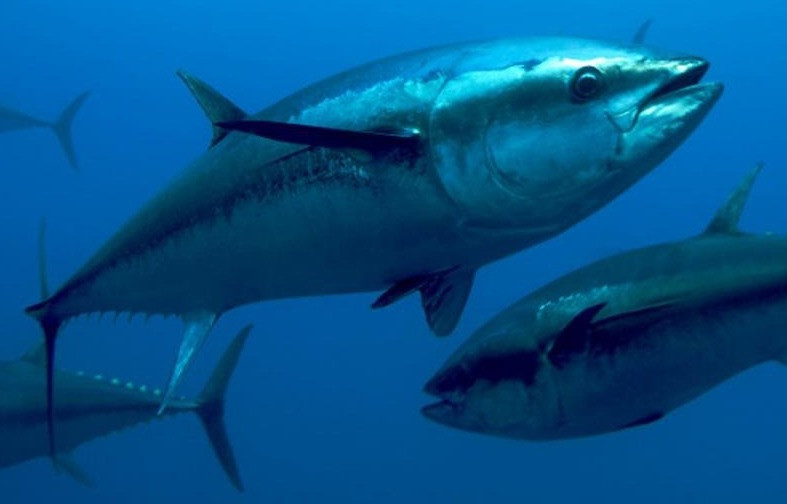
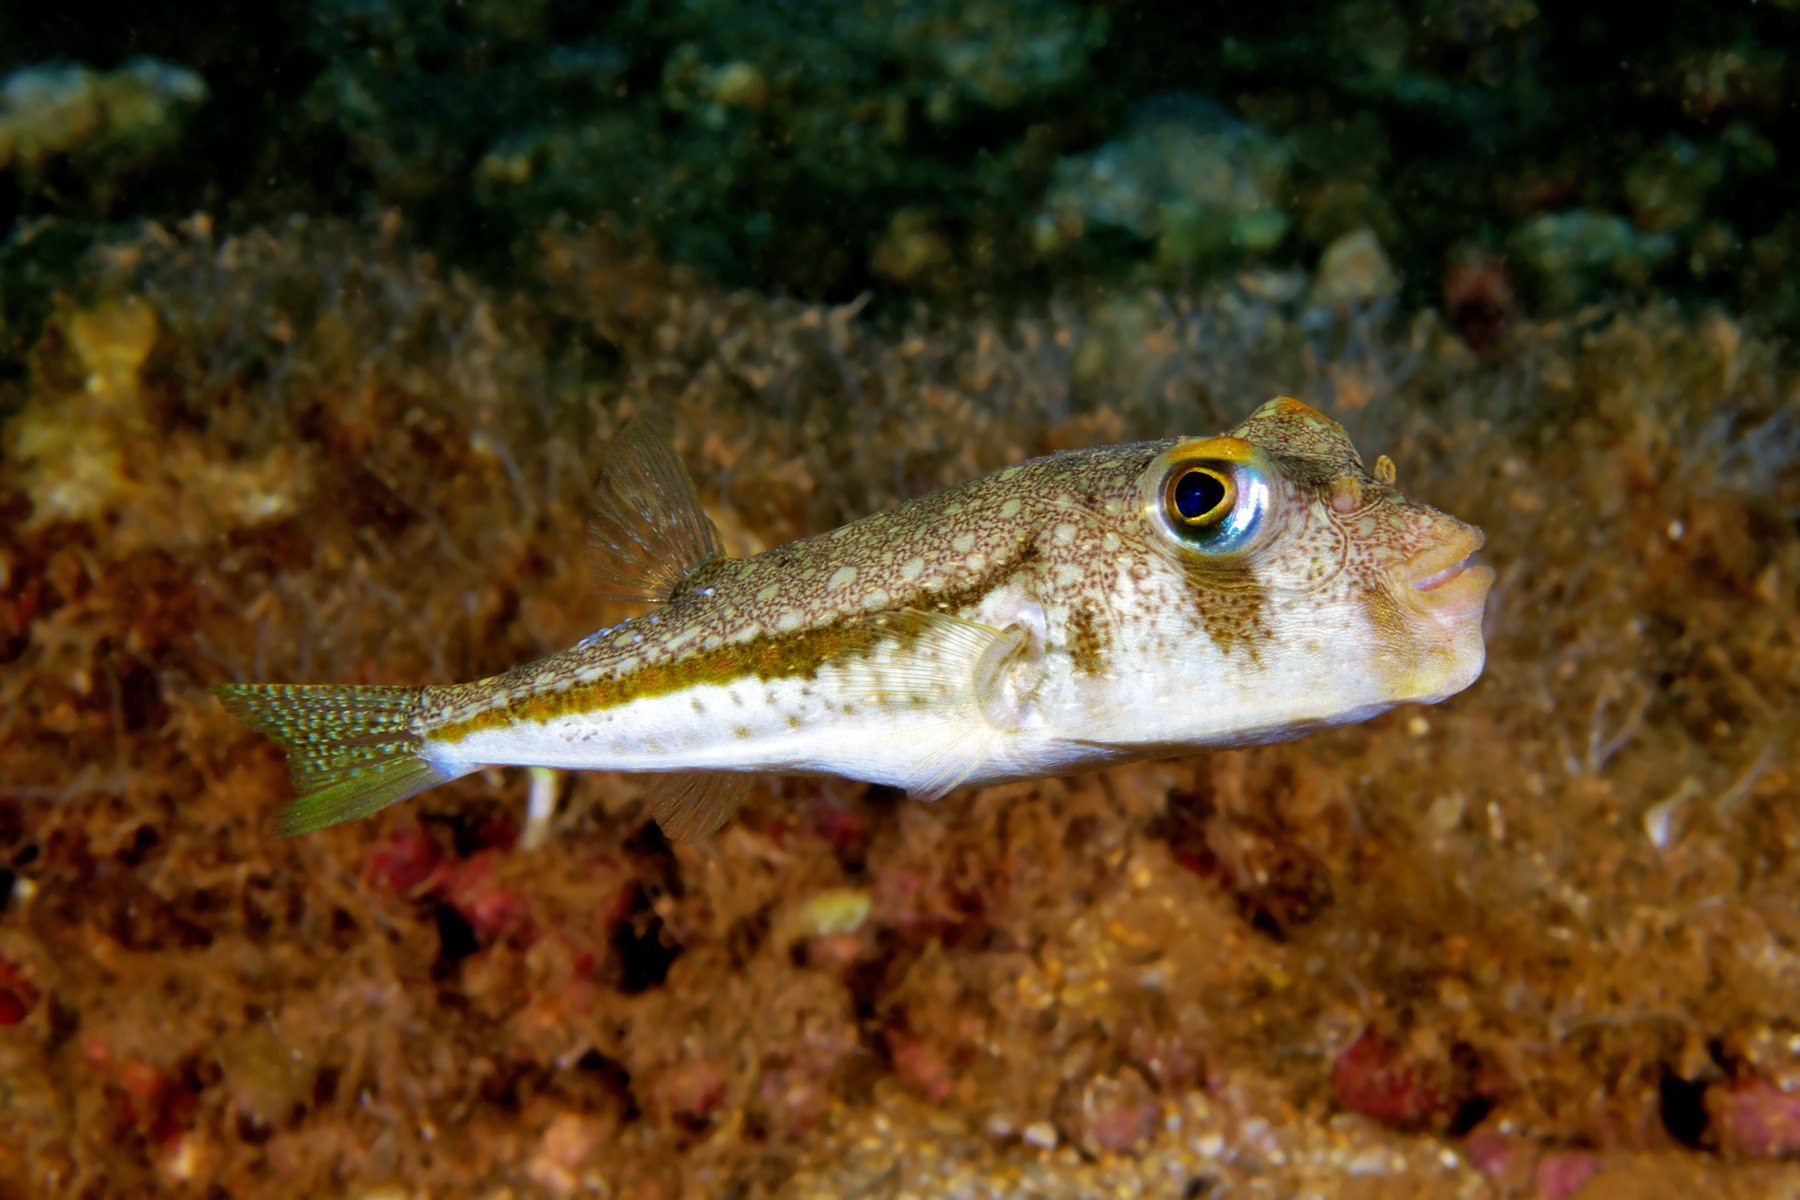
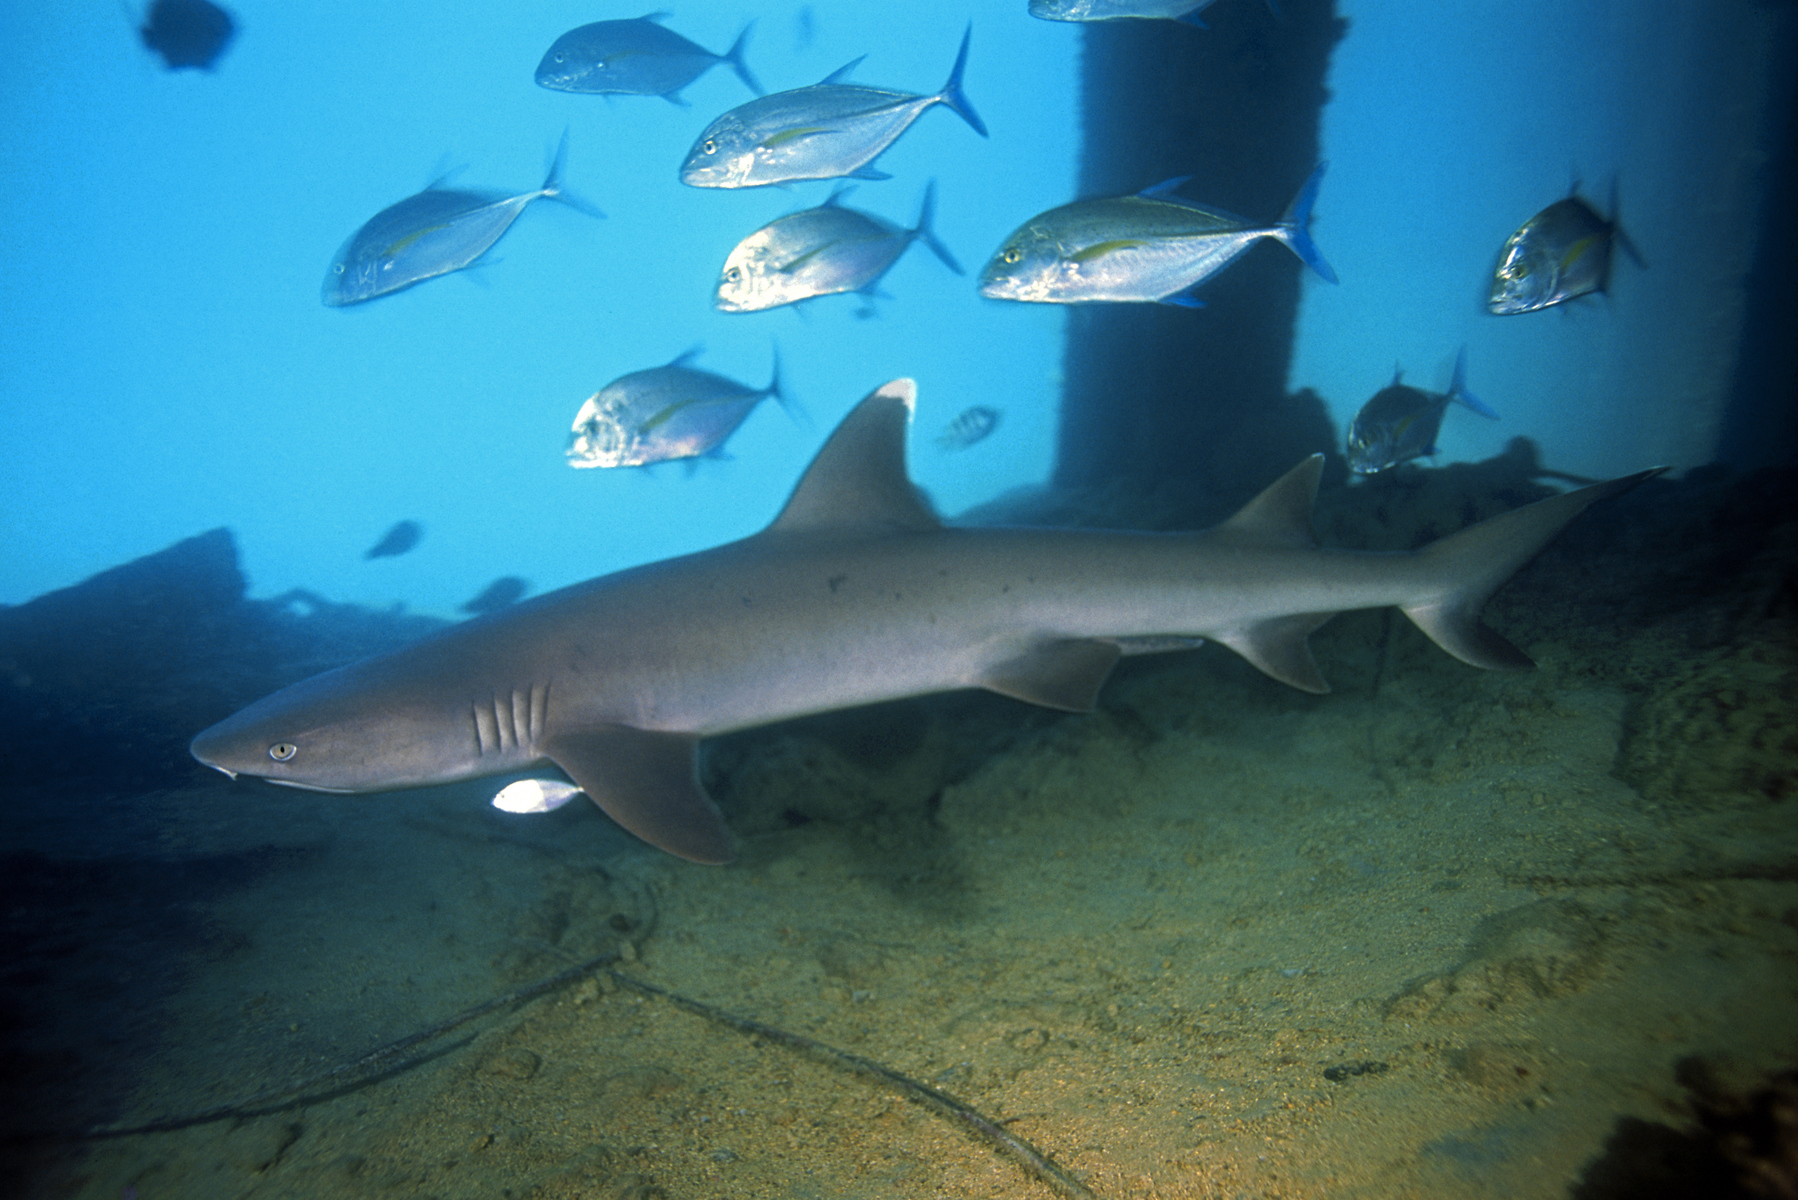
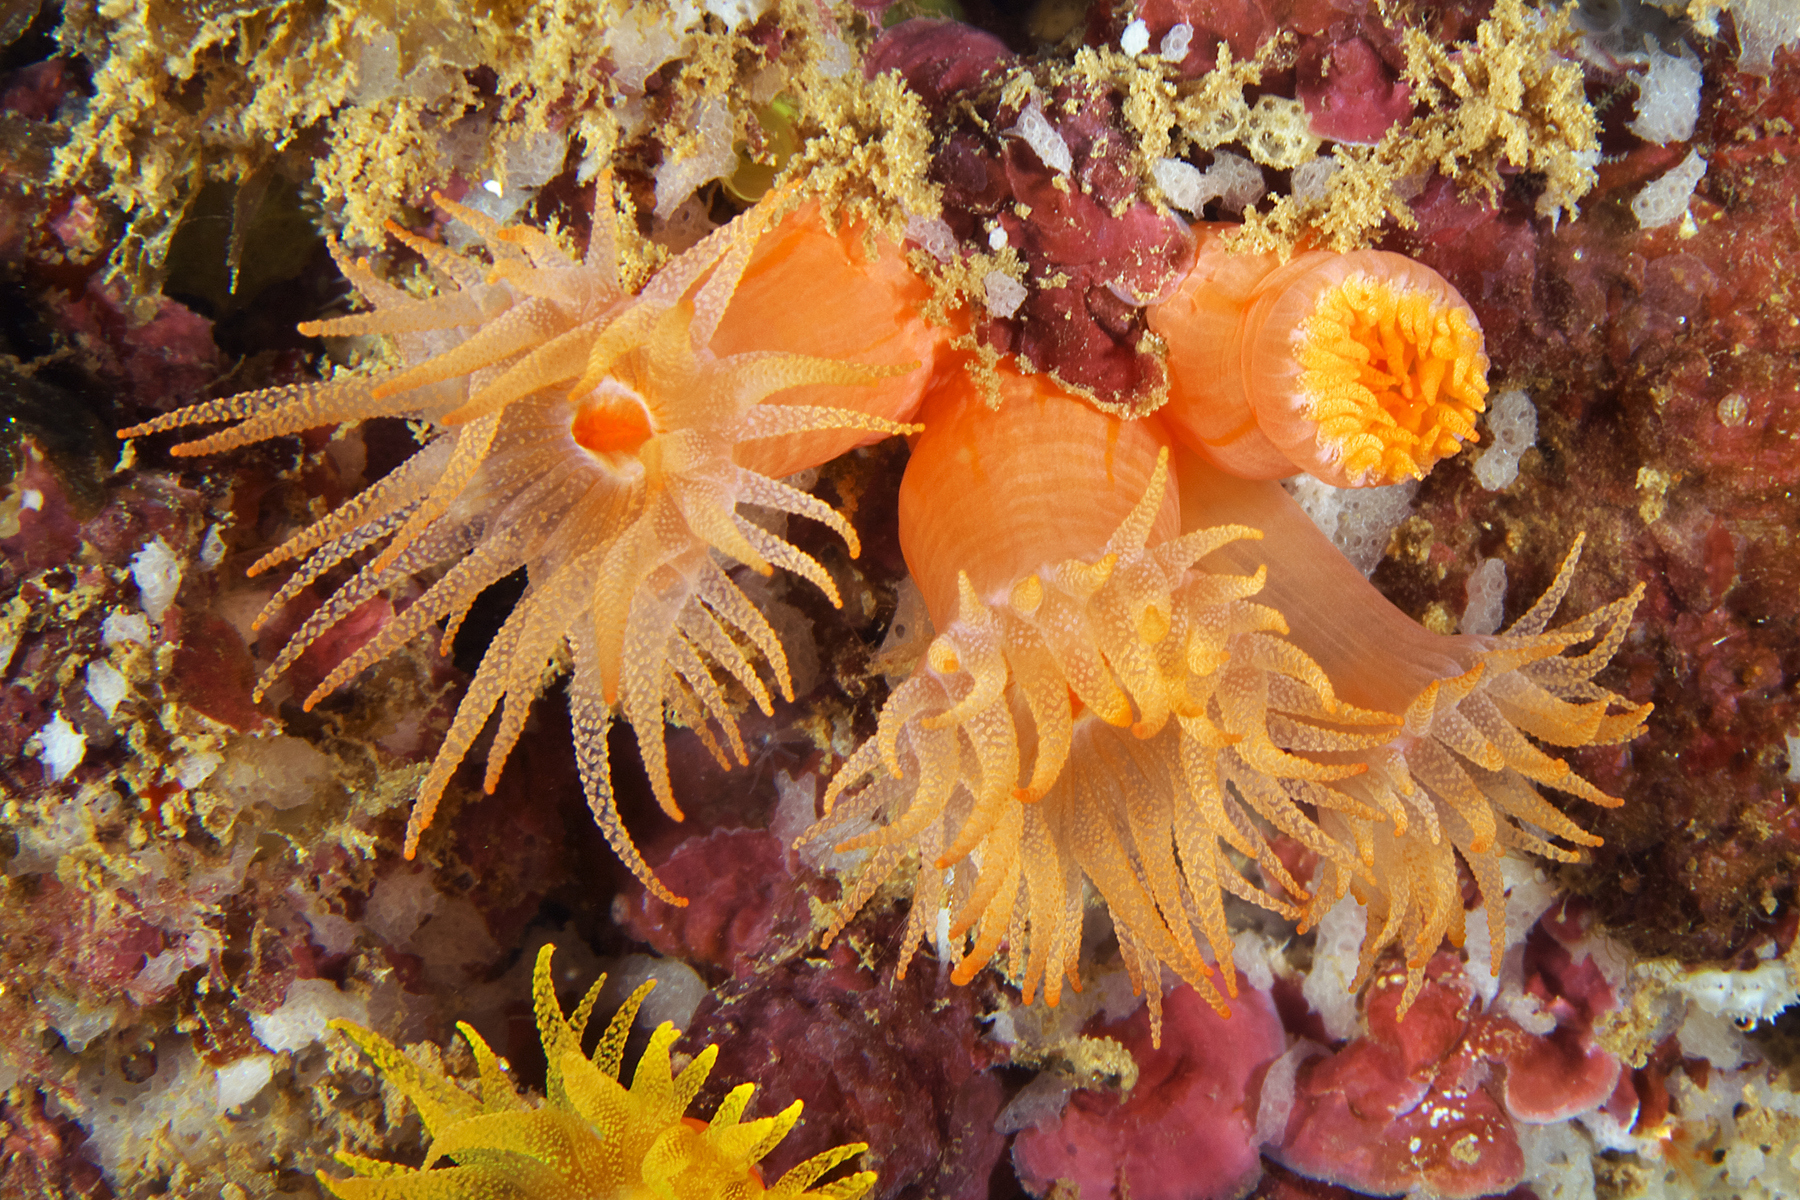
A large number of unique marine life species live in nearshore ocean waters that are downstream from all disposal methods. Explore these colorful reef species images, learn the scientific name and Hawaiian name for those that have one, and explore a link to more information for each species
-
How does Kulaimano's wastewater pollution compare?
DISPOSAL METHOD Effluent Total Nitrogen Concentration (mg/L) *Note: Values shown represent an upper-range (90th) percentile of all available measurements for each WWTP* HAR 11-54 open coastal water quality standard "do not exceed more than 2% of the time" (2014) Total Nitrogen Concentration (mg/L) How much higher is the Effluent Total Nitrogen Concentration compared to the open coastal standard? (X multiples) Effluent Total Phosphorus Concentration (mg/L) *Note: Values shown represent an upper-range (90th) percentile of all available measurements for each WWTP* HAR 11-54 open coastal water quality standard "do not exceed more than 2% of the time" (2014) Total Phosphorus Concentration (mg/L) How much higher is the Effluent Total Phosphorus Concentration compared to the open coastal standard? (X multiples) Effluent Enterococcus Concentration (CFU/100mL) *Note: Values shown represent an upper-range (90th) percentile of all available daily max measurements for each WWTP* HAR 11-54 recreational standards for all state waters "shall not exceed a geometric mean of 35 CFU / 100mL over any 30-day interval. How much higher is the Effluent Enterococcus Concentration compared to the recreational water standard? (X multiples) Kulaimano WWTP 8.27 0.35 23.63 6.28 0.06 104.67 40.8 35 1.17 Pāpaʻikou WWTP 31.02 0.35 88.63 2.93 0.06 48.83 37.6 35 1.07 Hilo WWTP 17.31 0.35 49.46 3.12 0.06 52 5990 35 171.14 Kapehu WWTP ND 0.35 ND ND 0.06 ND ND 35 ND Honokaʻa WWTP ND 0.35 ND ND 0.06 ND ND 35 ND Kaloko WWTP 19.35 0.35 55.29 2.18 0.06 36.33 200 35 5.71 Kealakehe WWTP ND 0.35 ND ND 0.06 ND ND 35 ND