-
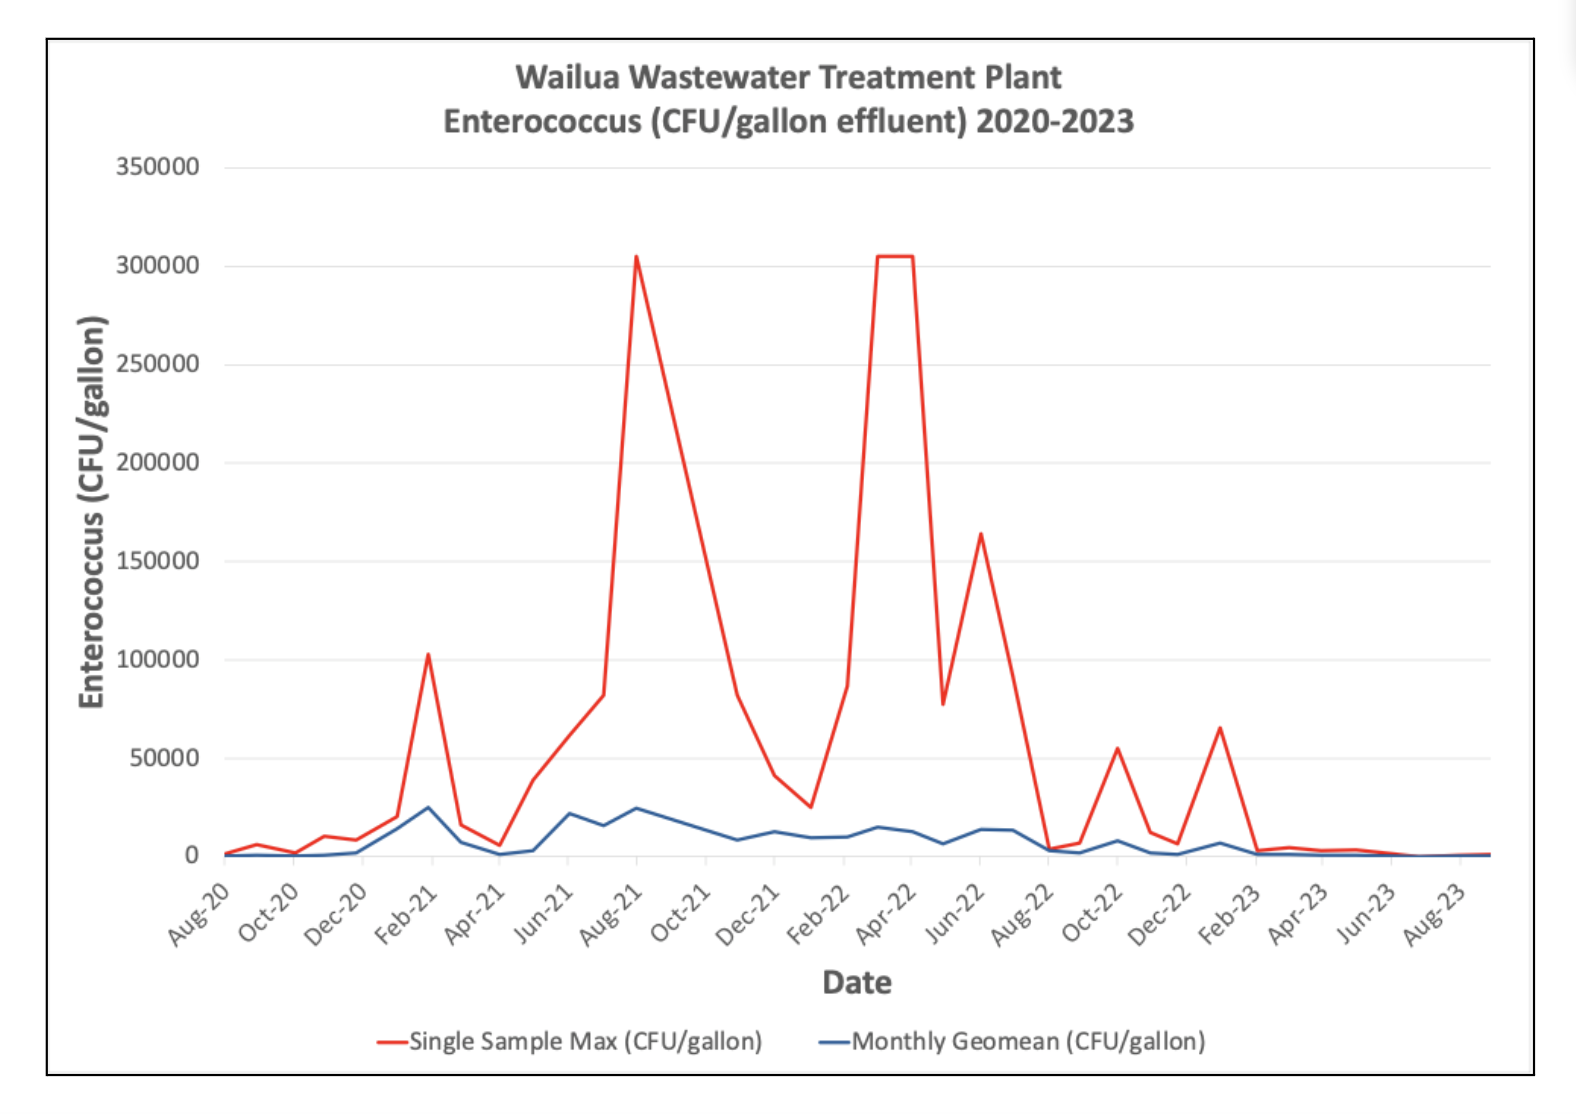
Concentrations of Enterococcus at Wailua/Kapaʻa Wastewater Treatment Plant shows a decreasing trend for Single Sample Max and a stable trend for Monthly Geomean from 2020-2023.
-
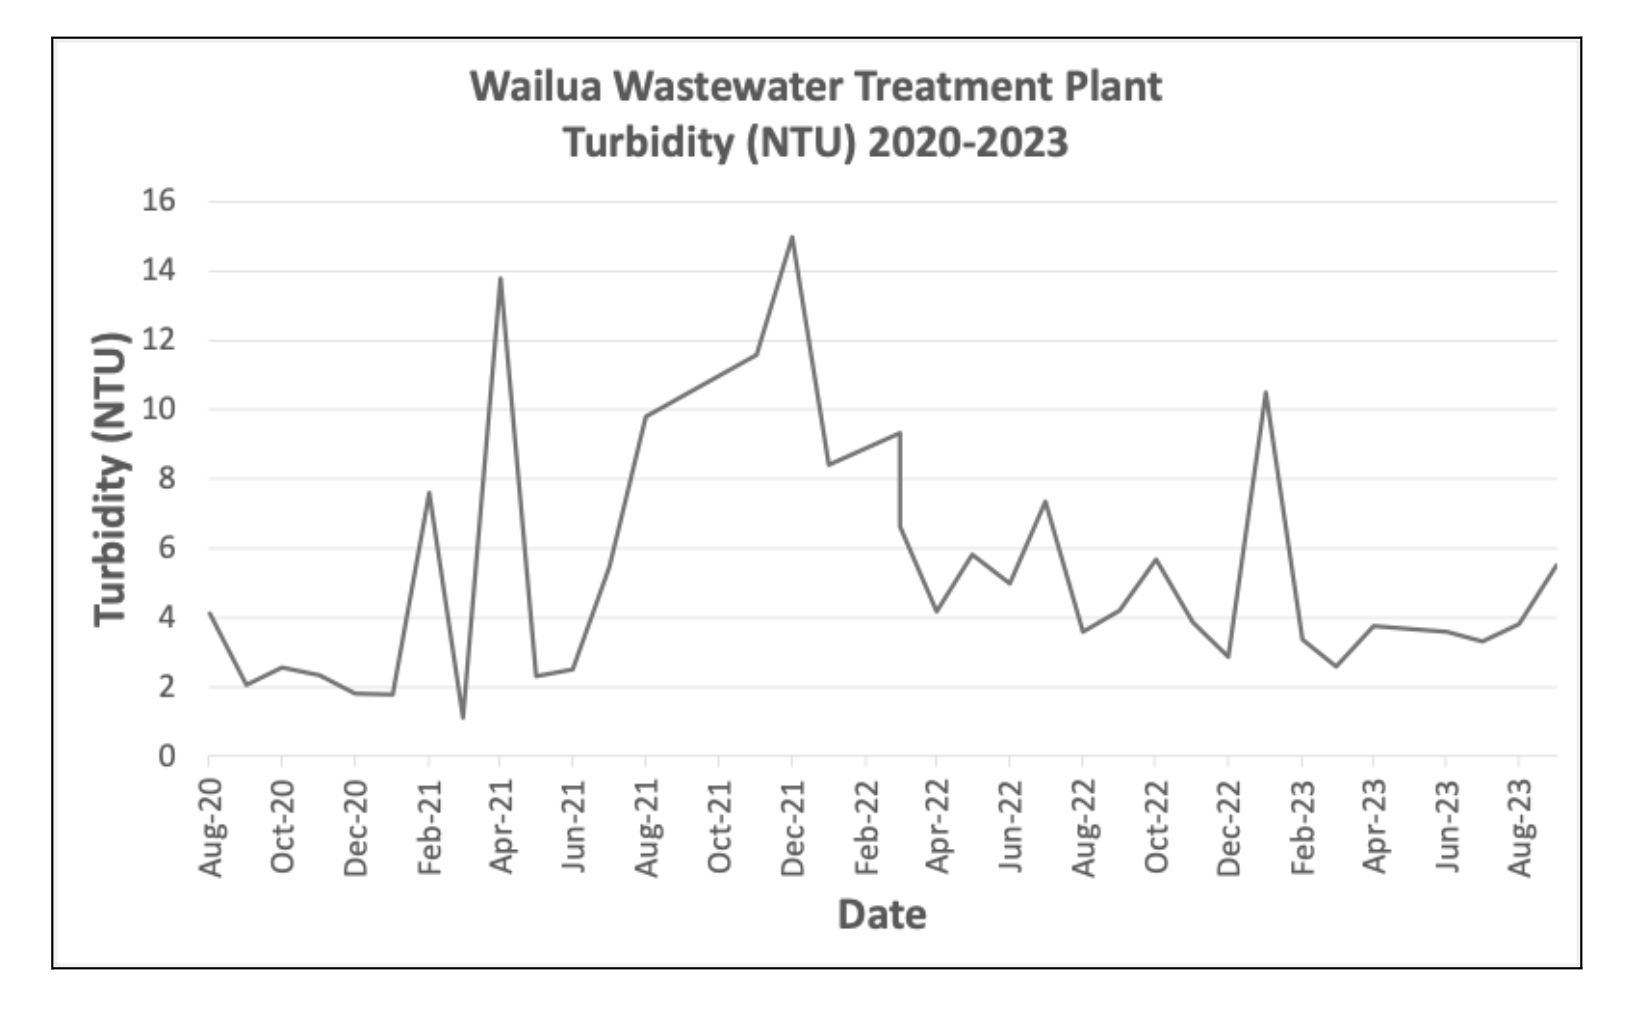
Turbidity at Wailua/Kapaʻa Wastewater Treatment Plant shows a stable trend from 2020-2023.
-
Wailua-Kapa‘a Wastewater Treatment Plant Water Quality History
Date Single Sample Max (CFU/100mL) Single Sample Max (CFU/gallon) Monthly Geomean (CFU/100mL) Monthly Geomean (CFU/gallon) Turbidity (NTU) 8/27/2020 37 1401 5 189 4.13 9/24/2020 158 5981 18 681 2.06 10/28/2020 53 2006 4 151 2.55 11/23/2020 278 10523 17 644 2.35 12/21/2020 221 8366 49 1855 1.8 1/26/2021 541 20479 372 14082 1.77 2/23/2021 2720 102963 657 24870 7.59 3/24/2021 427 16164 191 7230 1.12 4/27/2021 152 5754 29 1098 13.8 5/27/2021 1027 38876 78 2953 2.31 6/28/2021 1628 61626 576 21804 2.49 7/28/2021 2163 81878 415 15709 5.46 8/26/2021 8065 305293 654 24757 9.81 11/24/2021 2163 81878 227 8593 11.6 12/27/2021 1085 41072 335 12681 15 1/28/2022 663 25097 256 9691 8.42 3/1/2022 2289 86648 264 9993 9.32 3/28/2022 8065 305293 398 15066 6.62 4/28/2022 8065 305293 337 12757 4.18 5/25/2022 2044 77374 170 6435 5.83 6/28/2022 4332 163984 366 13855 4.99 7/26/2022 2423 91720 358 13552 7.35 8/27/2022 97 3672 81 3066 3.59 9/23/2022 182 6889 52 1968 4.21 10/27/2022 1451 54926 210 7949 5.69 11/25/2022 320 12113 53 2006 3.87 12/19/2022 168 6359 30 1136 2.86 1/26/2023 1724 65260 178 6738 10.5 2/28/2023 81 3066 31 1173 3.36 3/28/2023 120 4542 24 908 2.6 4/25/2023 84 3180 17 644 3.75 5/26/2023 92 3483 17 644 3.68 6/27/2023 40 1514 10 379 3.6 7/21/2023 3 114 3 114 3.31 8/25/2023 21 795 7 265 3.81 9/22/2023 28 1060 7 265 5.5