-
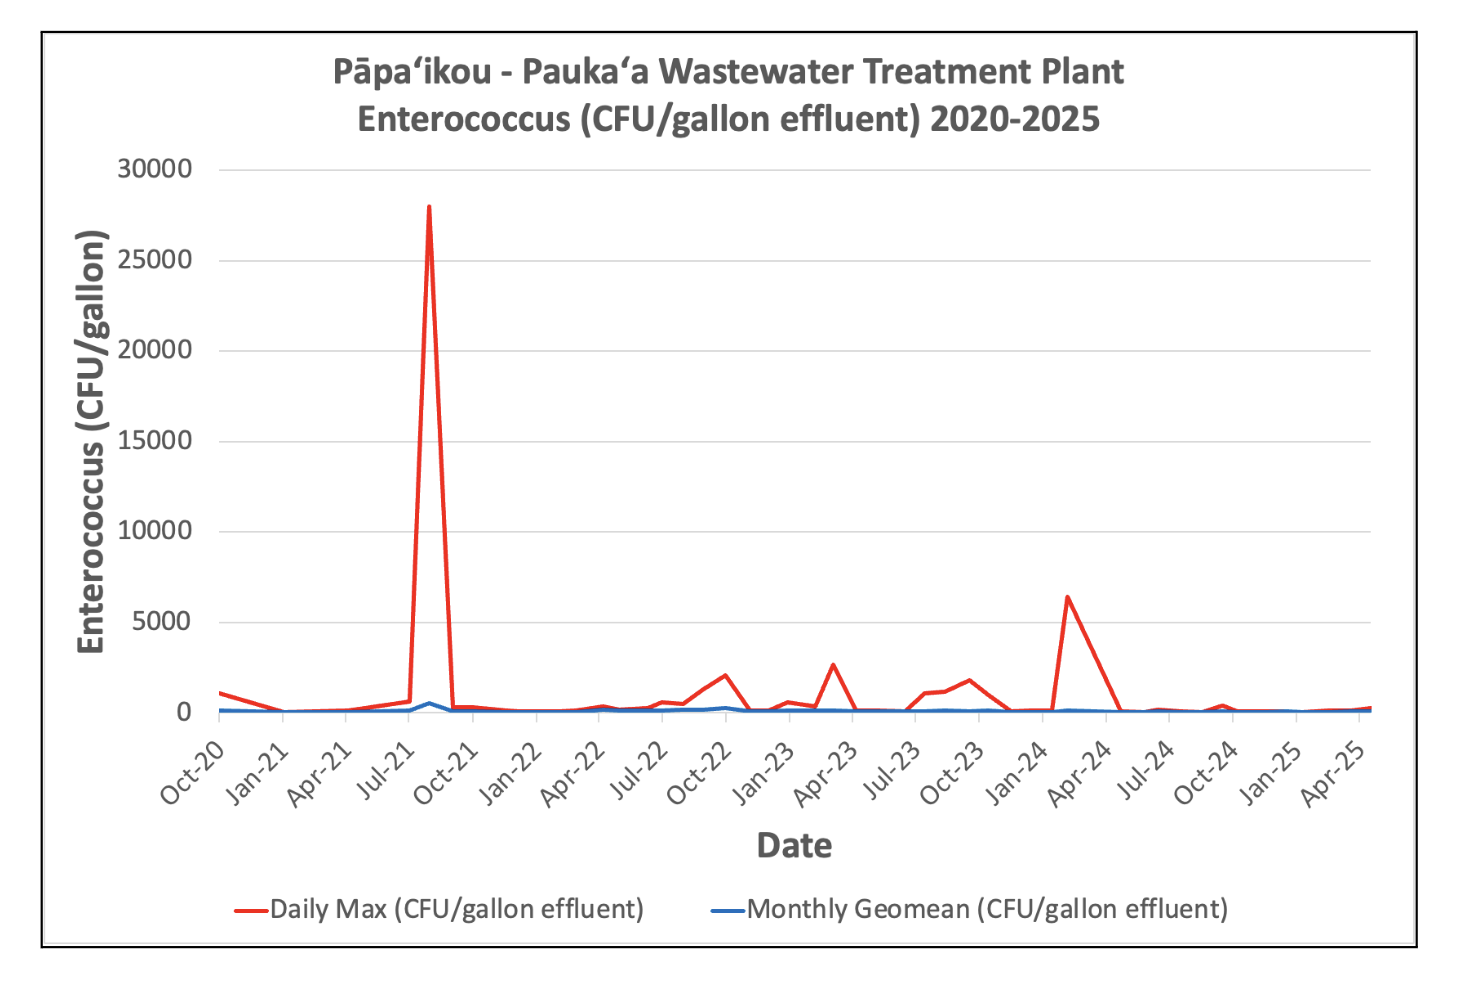
Concentrations of Enterococcus at Pāpaʻikou Wastewater Treatment Plant shows a decreasing trend for Daily Max and a stable trend for Monthly Geomean from 2020-2025.
-
Concentrations of TN at Pāpaʻikou Wastewater Treatment Plant shows a decreasing trend from 2020-2021, with the highest concentration in Jan 2021.

-
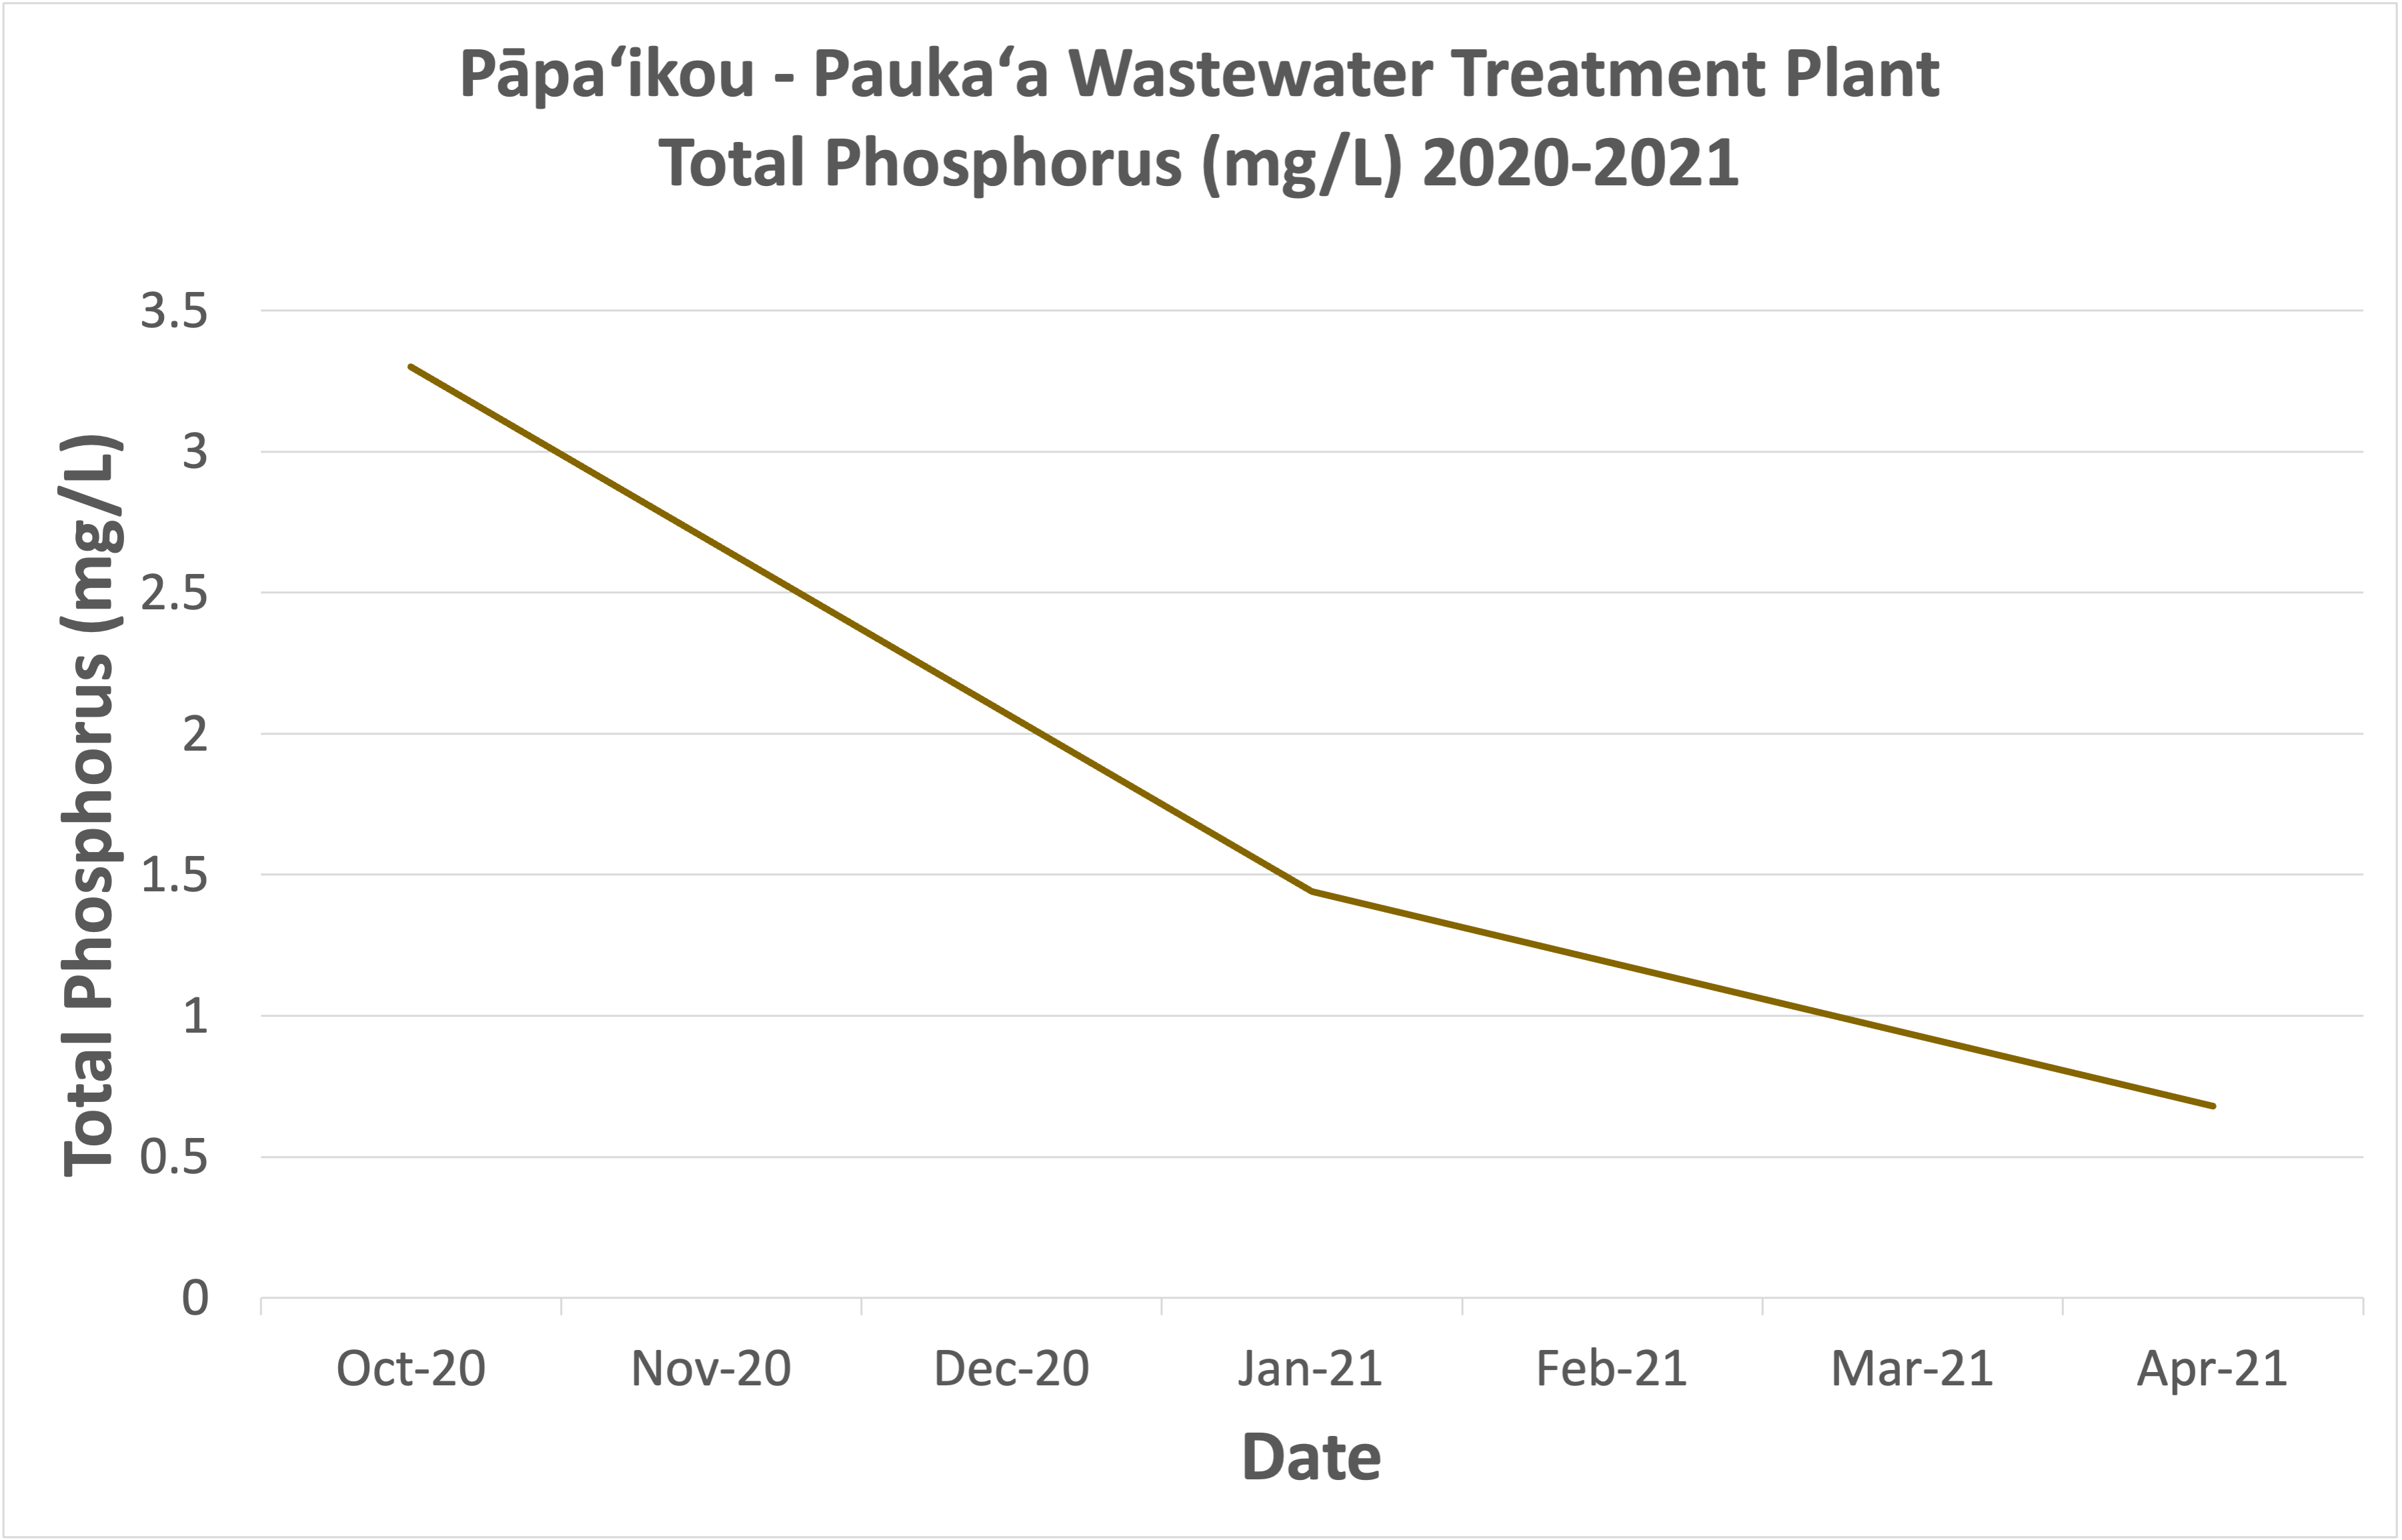
Concentrations of TP at Pāpaʻikou Wastewater Treatment Plant shows a decreasing trend from 2020-2021, reaching its lowest concentration in Apr 2021.
-
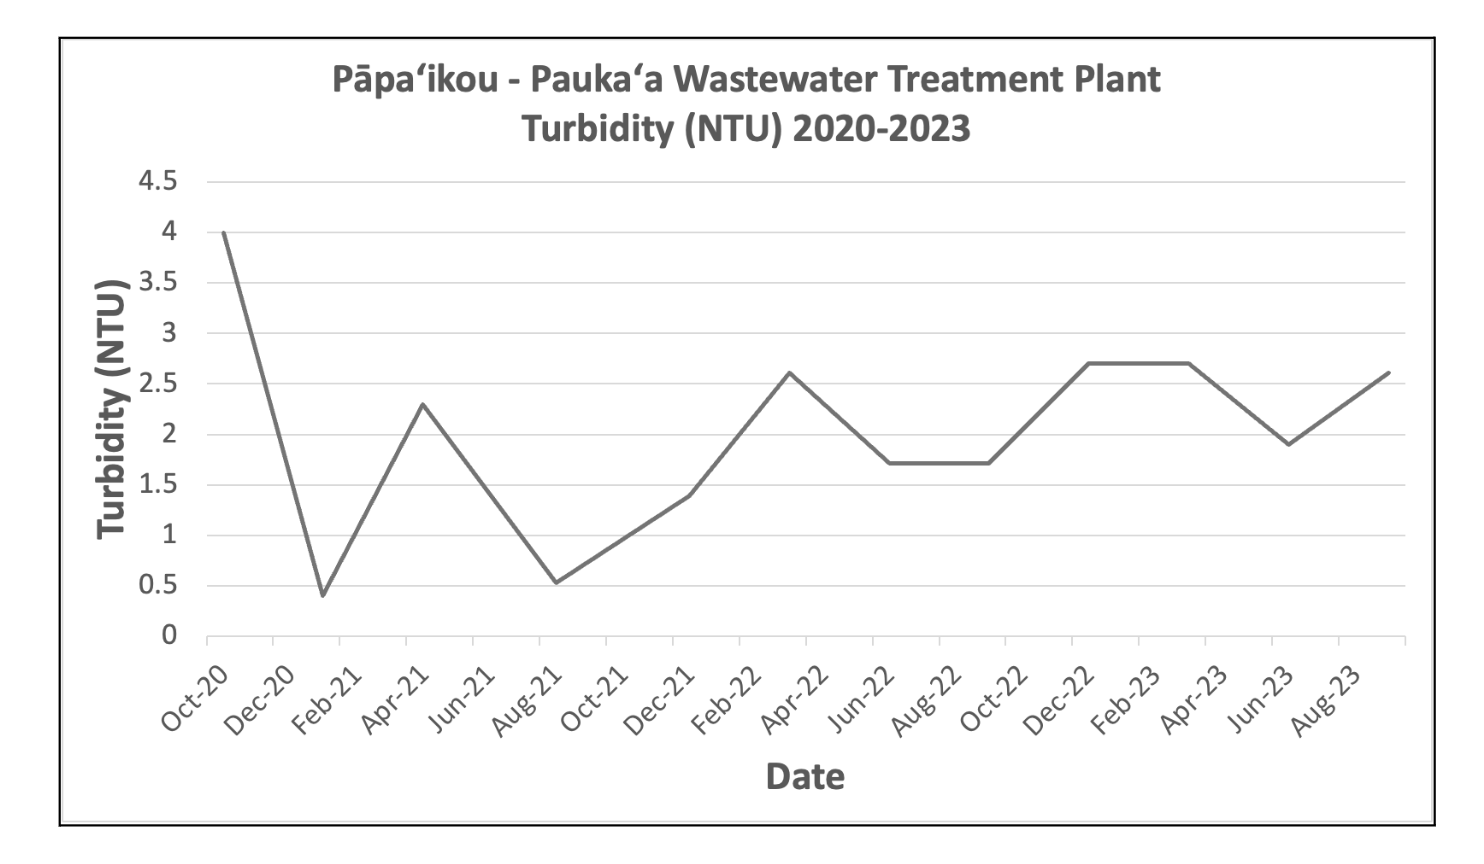
Turbidity at Pāpaʻikou Wastewater Treatment Plant shows a very slight increasing trend from 2020-2023.
-
Pāpa‘ikou-Pauka‘a Wastewater Treatment Plant Water Quality History
Date Daily Max (CFU/gallon effluent) Monthly Geomean (CFU/gallon effluent) TP (ug/L) TP (mg/L) TP (lbs/day) TN (ug/L) TN (mg/L) TN (lbs/day) Turbidity (NTU) 10/12/2020 1060 114 3300 3.3 1.9 17030 17.03 9.7 4 01/13/2021 38 38 1440 1.44 0.7 34520 34.52 16.1 0.4 04/16/2021 114 38 680 0.68 0.5 11351 11.351 8.6 2.3 07/13/2021 644 114 0.53 08/10/2021 28012 530 1.39 09/13/2021 303 76 2.61 10/11/2021 303 76 1.71 11/29/2021 114 38 1.71 12/16/2021 76 38 2.7 01/25/2022 76 38 2.7 02/14/2022 76 38 1.9 03/10/2022 114 38 2.61 04/18/2022 379 189 05/11/2022 189 114 06/21/2022 265 114 07/11/2022 606 114 08/11/2022 492 189 09/09/2022 1325 189 10/11/2022 2082 265 11/15/2022 114 76 12/13/2022 114 76 01/09/2023 568 114 02/17/2023 379 114 03/15/2023 2688 151 04/17/2023 151 76 05/17/2023 114 76 06/27/2023 76 76 07/25/2023 1060 76 08/24/2023 1173 151 09/28/2023 1817 76 10/25/2023 984 114 11/27/2023 76 38 12/26/2023 114 38 01/25/2024 151 38 02/16/2024 6435 114 05/03/2024 151 38 05/03/2024 76 38 06/05/2024 38 38 06/26/2024 189 76 07/27/2024 76 38 08/28/2024 38 38 09/27/2024 416 76 10/18/2024 76 38 11/28/2024 76 38 12/28/2024 76 76 01/20/2025 38 38 02/28/2025 151 38 03/31/2025 151 76 04/28/2025 265 76