-
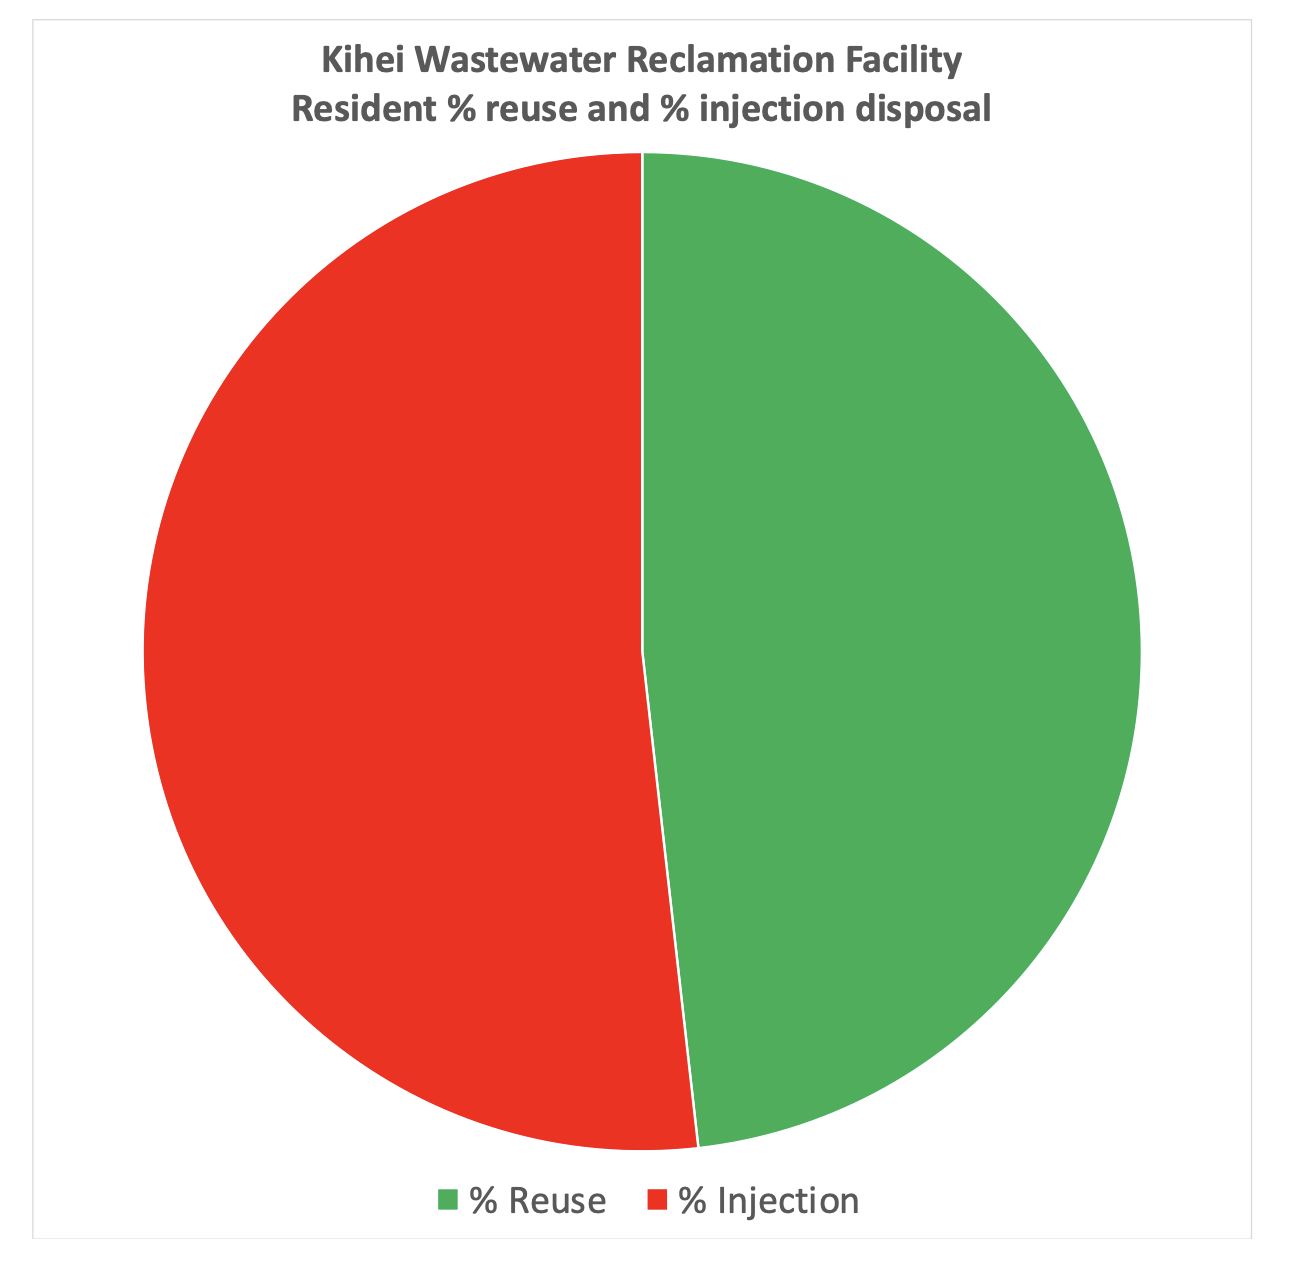
More than than half of resident wastewater ends up in nearshore injection wells.
On average, just over half of recent wastewater effluent from the Kihei WWRF is discharged into nearshore injection wells, while just under half is used for irrigation reuse. Detailed County of Maui plant flow reports.
-
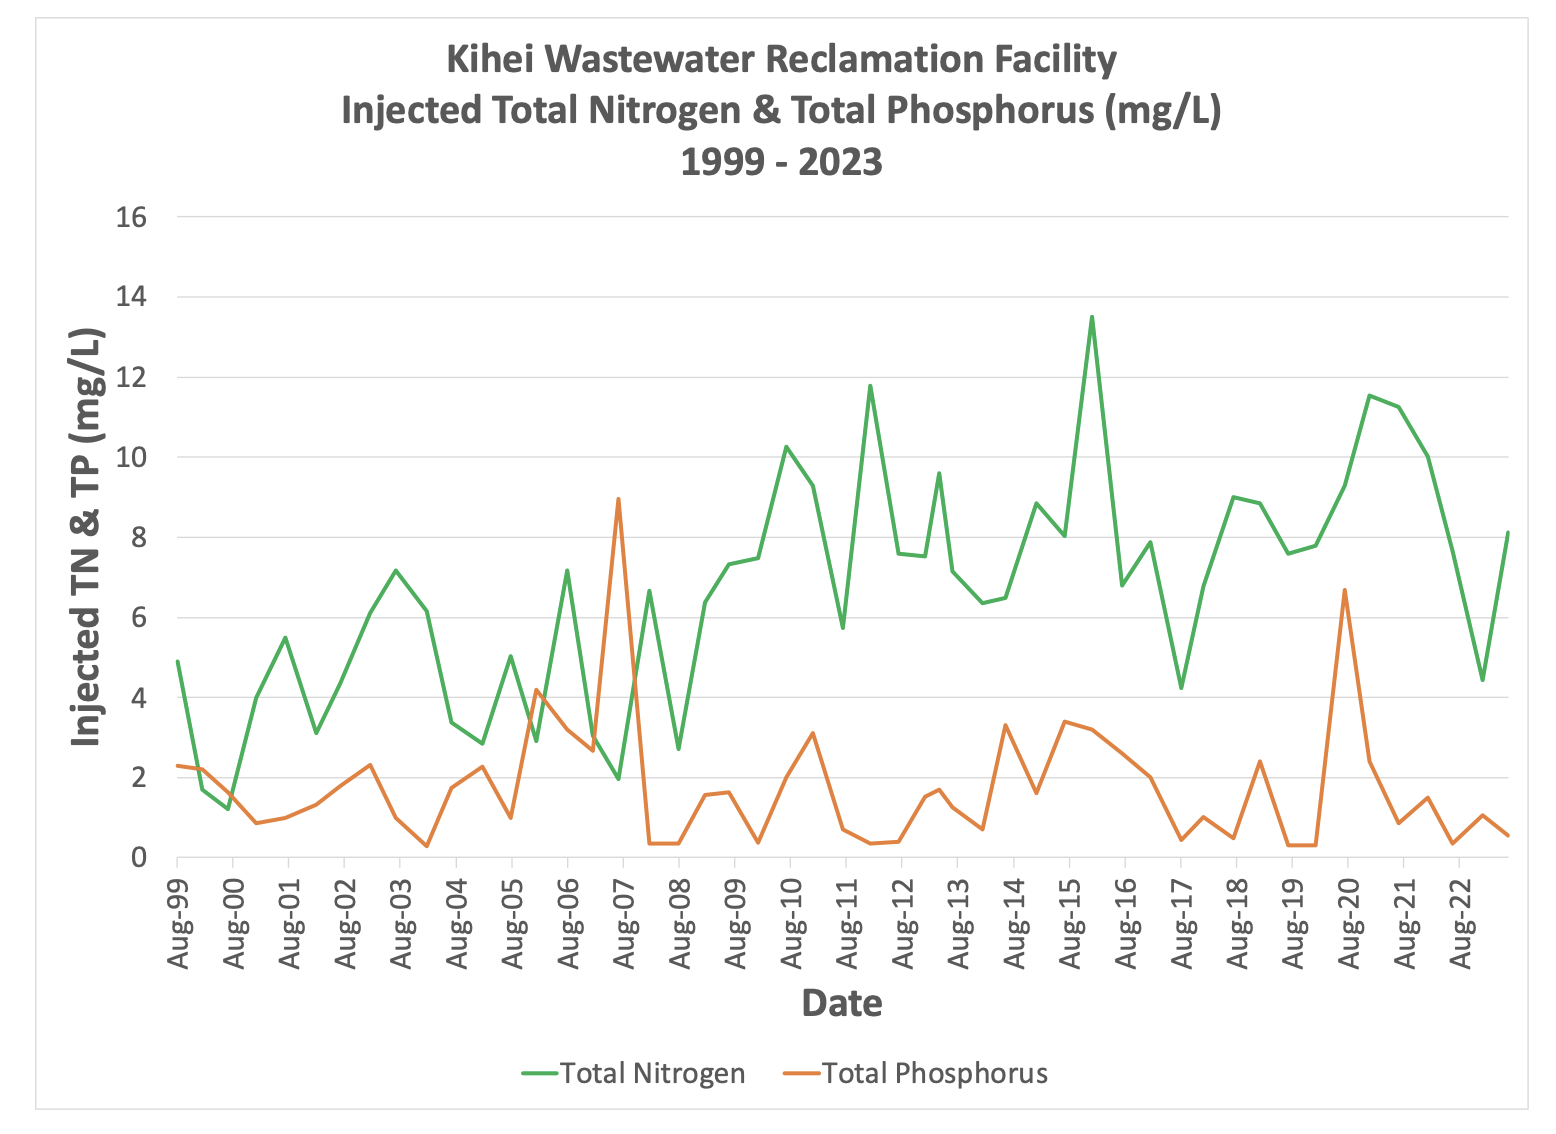
Kihei WWRF injected Total Nitrogen & Total Phosphorus 1999 - 2023
Injected nutrient concentrations in Kihei from 1999-2023 showed an increasing trend in Total Nitrogen. Total Phosphorus trends are steady over the years. Detailed County of Maui plant flow reports.
-
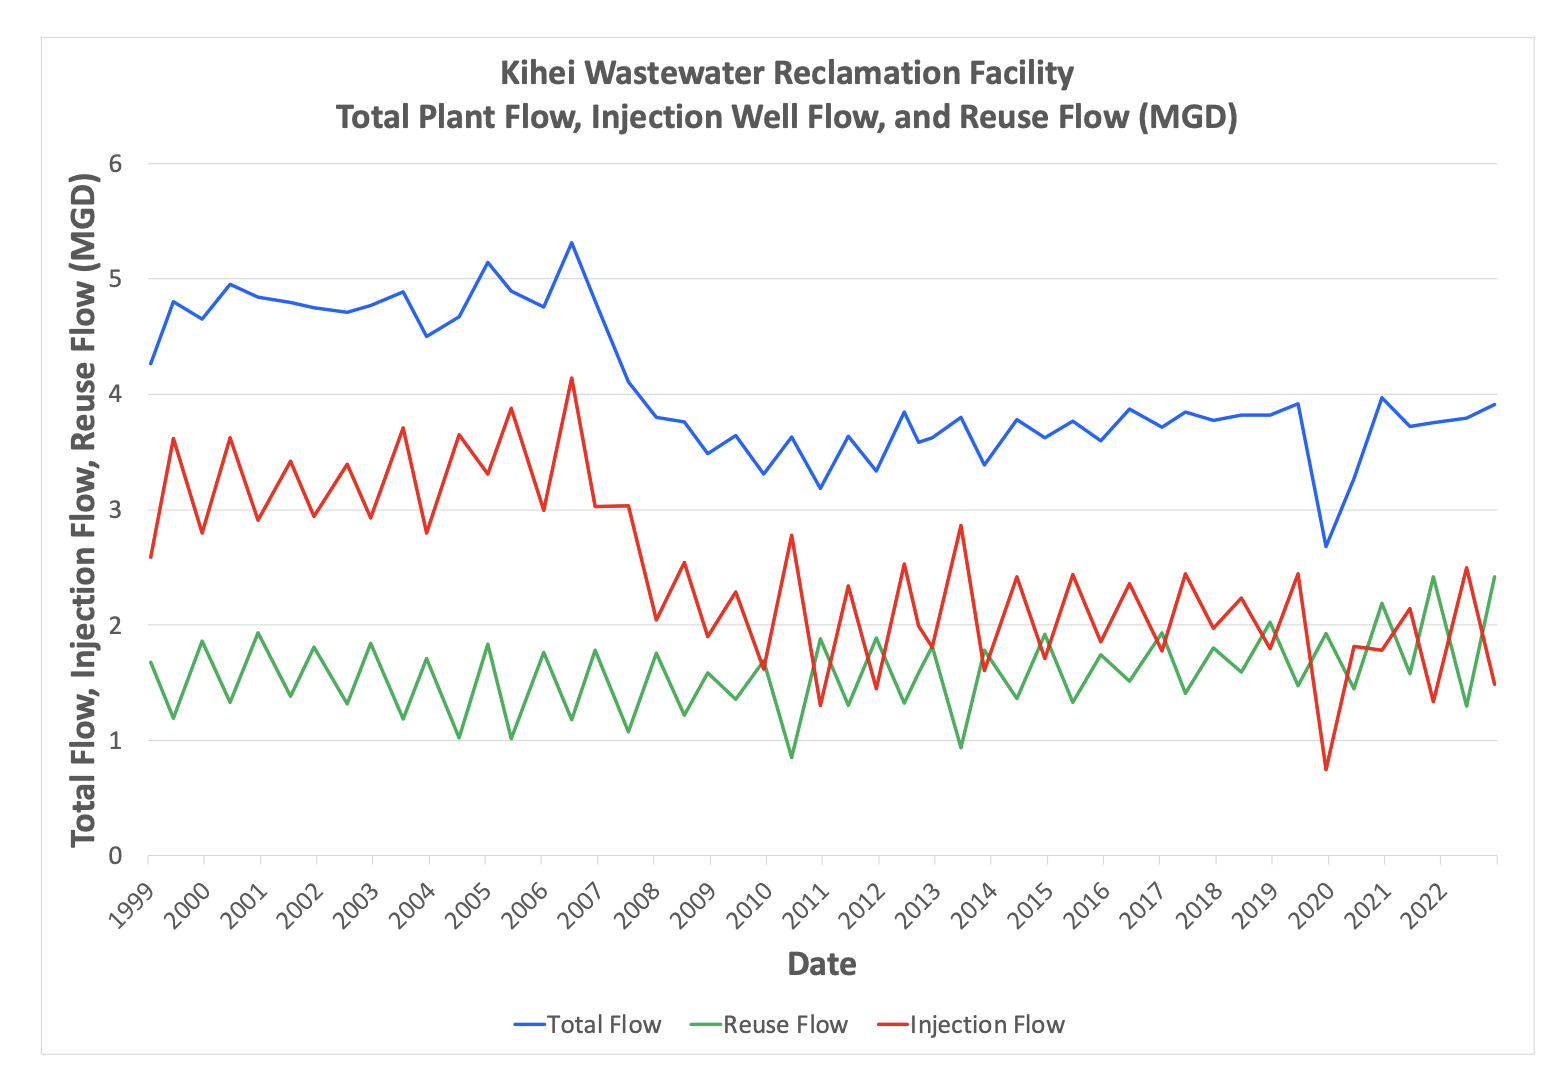
Kihei WWRF total Plant Flow, Injection Well Flow and Reuse Flow
Flow data in Kihei from 1999 - 2023 shows total plant flow and injection flowrates with recent data of reuse 48.2% and injection 51.8%. Detailed County of Maui plant flow reports.
-
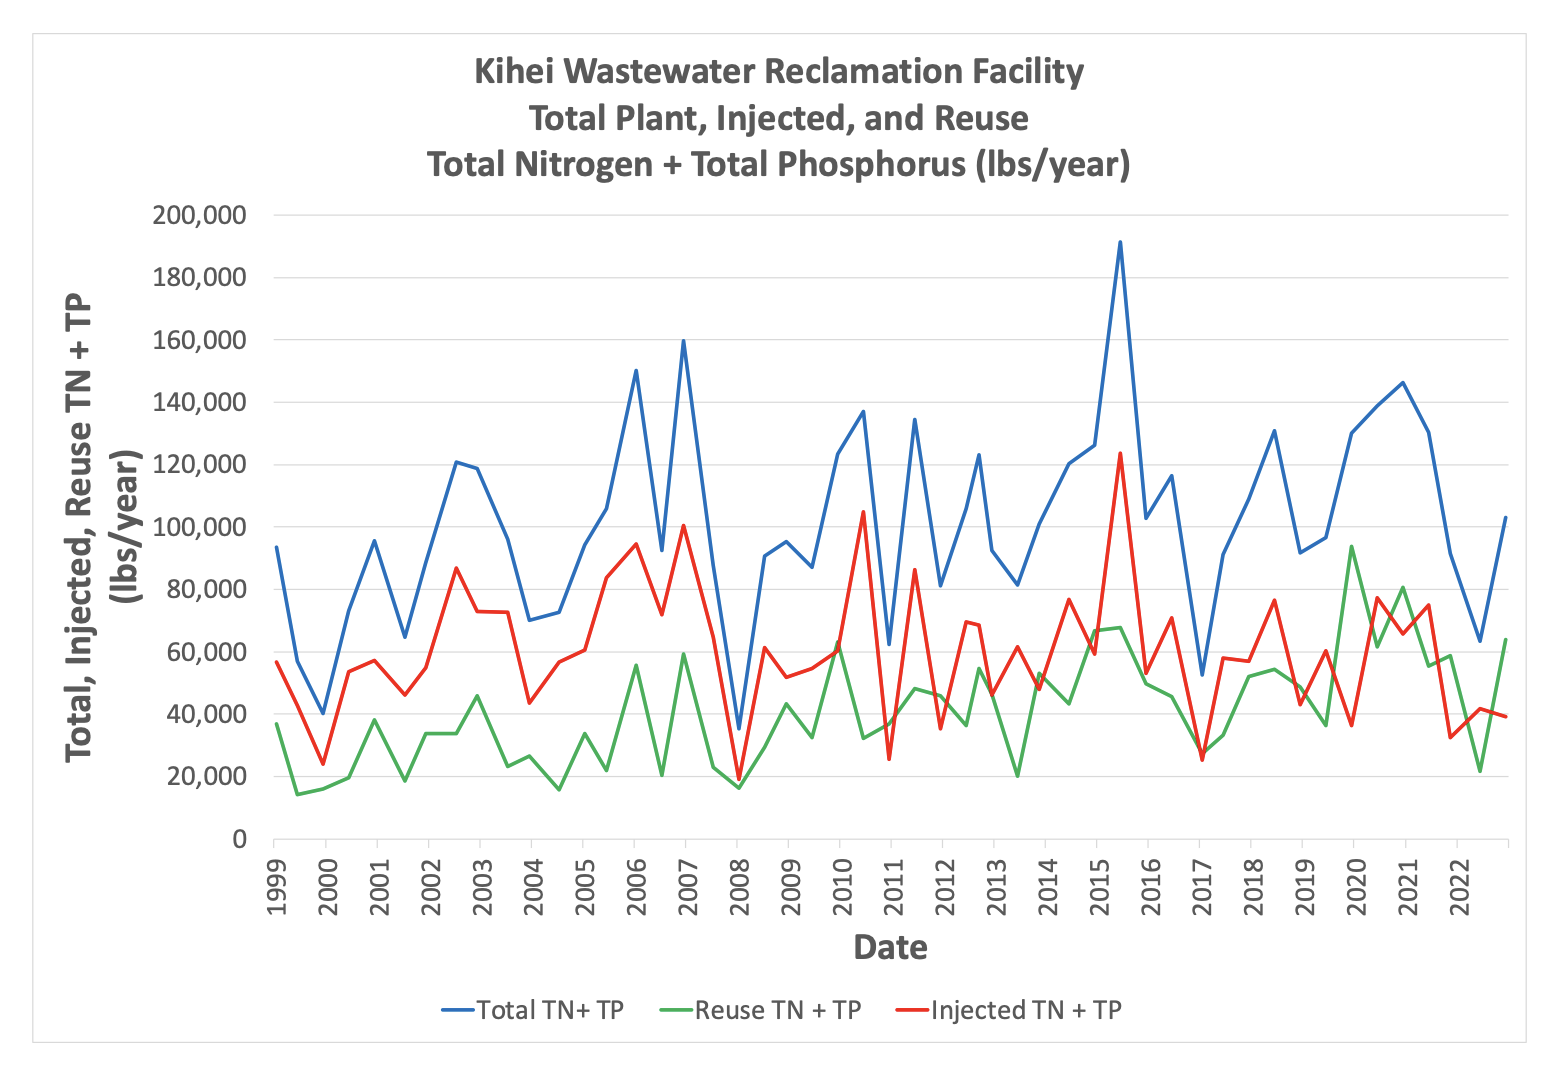
Kihei WWRF Total Plant, Injected and Reuse Nutrient Total Nitrogen + Total Phosphorus mass loading (lbs/year)
1999 - 2023 estimated nutrients discharged from the Kihei WWRF in pounds per year. Detailed County of Maui plant flow reports.
-
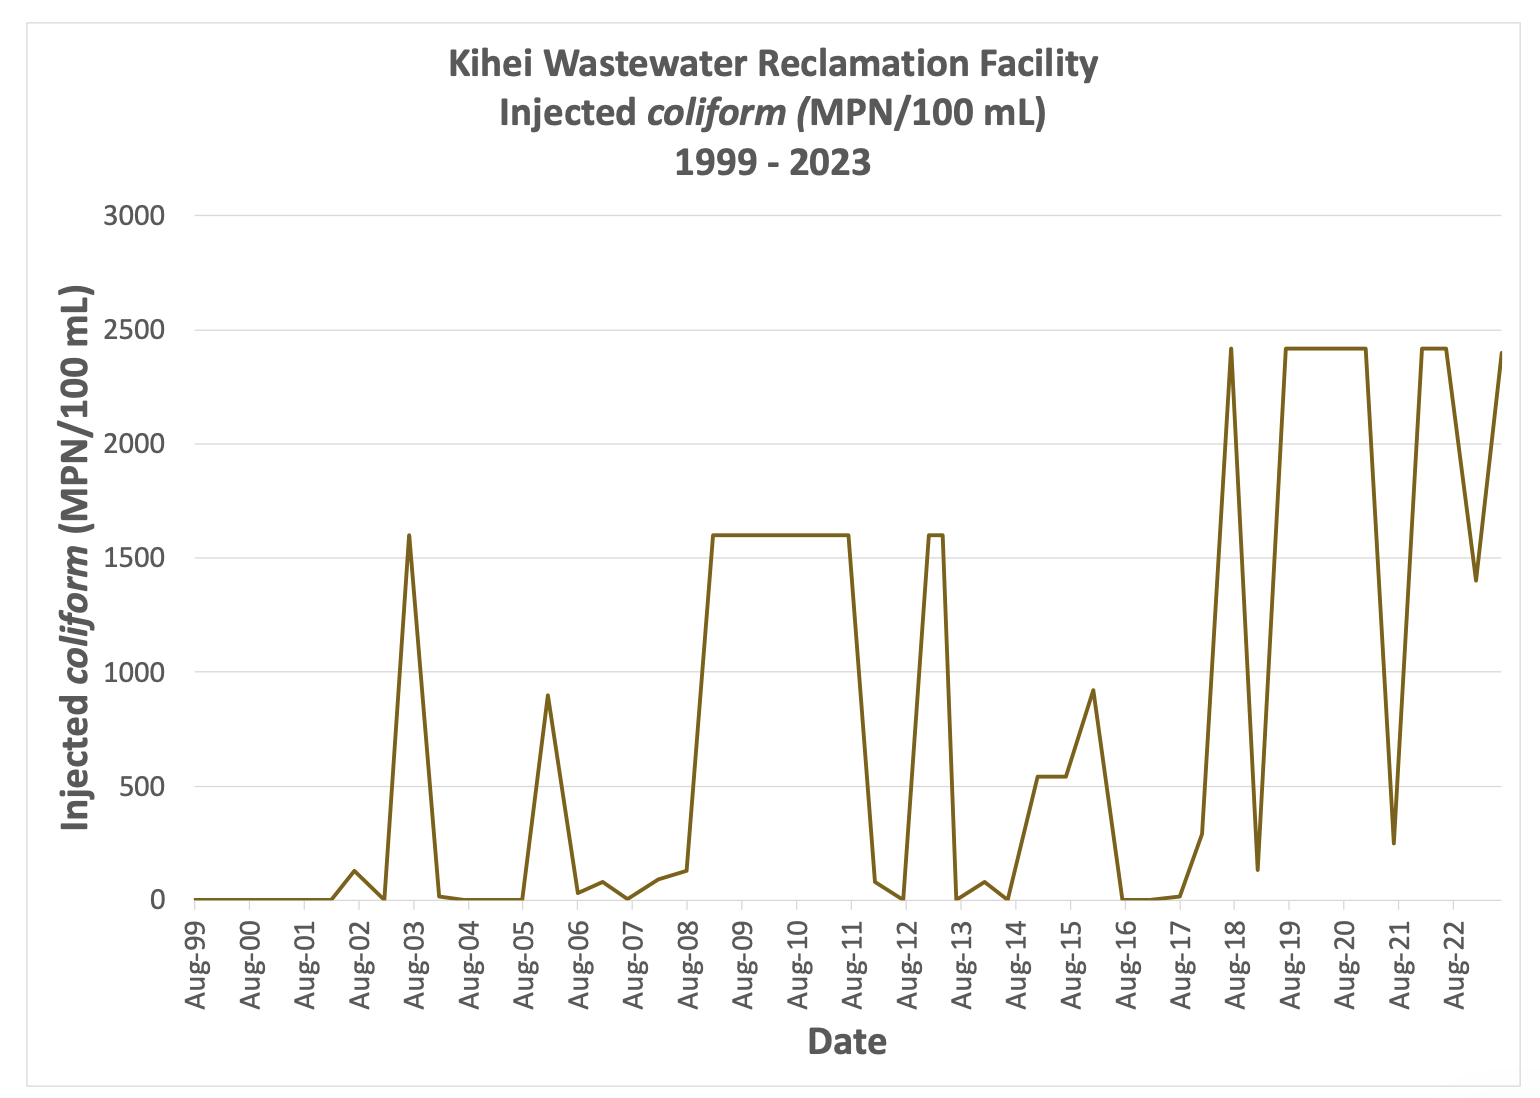
Kihei WWRF injected coliform (MPN/100mL) 1999 - 2023
An analysis of fecal coliform cell counts from 1999-2023 shows that injected municipal wastewater has never been consistently disinfected in Kihei, and fecal coliform counts have been steadily increasing over the decades, which recently have been measured as above the detection limit for the test of 2419.6 Most Probable Number of colony-forming (or infection forming) units of bacteria per 100mL of wastewater. Detailed County of Maui plant flow reports.
-
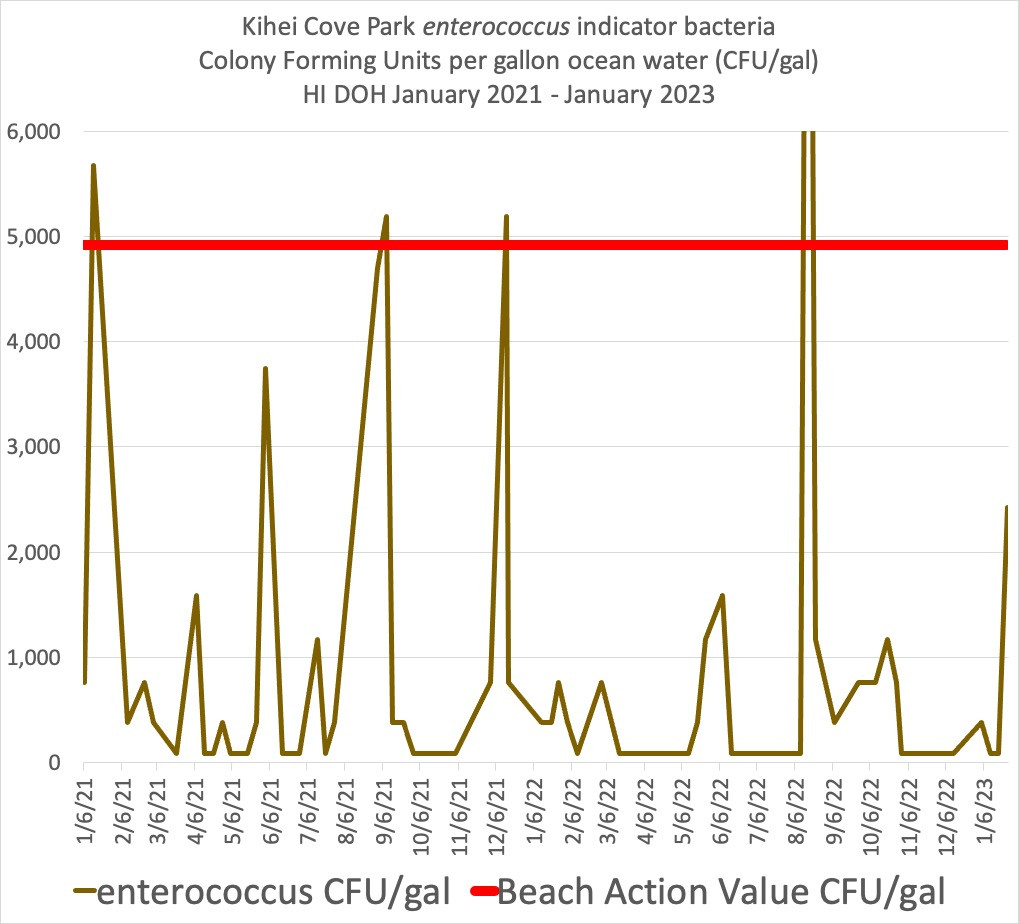
Hawaii Department of Health measurements at Cove Park of fecal indicator bacteria enterococcus (Most Probable Number of Colony Forming Units per gallon ocean water) 2021 - 2023
An analysis of indicator bacteria enterococcus Most Probable Number of Colony Forming Units per gallon from sea water samples taken from nearshore recreation areas at Cove Park in Kihei shows 4 out of 72 samples or 5.6% of readings exceed the Beach Action Value with the highest of 13,779 colony forming units of indicator bacteria per gallon of seawater measured on 8/17/22 (this is off the charts as shown). That’s greater than 1 out of 20 chance that the water is deemed unsafe by the Clean Water Branch on any given day at Cove Park. Also, 22 out of 72 or 30.6% of measurements had greater than 700 Colony Forming Units of indicator bacteria per gallon sea water, almost one out of 3 days sampled.
-
Kihei Municipal Wastewater Reclamation Facility Water Quality History
County of Maui municipal treatment plant flow data and Underground Injection Control effluent water quality data summary.
Total Flow Reuse Flow Injection Flow Total Nitrogen Total Phosphorus coliform Date MGD MGD MGD mg/L mg/L MPN/100mL 8/17/99 4.265 1.678 2.587 4.9 2.3 < 2 1/31/00 4.806 1.191 3.615 1.7 2.2 < 2 7/17/00 4.654 1.859 2.795 1.201 1.63 < 2 1/17/01 4.953 1.329 3.624 4 0.85 2 7/25/01 4.843 1.935 2.908 5.486 0.993 < 2 2/14/02 4.797 1.379 3.418 3.11 1.32 < 2 7/19/02 4.751 1.807 2.944 4.35 1.78 130 2/4/03 4.711 1.319 3.392 6.11 2.31 < 2 7/21/03 4.768 1.842 2.926 7.18 1 1600 2/6/04 4.891 1.183 3.708 6.16 0.29 17 7/19/04 4.504 1.707 2.797 3.38 1.73 < 2 2/7/05 4.671 1.02 3.651 2.84 2.27 < 2 8/9/05 5.144 1.837 3.307 5.03 1 < 2 1/27/06 4.894 1.017 3.877 2.91 4.19 900 8/16/06 4.758 1.761 2.997 7.17 3.2 30 2/1/07 5.316 1.176 4.14 3.05 2.66 80 7/16/07 4.807 1.783 3.024 1.96 8.95 4 2/7/08 4.111 1.076 3.035 6.66 0.35 90 8/14/08 3.799 1.755 2.044 2.72 0.34 130 2/4/09 3.758 1.215 2.543 6.37 1.57 > 1600 7/10/09 3.487 1.588 1.899 7.33 1.64 > 1600 01/15/10 3.644 1.358 2.286 7.48 0.38 > 1600 07/19/10 3.306 1.691 1.615 10.27 2 > 1600 01/11/11 3.628 0.851 2.777 9.3 3.1 > 1600 07/25/11 3.183 1.88 1.303 5.74 0.7 > 1600 01/23/12 3.638 1.302 2.336 11.79 0.36 79 07/27/12 3.335 1.887 1.448 7.6 0.39 2 01/17/13 3.849 1.322 2.527 7.52 1.51 > 1600 04/17/13 3.581 1.588 1.993 9.6 1.7 > 1600 07/15/13 3.624 1.816 1.808 7.14 1.25 < 1.8 01/24/14 3.799 0.934 2.865 6.35 0.7 79 06/27/14 3.389 1.782 1.607 6.49 3.3 < 1.8 01/12/15 3.781 1.365 2.416 8.85 1.6 540 07/17/15 3.625 1.918 1.707 8.03 3.4 540 01/15/16 3.766 1.332 2.434 13.5 3.2 920 07/27/16 3.6 1.745 1.855 6.79 2.6 < 1 01/27/17 3.873 1.516 2.357 7.88 2 < 1 08/17/17 3.712 1.934 1.778 4.23 0.43 16 01/11/18 3.849 1.407 2.442 6.78 1.01 290.9 07/25/18 3.776 1.801 1.975 9 0.48 > 2419.6 01/19/19 3.823 1.589 2.234 8.84 2.4 133.4 07/24/19 3.821 2.025 1.796 7.58 0.306 > 2419.6 01/17/20 3.919 1.473 2.446 7.794 0.302 > 2419.6 07/28/20 2.678 1.929 0.749 9.288 6.68 > 2419.6 01/05/21 3.267 1.45 1.817 11.55 2.41 > 2419.6 07/14/21 3.968 2.186 1.782 11.25 0.864 248.9 01/19/22 3.721 1.579 2.142 10.01 1.5 > 2419.6 06/29/22 3.755 2.416 1.339 7.65 0.351 > 2419.6 01/13/23 3.793 1.294 2.499 4.437 1.05 1400 07/03/23 3.909 2.419 1.49 8.11 0.56 > 2400 This data summary table shows nutrient concentrations, fecal coliform indicator bacteria colony forming unit estimates counts, and flow rates for the total plant, reuse and injection from the Kihei Wastewater Reclamation Facility, during the biannual months when the Underground Injection Control Program with the Safe Drinking Water Branch requires testing.