-
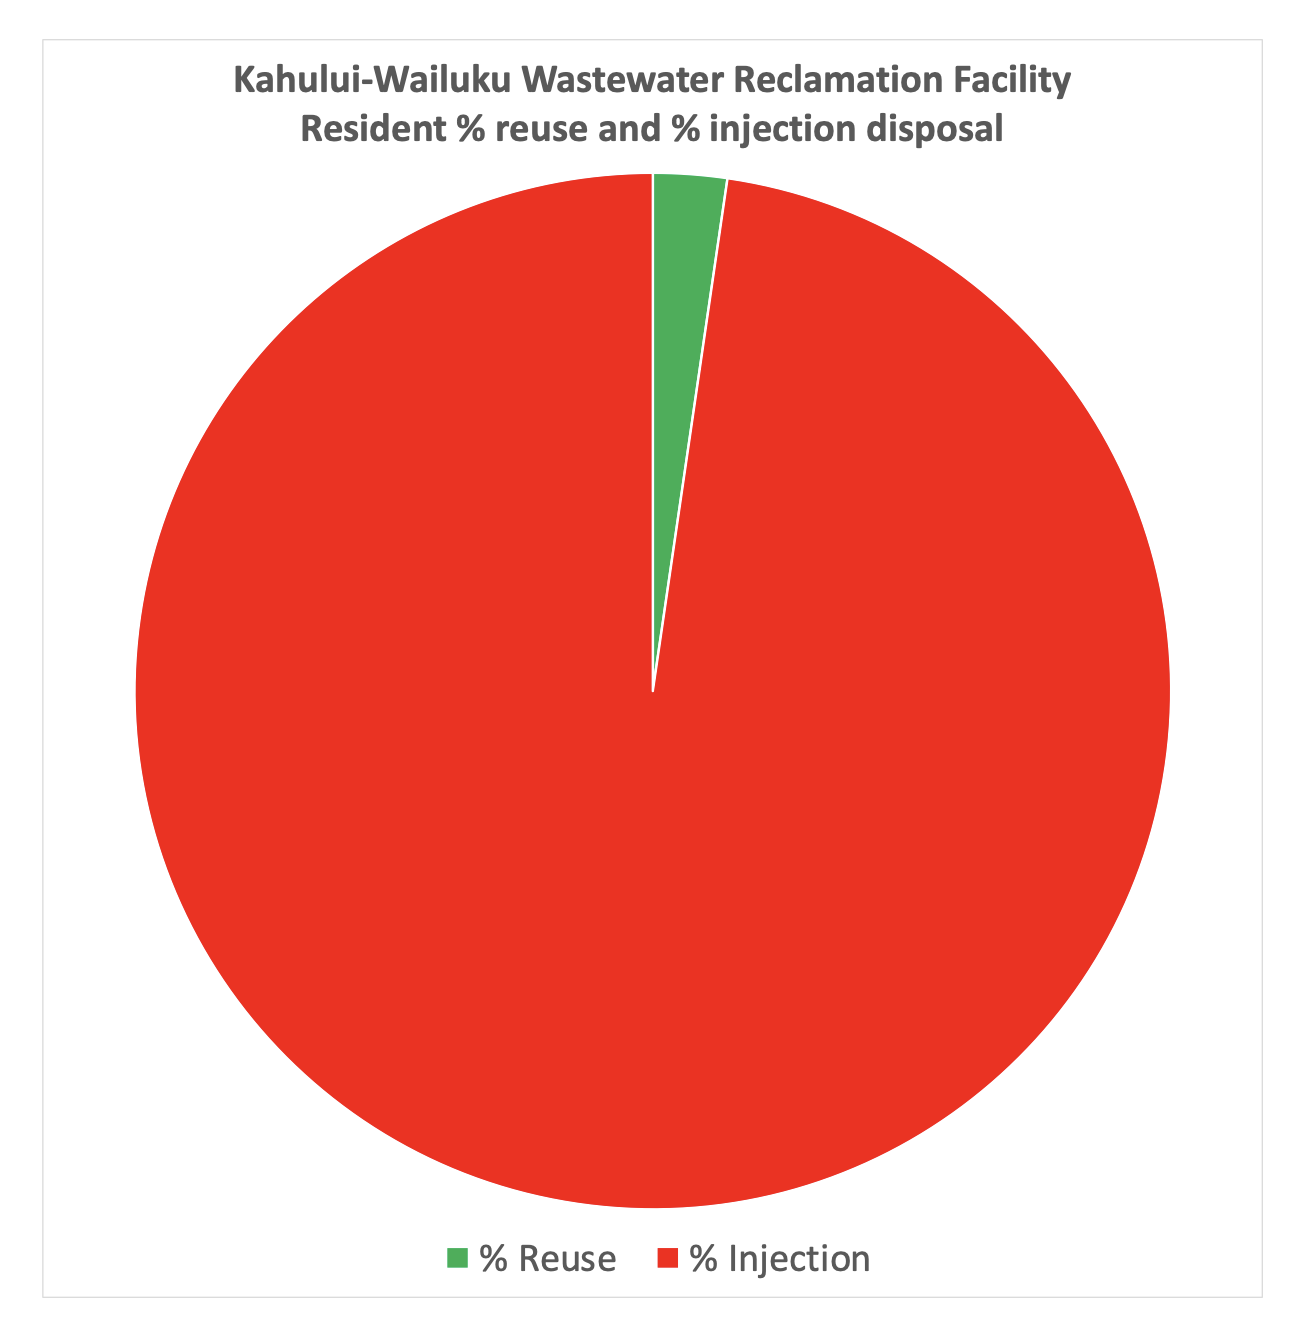
An estimated 97% of resident wastewater is discharged to nearshore injection wells.
On average, over 97% of resident wastewater is discharged into nearshore injection wells at the Kahului Wastewater Reclamation Facility, while less than 3% is used for in-plant recycling. Detailed County of Maui plant flow reports.
-
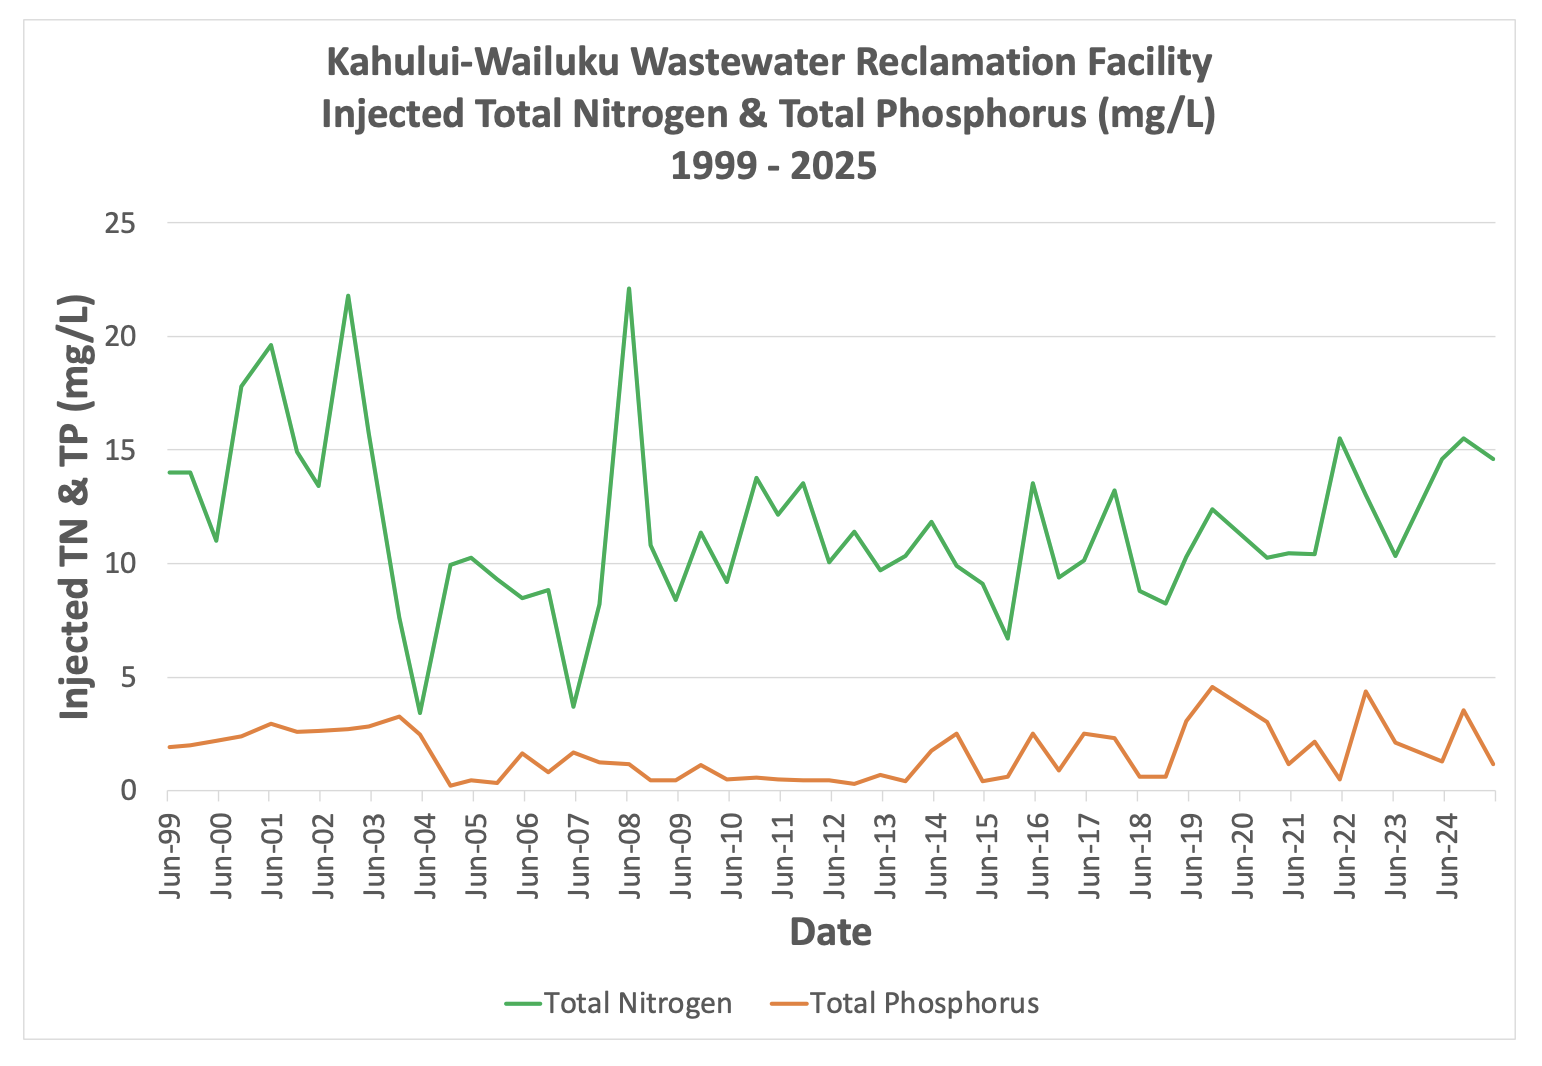
Kahului WWRF injected Total Nitrogen & Total Phosphorus concentrations (mg/L) 1999 - 2025
Injected Total Nitrogen and Total Phosphorus nutrient concentrations in Kahului injection well effluent discharges from 1999 - 2025 are shown in this chart. Detailed County of Maui plant flow reports.
-
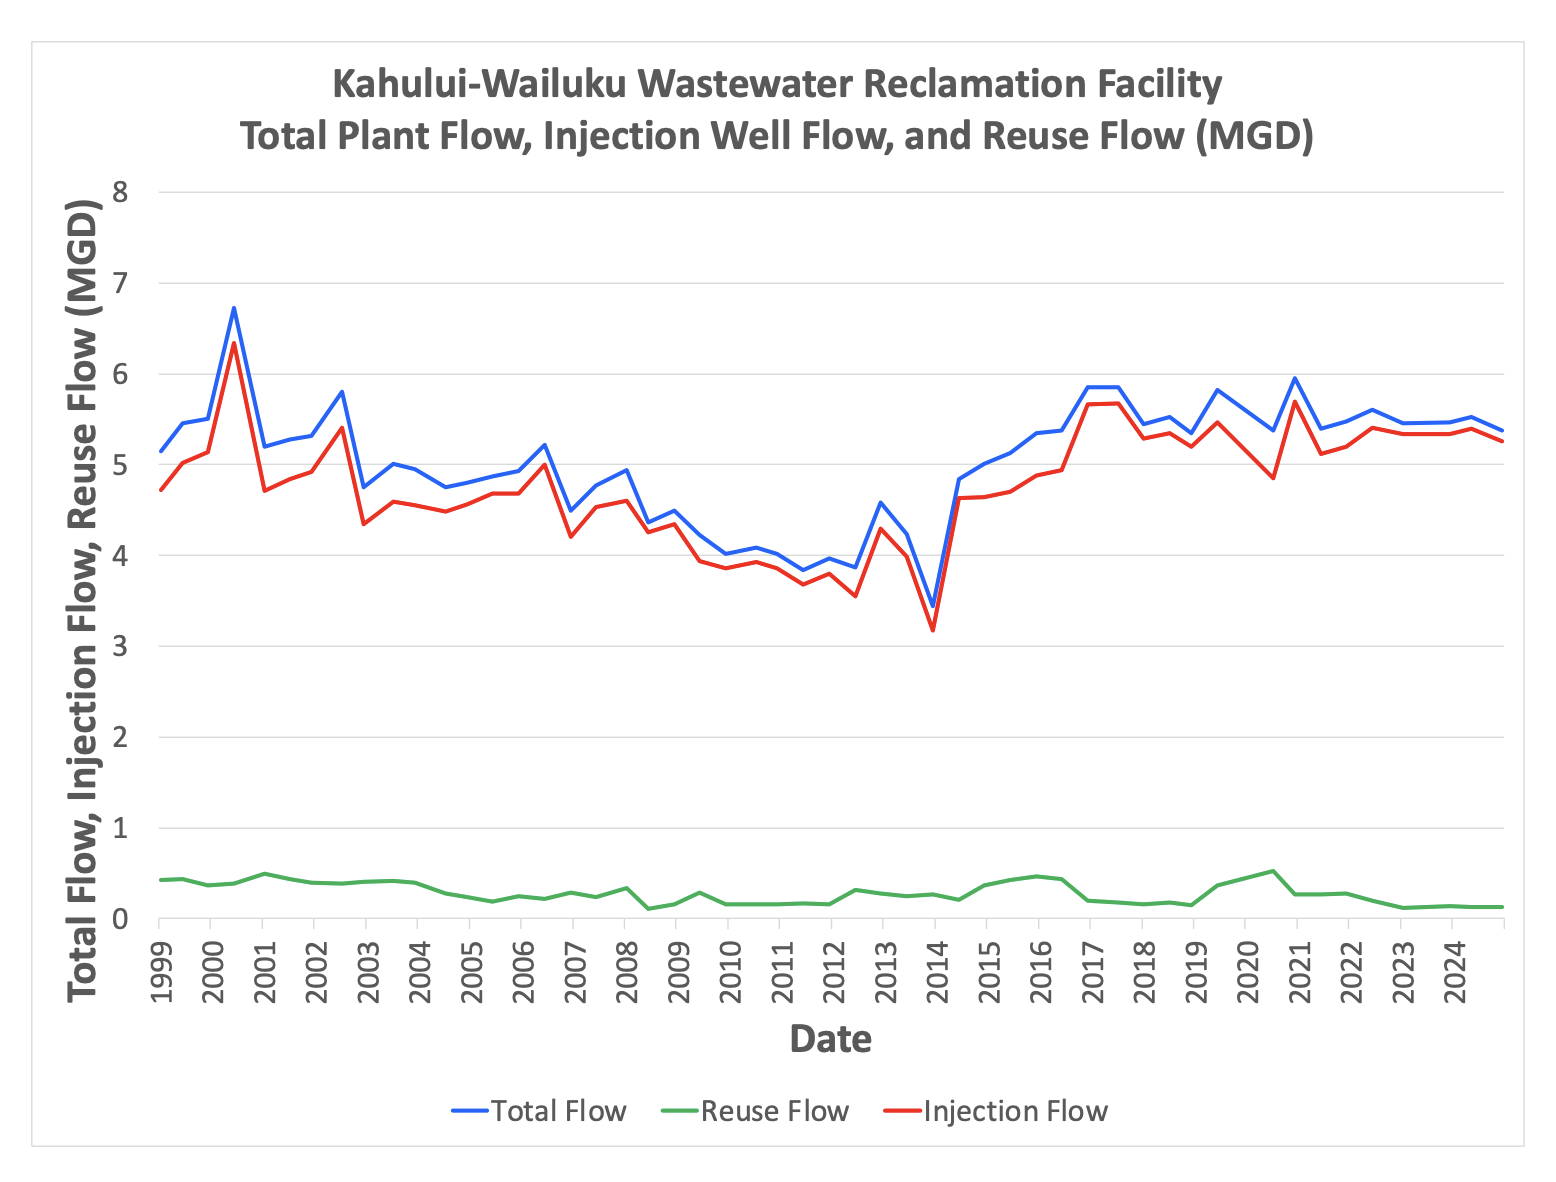
Kahului WWRF total Plant Flow, Injection Well Flow and Reuse Flow (MGD)
Total plant and injected flow rates in Kahului from 1999 - 2025. Detailed County of Maui plant flow reports.
-
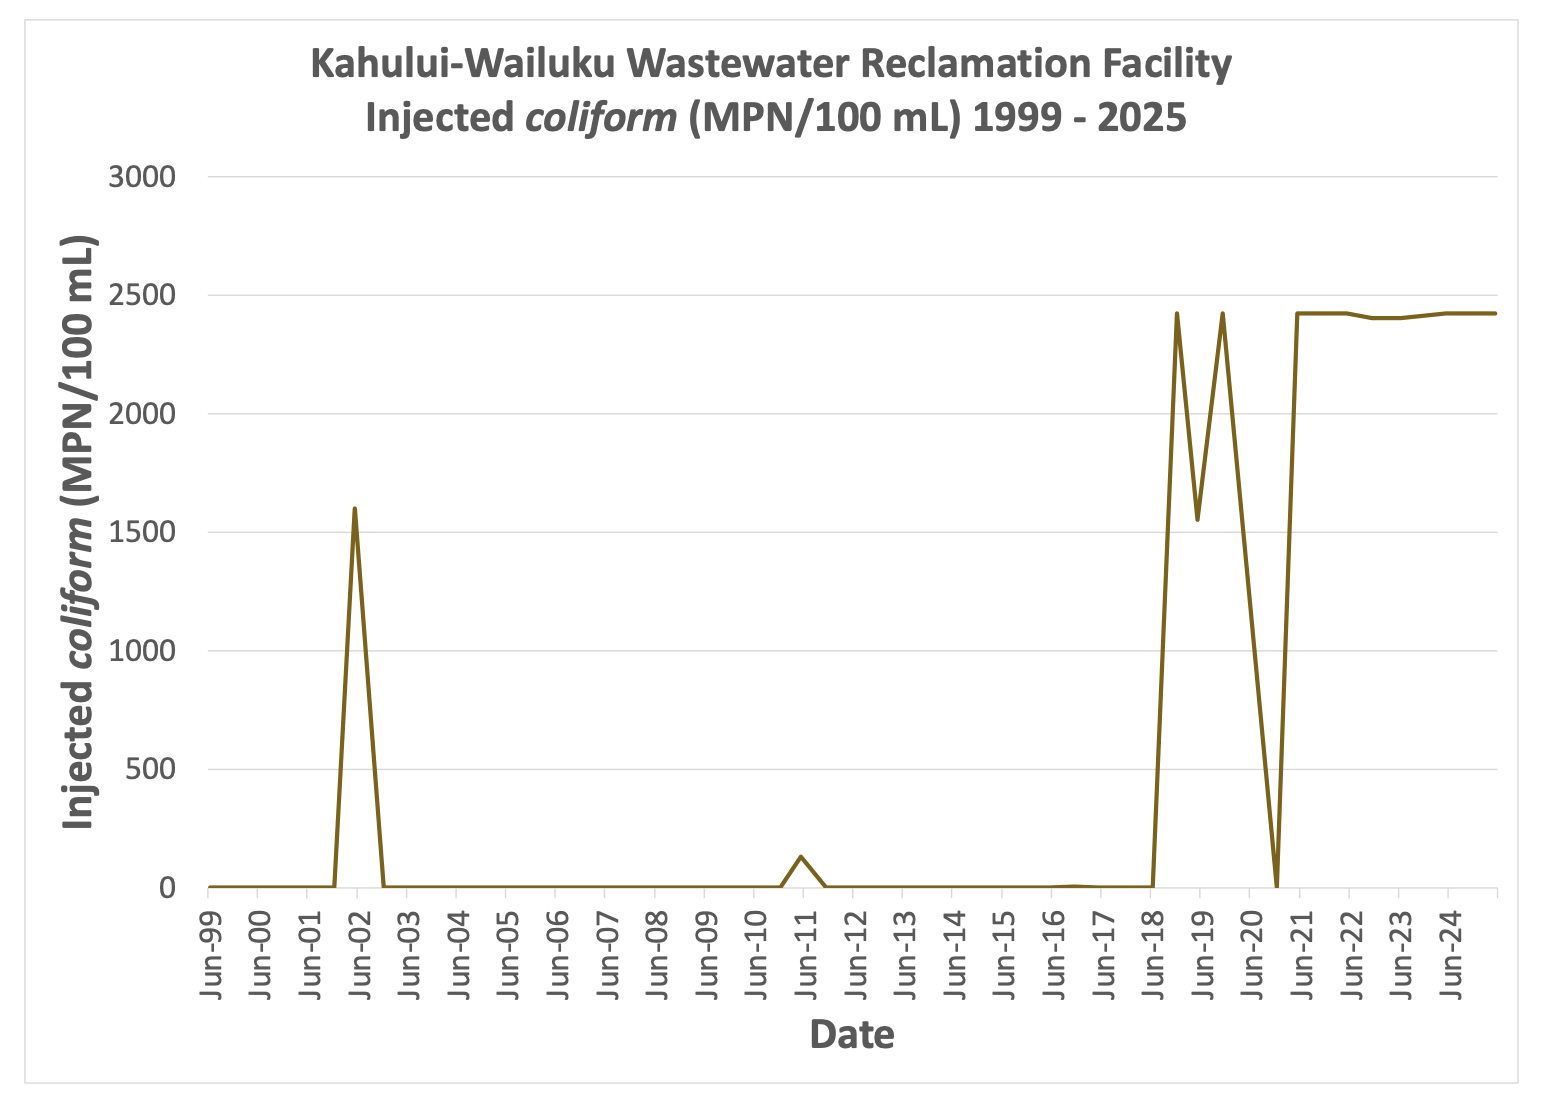
Kahului WWRF injected coliform fecal pathogen indicators (Most Probable Number of Colony Forming Units per 100 mL effluent ) 1999 - 2025 shows bacteria skyrocketing after chlorine disinfection was ceased in 2018
Fecal coliform cell counts from 1999 - 2025 shows injected municipal wastewater in Kahului appears to have been consistently disinfected until around 2018, after which fecal coliform cell counts are routinely measured above the testing detection limit of 2419.6 Most Probable Number of colony-forming (or infection forming) units per 100mL of wastewater. Detailed County of Maui plant flow reports.
-
Kahului-Wailuku Municipal Wastewater Reclamation Facility flow data and effluent water quality data summary (1999 - 2025)
Total Flow Reuse Flow Injection Flow Total Nitrogen Total Phosphorus coliform Date MGD MGD MGD mg/L mg/L MPN/100mL 6/14/99 5.147 0.424 4.723 14 1.9 < 2 11/17/99 5.458 0.437 5.021 14 2 < 2 5/17/00 5.507 0.37 5.137 10.99 2.2 < 2 11/27/00 6.725 0.385 6.34 17.8 2.38 < 2 6/7/01 5.2 0.493 4.707 19.6 2.95 no data 12/11/01 5.274 0.431 4.843 14.9 2.6 2 5/23/02 5.317 0.4 4.917 13.4 2.63 > 1600 12/27/02 5.799 0.39 5.409 21.8 2.72 < 2 5/28/03 4.752 0.407 4.345 15.7 2.84 < 2 12/17/03 5.009 0.413 4.596 7.62 3.26 < 2 5/7/04 4.954 0.399 4.555 3.41 2.48 < 2 12/7/04 4.756 0.277 4.479 9.93 0.22 < 2 5/26/05 4.802 0.24 4.562 10.27 0.46 < 2 11/15/05 4.875 0.189 4.686 9.29 0.327 < 2 5/15/06 4.933 0.249 4.684 8.49 1.65 2 11/27/06 5.217 0.213 5.004 8.83 0.81 < 2 5/11/07 4.495 0.289 4.206 3.71 1.67 < 2 11/9/07 4.776 0.238 4.538 8.19 1.25 < 2 6/13/08 4.939 0.338 4.601 22.12 1.15 2 11/13/08 4.364 0.111 4.253 10.81 0.47 < 2 5/27/09 4.496 0.154 4.342 8.38 0.46 < 2 11/25/09 4.225 0.291 3.934 11.34 1.13 < 1.8 05/10/10 4.016 0.162 3.854 9.2 0.5 2 12/03/10 4.085 0.161 3.924 13.77 0.56 < 1.8 05/26/11 4.016 0.162 3.854 12.14 0.5 130 11/30/11 3.842 0.167 3.675 13.52 0.47 < 1.8 05/24/12 3.964 0.161 3.803 10.06 0.47 < 1.8 11/30/12 3.868 0.317 3.551 11.38 0.3 < 1.8 05/14/13 4.581 0.281 4.3 9.69 0.7 < 1.8 11/14/13 4.237 0.249 3.988 10.33 0.41 < 1.8 05/22/14 3.441 0.266 3.175 11.82 1.76 < 1.8 11/14/14 4.839 0.21 4.629 9.9 2.5 < 1.8 05/08/15 5.011 0.37 4.641 9.1 0.42 < 1.8 11/16/15 5.127 0.423 4.704 6.69 0.6 < 1 05/26/16 5.348 0.467 4.881 13.53 2.5 < 1 11/18/16 5.376 0.433 4.943 9.4 0.9 4.1 05/30/17 5.856 0.194 5.662 10.12 2.5 no data 12/27/17 5.85 0.179 5.671 13.23 2.3 no data 06/06/18 5.447 0.155 5.292 8.81 0.6 < 1 12/03/18 5.523 0.178 5.345 8.23 0.62 > 2419.6 05/23/19 5.345 0.145 5.2 10.31 3.05 1553.1 11/08/19 5.828 0.367 5.461 12.38 4.56 > 2419.6 12/09/20 5.373 0.526 4.847 10.27 3.03 no data 05/13/21 5.956 0.264 5.692 10.47 1.17 > 2419.6 11/15/21 5.392 0.269 5.123 10.4 2.16 > 2419.6 05/20/22 5.476 0.274 5.202 15.51 0.49 > 2419.6 11/14/22 5.604 0.193 5.411 13 4.35 > 2400 06/01/23 5.458 0.121 5.337 10.32 2.1 > 2400 05/08/24 5.469 0.133 5.336 14.612 1.3 > 2419.6 10/28/24 5.527 0.13 5.397 15.5 3.55 > 2419.6 05/01/25 5.379 0.124 5.255 14.6 1.15 > 2419.6